Fern Park: Fire Incidents, Florida (FL)
Where are fire incidents reported in Fern Park, FL
Something went wrong! Please refresh the page.
|
| |||||||||||||||||||||||||||||||||||||||||||||||||||||||||||||||||||||||||||||||||||||||||||||||||||||||||||||
2003 - 2018 National Fire Incident Reporting System (NFIRS) incidents
- Incident types reported to NFIRS in Fern Park, FL
- 2,83963.2%Rescue & EMS
- 49811.1%Service Call
- 4439.9%Good Intent Call
- 2595.8%Hazardous Condition
- 2485.5%Fire
- 2064.6%False Alarm
- Fire incident types reported to NFIRS in Fern Park, FL
- 11144.8%Structure Fires
- 9337.5%Outside Fires
- 3413.7%Mobile Property/Vehicle Fires
- 104.0%Other
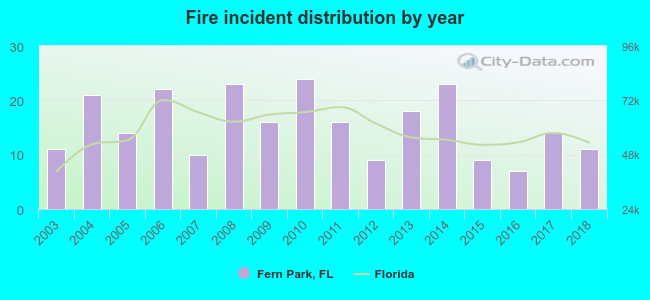 According to the data from the years 2003 - 2018 the average number of fires per year is 16. The highest number of reported fires - 24 took place in 2010, and the least - 7 in 2016. The data has a constant trend.
The average number of yearly fire incidents per 10k residents in Fern Park, FL compared to nearest cities:
(Note: Based on data for the last 3 years, including only cities with population 5,000 and above)
| Fern Park: | 13.8 |
| Casselberry: | 16.5 |
| Maitland: | 21.6 |
| Altamonte Springs: | 16.7 |
| Winter Park: | 32.9 |
| Longwood: | 38.7 |
| Winter Springs: | 11.3 |
| Lake Mary: | 18.4 |
| Orlando: | 67.7 |

 According to the data from the years 2003 - 2018 the average number of fire-related casualties per year is 1. The highest number of injuries - 4 took place in 2008, and the lowest - 0 in 2004. The data has a dropping trend.
 29.8% incidents where reported in the morning and 70.2% in the evening. The most fires (16.5%) took place on Tuesday, and the least (10.9%) on Wednesday.
 Based on the 248 reports from years 2003 - 2018 most fires (14.5%) took place during March, and the least (5.6%) in July.
 Out of all 4,493 cases reported during the years 2003 - 2018, the most belonged to the categories: Overpressure Rupture (63.2%), Hazardous Condition (11.1%), and Service Call (9.9%).
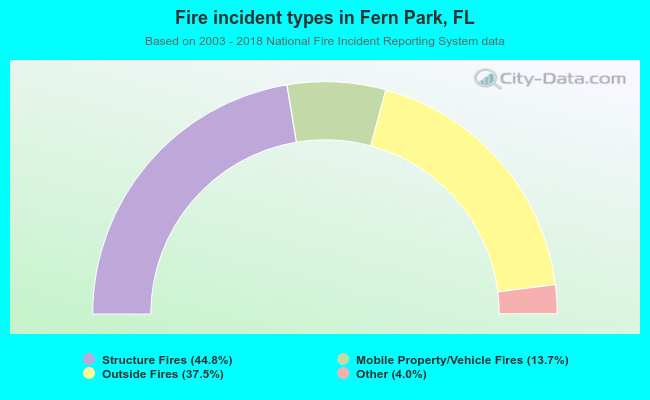 When looking into fire subcategories, the most reports belonged to: Structure Fires (44.8%), and Outside Fires (37.5%).