Winter Park: Fire Incidents, Florida (FL)
Where are fire incidents reported in Winter Park, FL
Something went wrong! Please refresh the page.
| Fire incidents reported | |
|---|---|
| Sreet name | Count |
| ORLANDO AVE | 158 |
| LEE RD | 122 |
| ALOMA AVE | 86 |
| FAIRBANKS AVE | 74 |
| PARK AVE | 66 |
| MARGARET SQ | 40 |
| ORANGE AVE | 30 |
| DENNING DR | 28 |
| PENNSYLVANIA AVE | 28 |
| LAKEMONT AVE | 26 |
| MAGNOLIA AVE | 24 |
| MORSE BLVD | 24 |
| NEW YORK AVE | 24 |
| VIA TUSCANY | 24 |
| COMSTOCK AVE | 22 |
| GAY RD | 22 |
| HOWELL BRANCH RD | 22 |
| NEW ENGLAND AVE | 22 |
| HOLT AVE | 20 |
| TEMPLE DR | 20 |
| FORSYTH RD | 18 |
| ALOMA AVE | 16 |
| BALFOUR DR | 16 |
| HOWELL BRANCH RD | 16 |
| LAKE HOWELL RD | 16 |
| PHELPS AVE | 16 |
| S LAKE BURKETT LN | 16 |
| WHITNEY WAY | 16 |
| CANTON AVE | 14 |
| SEMORAN BLVD | 14 |
| Other | 567 |
2003 - 2018 National Fire Incident Reporting System (NFIRS) incidents
- Incident types reported to NFIRS in Winter Park, FL
- 22,33966.3%Rescue & EMS
- 2,7058.0%Hazardous Condition
- 2,5137.5%Good Intent Call
- 2,2586.7%False Alarm
- 2,2166.6%Service Call
- 1,6074.8%Fire
- Fire incident types reported to NFIRS in Winter Park, FL
- 77248.0%Structure Fires
- 60937.9%Outside Fires
- 19412.1%Mobile Property/Vehicle Fires
- 322.0%Other
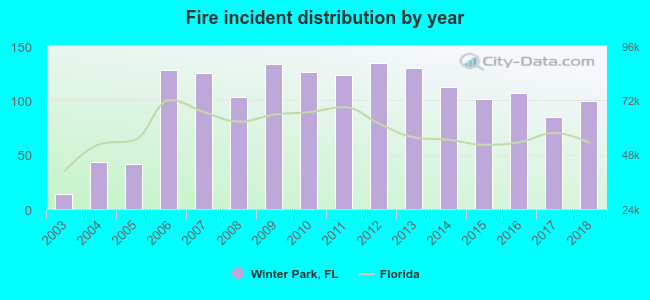 Based on the data from the years 2003 - 2018 the average number of fires per year is 100. The highest number of reported fires - 134 took place in 2012, and the least - 14 in 2003. The data has a growing trend.
The average number of yearly fire incidents per 10k residents in Winter Park, FL compared to nearest cities:
(Note: Based on data for the last 3 years, including only cities with population 5,000 and above)
| Winter Park: | 32.9 |
| Maitland: | 21.6 |
| Fern Park: | 13.8 |
| Casselberry: | 16.5 |
| Orlando: | 67.7 |
| Altamonte Springs: | 16.7 |
| Longwood: | 38.7 |
| Winter Springs: | 11.3 |
| Belle Isle: | 4.6 |
 The median response time based on all reported fire incidents is 6 minutes. This is about the same as the Florida median value.
The median response time in Winter Park, FL compared to nearest cities:
(Note: Based on data for all years, including only cities with at least 500 fire incidents)
| Winter Park: | 6 minutes |
| Maitland: | 5 minutes |
| Casselberry: | 5 minutes |
| Orlando: | 7 minutes |
| Altamonte Springs: | 5 minutes |
| Longwood: | 5 minutes |
| Winter Springs: | 5 minutes |
| Oviedo: | 6 minutes |
| Lake Mary: | 6 minutes |
 According to the reports from the years 2003 - 2018 the average number of fire-related yearly deaths is 0. The highest number of deaths - 2 took place in 2012, and the lowest - 0 in 2003. The data has a growing trend.
 According to the data from the years 2003 - 2018 the average number of fire-related casualties per year is 2. The highest number of reported injuries - 8 took place in 2012, and the lowest - 0 in 2003. The data has a growing trend.
The average number of injuries per 1,000 fires is 23. This indicator was the highest - 60 in 2012, and the lowest 0 in 2003. The trend for casualties per 1,000 fire incidents is growing. Compared to the Florida value the number of casualties per 1,000 incidents is higher.
According to the data from the years 2003 - 2018 the average number of fire-related casualties per year is 2. The highest number of reported injuries - 8 took place in 2012, and the lowest - 0 in 2003. The data has a growing trend.
The average number of injuries per 1,000 fires is 23. This indicator was the highest - 60 in 2012, and the lowest 0 in 2003. The trend for casualties per 1,000 fire incidents is growing. Compared to the Florida value the number of casualties per 1,000 incidents is higher.Casualties per 1,000 incidents in Winter Park, FL compared to nearest cities:
(Note: Based on data for all years, including only cities with at least 500 fire incidents)
| Winter Park: | 24.3 |
| Maitland: | 14.0 |
| Casselberry: | 20.4 |
| Orlando: | 19.3 |
| Altamonte Springs: | 43.1 |
| Longwood: | 29.7 |
| Winter Springs: | 36.7 |
| Oviedo: | 28.8 |
| Lake Mary: | 20.7 |
 29.1% incidents where reported in the morning and 70.9% in the evening. The most fires (15.6%) took place on Sunday, and the least (12.3%) on Wednesday.
 Based on the 1,607 fire incident reports from years 2003 - 2018 most fires (11.4%) took place during March, and the least (6.7%) in August.
 Out of all 33,683 cases reported during the years 2003 - 2018, the most belonged to the categories: Rescue & EMS (66.3%), Hazardous Condition (8.0%), and Good Intent Call (7.5%).
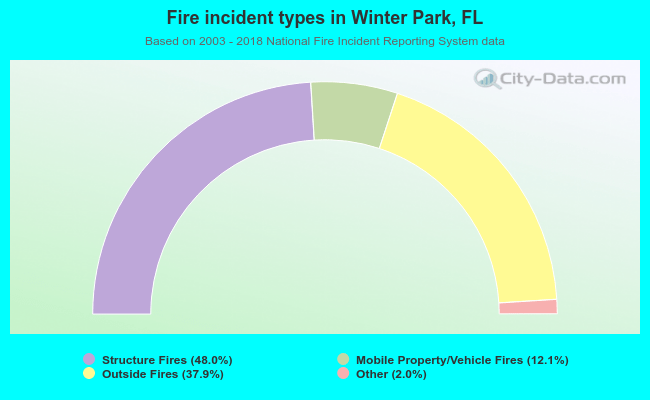 When looking into fire subcategories, the most incidents belonged to: Structure Fires (48.0%), and Outside Fires (37.9%).