Fife: Fire Incidents, Washington (WA)
Where are fire incidents reported in Fife, WA
Something went wrong! Please refresh the page.
| Fire incidents reported | |
|---|---|
| Sreet name | Count |
| PACIFIC | 262 |
| 20TH ST | 196 |
| PACIFIC HWY | 132 |
| 54TH AVE | 116 |
| 62ND AVE | 114 |
| 70TH AVE | 80 |
| 16TH ST | 62 |
| VALLEY AVE | 58 |
| NORTH | 48 |
| 58TH AVE | 46 |
| 33RD AVE | 42 |
| 4TH ST | 38 |
| 23RD ST | 34 |
| FREEMAN RD | 32 |
| 54TH AV E | 28 |
| FRANK ALBERT RD E | 22 |
| 12TH ST | 20 |
| 70TH AV E | 20 |
| 12TH ST E | 18 |
| 20TH ST E | 16 |
| 4TH ST E | 16 |
| FRANK | 16 |
| I5 | 16 |
| WILLOW RD | 16 |
| SB I 5 FWY | 14 |
| 54TH AVE E | 12 |
| 34TH AVE | 10 |
| 51ST AVE | 10 |
| 70TH AVE E | 10 |
| 8TH ST | 10 |
2002 - 2018 National Fire Incident Reporting System (NFIRS) incidents
- Incident types reported to NFIRS in Fife, WA
- 8,06567.0%Rescue & EMS
- 8977.5%Fire
- 8497.1%Good Intent Call
- 6945.8%Service Call
- 5754.8%Hazardous Condition
- 5344.4%False Alarm
- 4093.4%Special Incident
- Fire incident types reported to NFIRS in Fife, WA
- 63370.6%Outside Fires
- 13915.5%Structure Fires
- 12413.8%Mobile Property/Vehicle Fires
- 10.1%Other
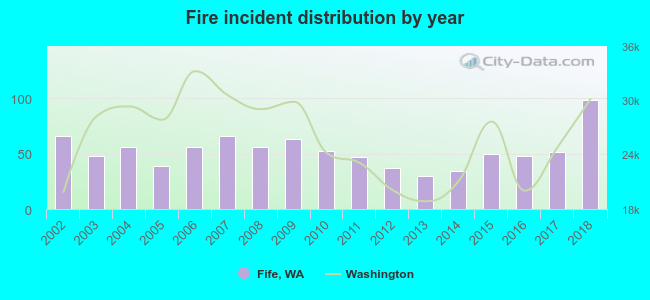 Based on the data from the years 2002 - 2018 the average number of fires per year is 53. The highest number of reported fires - 98 took place in 2018, and the least - 30 in 2013. The data has an increasing trend.
The average number of yearly fire incidents per 10k residents in Fife, WA compared to nearest cities:
(Note: Based on data for the last 3 years, including only cities with population 5,000 and above)
| Fife: | 68.8 |
| Milton: | 38.0 |
| Edgewood: | 24.6 |
| Puyallup: | 47.5 |
| Tacoma: | 50.3 |
| Federal Way: | 46.6 |
| Pacific: | 31.1 |
| Sumner: | 73.0 |
| Fircrest: | 9.5 |
 The median response time based on all reported fire incidents is 5 minutes. This is lower compared to the state median value.
The median response time in Fife, WA compared to nearest cities:
(Note: Based on data for all years, including only cities with at least 500 fire incidents)
| Fife: | 5 minutes |
| Milton: | 7 minutes |
| Edgewood: | 7 minutes |
| Puyallup: | 7 minutes |
| Tacoma: | 5 minutes |
| Federal Way: | 6 minutes |
| Sumner: | 8 minutes |
| Parkland: | 6 minutes |
| Auburn: | 6 minutes |
 Based on the reports from the years 2002 - 2018 the average number of fire-related yearly casualties is 0. The highest number of reported casualties - 1 took place in 2003, and the lowest - 0 in 2002. The data has a constant trend.
The average number of injuries per 1,000 fire incidents is 4. This indicator was the highest - 26 in 2005, and the lowest 0 in 2002. The trend for injuries per 1,000 incidents is constant. Compared to the state value the number of injuries per 1,000 incidents is much lower.
Based on the reports from the years 2002 - 2018 the average number of fire-related yearly casualties is 0. The highest number of reported casualties - 1 took place in 2003, and the lowest - 0 in 2002. The data has a constant trend.
The average number of injuries per 1,000 fire incidents is 4. This indicator was the highest - 26 in 2005, and the lowest 0 in 2002. The trend for injuries per 1,000 incidents is constant. Compared to the state value the number of injuries per 1,000 incidents is much lower.
 34.2% incidents where reported in the morning and 65.8% in the evening. The most fires (15.8%) took place on Monday, and the least (12.8%) on Wednesday.
 Based on the 897 fires from years 2002 - 2018 most fires (23.2%) took place during July, and the least (3.1%) in March.
 Out of all 12,030 cases reported during the years 2002 - 2018, the most belonged to the categories: Rescue & EMS (67.0%), Fire (7.5%), and Good Intent Call (7.1%).
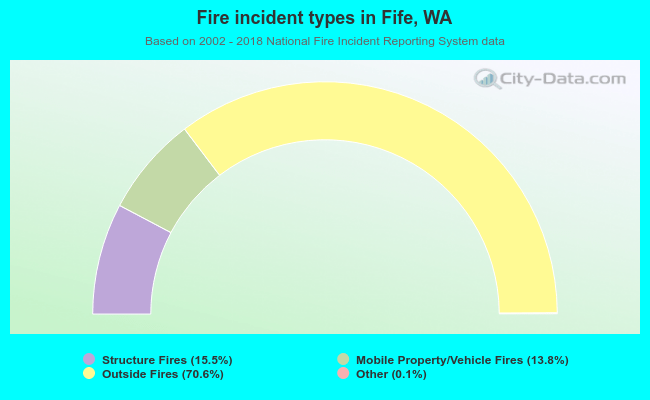 When looking into fire subcategories, the most incidents belonged to: Outside Fires (70.6%), and Structure Fires (15.5%).