Pacific: Fire Incidents, Washington (WA)
Where are fire incidents reported in Pacific, WA
Something went wrong! Please refresh the page.
|
| |||||||||||||||||||||||||||||||||||||||||||||||||||||||||||||||||||||||||||||||||||||||||||||||||||||||||||||
2002 - 2018 National Fire Incident Reporting System (NFIRS) incidents
- Incident types reported to NFIRS in Pacific, WA
- 1,48261.0%Rescue & EMS
- 27011.1%Fire
- 2018.3%Service Call
- 1958.0%Hazardous Condition
- 1948.0%Good Intent Call
- 692.8%False Alarm
- 140.6%Special Incident
- 30.1%Overpressure Rupture
- 30.1%Severe Weather
- Fire incident types reported to NFIRS in Pacific, WA
- 12847.4%Structure Fires
- 9334.4%Outside Fires
- 4115.2%Mobile Property/Vehicle Fires
- 83.0%Other
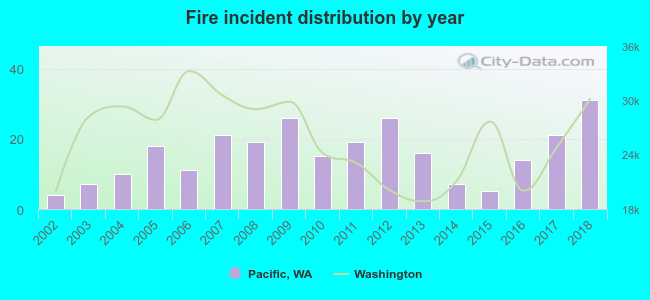 Based on the data from the years 2002 - 2018 the average number of fires per year is 16. The highest number of fire incidents - 31 took place in 2018, and the least - 4 in 2002. The data has an increasing trend.
The average number of yearly fire incidents per 10k residents in Pacific, WA compared to nearest cities:
(Note: Based on data for the last 3 years, including only cities with population 5,000 and above)
| Pacific: | 31.1 |
| Edgewood: | 24.6 |
| Auburn: | 54.1 |
| Milton: | 38.0 |
| Sumner: | 73.0 |
| Lake Tapps: | 10.1 |
| Federal Way: | 46.6 |
| Fife: | 68.8 |
| Puyallup: | 47.5 |
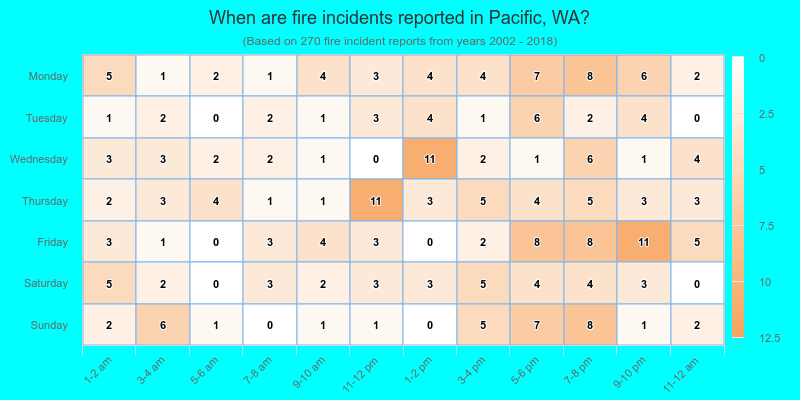
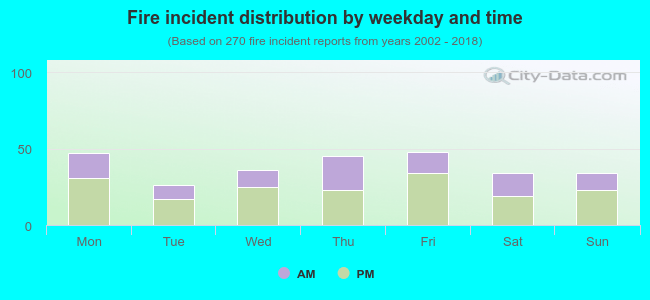 36.3% incidents where reported in the morning and 63.7% in the evening. The most fires (17.8%) took place on Friday, and the least (9.6%) on Tuesday.
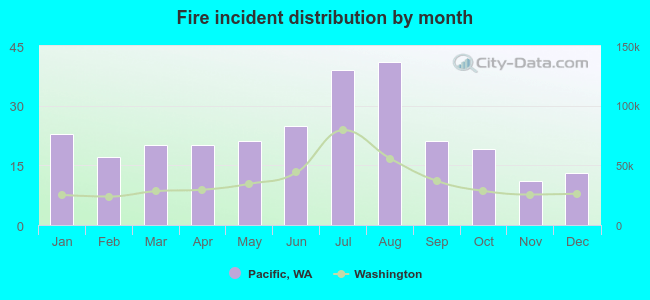 According to the 270 incident reports from years 2002 - 2018 most fires (15.2%) took place during August, and the least (4.1%) in November.
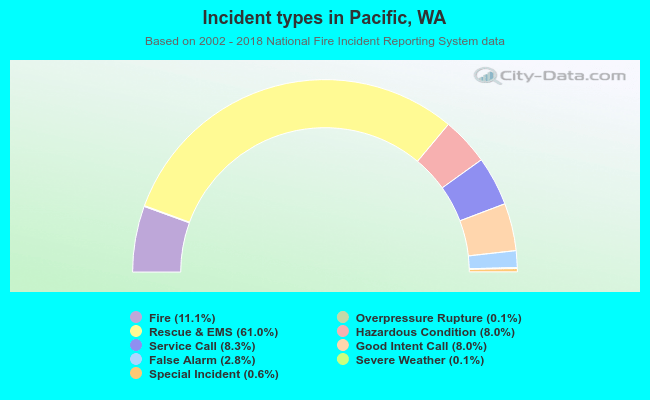 Out of all 2,431 cases reported during the years 2002 - 2018, the most belonged to the categories: Rescue & EMS (61.0%), Fire (11.1%), and Service Call (8.3%).
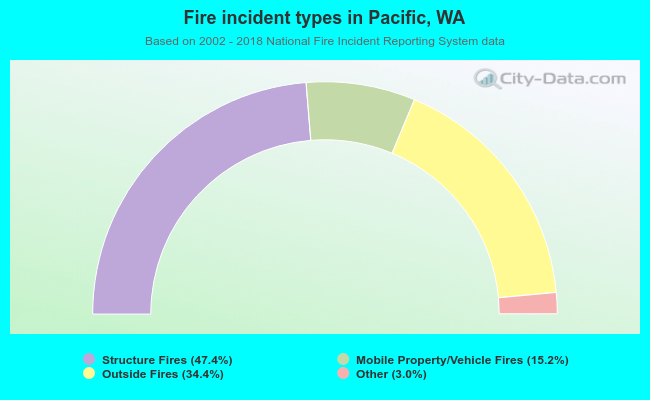 When looking into fire subcategories, the most reports belonged to: Structure Fires (47.4%), and Outside Fires (34.4%).