Lake Tapps: Fire Incidents, Washington (WA)
Where are fire incidents reported in Lake Tapps, WA
Something went wrong! Please refresh the page.
|
| |||||||||||||||||||||||||||||||||||||||||||||||||||||||||||||||||||||||||||||||||||||||||||||||||||||||||||||
2007 - 2018 National Fire Incident Reporting System (NFIRS) incidents
- Incident types reported to NFIRS in Lake Tapps, WA
- 1,12461.8%Rescue & EMS
- 25614.1%Service Call
- 1659.1%Good Intent Call
- 1216.7%Fire
- 874.8%Hazardous Condition
- 643.5%False Alarm
- Fire incident types reported to NFIRS in Lake Tapps, WA
- 5444.6%Structure Fires
- 4839.7%Outside Fires
- 129.9%Mobile Property/Vehicle Fires
- 75.8%Other
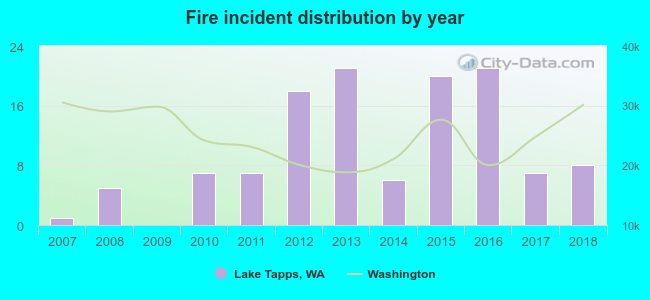 According to the data from the years 2007 - 2018 the average number of fires per year is 10. The highest number of reported fires - 21 took place in 2013, and the least - 0 in 2009. The data has a rising trend.
The average number of yearly fire incidents per 10k residents in Lake Tapps, WA compared to nearest cities:
(Note: Based on data for the last 3 years, including only cities with population 5,000 and above)
| Lake Tapps: | 10.1 |
| Bonney Lake: | 67.3 |
| Sumner: | 73.0 |
| Pacific: | 31.1 |
| Auburn: | 54.1 |
| Edgewood: | 24.6 |
| Puyallup: | 47.5 |
| Milton: | 38.0 |
| Enumclaw: | 59.8 |

 34.7% incidents where reported in the morning and 65.3% in the evening. The most fires (17.4%) took place on Thursday, and the least (8.3%) on Wednesday.
 According to the 121 fires from years 2007 - 2018 most fires (23.1%) took place during July, and the least (3.3%) in May.
 Out of all 1,819 cases reported during the years 2007 - 2018, the most belonged to the categories: Overpressure Rupture (61.8%), Hazardous Condition (14.1%), and Service Call (9.1%).
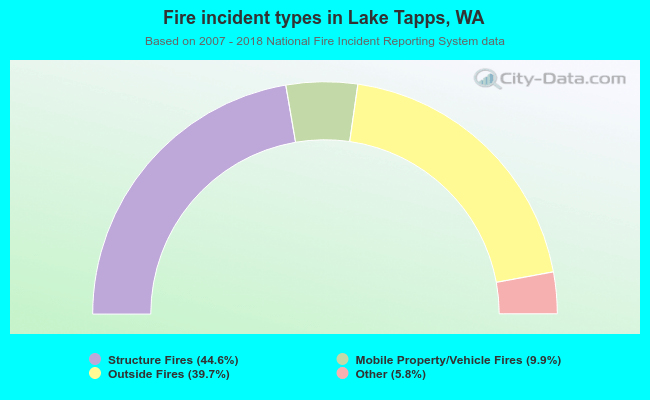 When looking into fire subcategories, the most reports belonged to: Structure Fires (44.6%), and Outside Fires (39.7%).