Geneva: Fire Incidents, Illinois (IL)
Where are fire incidents reported in Geneva, IL
Something went wrong! Please refresh the page.
| Fire incidents reported | |
|---|---|
| Sreet name | Count |
| RANDALL RD | 188 |
| STATE ST | 168 |
| COMMONS DR | 60 |
| BENNETT ST | 58 |
| KIRK RD | 48 |
| KESLINGER RD | 42 |
| FABYAN PKWY | 38 |
| PEYTON ST | 38 |
| KANEVILLE RD | 36 |
| 1ST ST | 34 |
| RIVER LN | 32 |
| OLD KIRK RD | 30 |
| SOUTH ST | 28 |
| WESTERN AVE | 28 |
| 3RD ST | 26 |
| PEPPER VALLEY DR | 26 |
| STATE | 26 |
| EAST SIDE DR | 24 |
| FARGO BLVD | 22 |
| LARRABEE DR | 22 |
| DIVISION ST | 18 |
| FABYAN PKY | 18 |
| HARRISON ST | 18 |
| LEWIS RD | 18 |
| PECK RD | 18 |
| BRITTANY CT | 16 |
| CONSIDINE RD | 16 |
| GENEVA DR | 16 |
| GLENGARRY DR | 16 |
| PILLSBURY DR | 16 |
| Other | 177 |
2002 - 2018 National Fire Incident Reporting System (NFIRS) incidents
- Incident types reported to NFIRS in Geneva, IL
- 9,35444.5%Rescue & EMS
- 3,96618.9%Service Call
- 2,89313.8%False Alarm
- 1,8288.7%Hazardous Condition
- 1,6167.7%Good Intent Call
- 1,3216.3%Fire
- 260.1%Overpressure Rupture
- Fire incident types reported to NFIRS in Geneva, IL
- 76557.9%Structure Fires
- 39029.5%Outside Fires
- 1037.8%Mobile Property/Vehicle Fires
- 634.8%Other
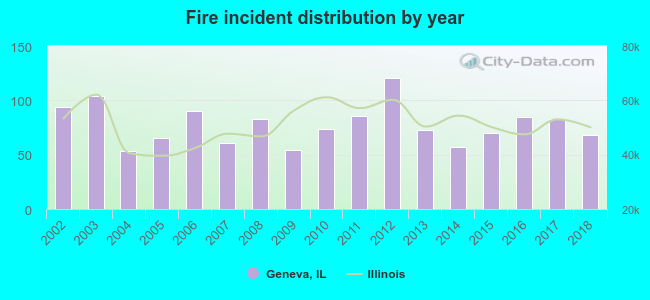 According to the data from the years 2002 - 2018 the average number of fire incidents per year is 78. The highest number of reported fire incidents - 121 took place in 2012, and the least - 53 in 2004. The data has a decreasing trend.
The average number of yearly fire incidents per 10k residents in Geneva, IL compared to nearest cities:
(Note: Based on data for the last 3 years, including only cities with population 5,000 and above)
| Geneva: | 36.2 |
| Batavia: | 30.0 |
| West Chicago: | 40.1 |
| North Aurora: | 16.9 |
| Campton Hills: | 1.3 |
| South Elgin: | 28.5 |
| Warrenville: | 33.7 |
| Elburn: | 84.5 |
| Winfield: | 33.8 |
 The median response time based on all reported fire incidents is 5 minutes. This is comparable to the state median value.
The median response time in Geneva, IL compared to nearest cities:
(Note: Based on data for all years, including only cities with at least 500 fire incidents)
| Geneva: | 5 minutes |
| St. Charles: | 5 minutes |
| Batavia: | 5 minutes |
| West Chicago: | 6 minutes |
| North Aurora: | 5 minutes |
| South Elgin: | 5 minutes |
| Warrenville: | 5 minutes |
| Elburn: | 8 minutes |
| Winfield: | 5 minutes |
 Based on the reports from the years 2002 - 2018 the average number of fire-related casualties per year is 0. The highest number of reported injuries - 2 took place in 2017, and the lowest - 0 in 2002. The data has a constant trend.
The average number of casualties per 1,000 fire incidents is 4. This indicator was the highest - 24 in 2017, and the lowest 0 in 2002. The trend for injuries per 1,000 fire incidents is constant. Compared to the state value the number of injuries per 1,000 incidents is much lower.
Based on the reports from the years 2002 - 2018 the average number of fire-related casualties per year is 0. The highest number of reported injuries - 2 took place in 2017, and the lowest - 0 in 2002. The data has a constant trend.
The average number of casualties per 1,000 fire incidents is 4. This indicator was the highest - 24 in 2017, and the lowest 0 in 2002. The trend for injuries per 1,000 fire incidents is constant. Compared to the state value the number of injuries per 1,000 incidents is much lower.Casualties per 1,000 incidents in Geneva, IL compared to nearest cities:
(Note: Based on data for all years, including only cities with at least 500 fire incidents)
| Geneva: | 4.5 |
| St. Charles: | 7.9 |
| Batavia: | 10.8 |
| West Chicago: | 20.6 |
| North Aurora: | 0.0 |
| South Elgin: | 10.9 |
| Warrenville: | 33.4 |
| Elburn: | 1.0 |
| Winfield: | 3.4 |
 31.6% incidents where reported in the morning and 68.4% in the evening. The most fires (15.6%) took place on Monday, and the least (11.3%) on Thursday.
 Based on the 1,321 fires from years 2002 - 2018 most fires (11.2%) took place during June, and the least (4.5%) in January.
 Out of all 21,039 cases reported during the years 2002 - 2018, the most belonged to the categories: Rescue & EMS (44.5%), Service Call (18.9%), and False Alarm (13.8%).
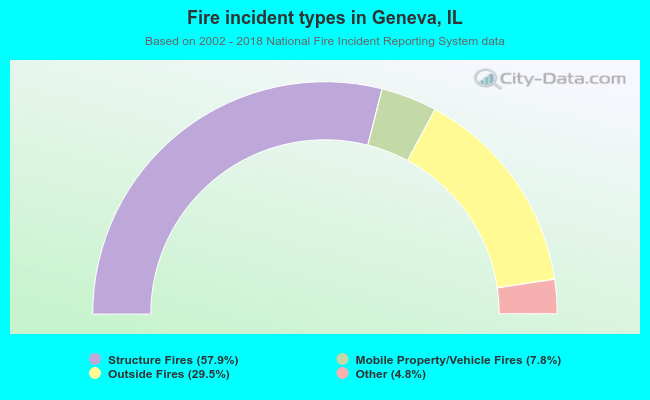 When looking into fire subcategories, the most incidents belonged to: Structure Fires (57.9%), and Outside Fires (29.5%).