Little Canada: Fire Incidents, Minnesota (MN)
Where are fire incidents reported in Little Canada, MN
Something went wrong! Please refresh the page.
|
| |||||||||||||||||||||||||||||||||||||||||||||||||||||||||||||||||||||||||||||||||||||||||||||||||||||||||||||
2002 - 2018 National Fire Incident Reporting System (NFIRS) incidents
- Incident types reported to NFIRS in Little Canada, MN
- 77334.8%Fire
- 46220.8%Hazardous Condition
- 38917.5%False Alarm
- 27912.6%Rescue & EMS
- 1577.1%Good Intent Call
- 1496.7%Service Call
- 110.5%Overpressure Rupture
- Fire incident types reported to NFIRS in Little Canada, MN
- 47261.1%Structure Fires
- 17322.4%Mobile Property/Vehicle Fires
- 12416.0%Outside Fires
- 40.5%Other
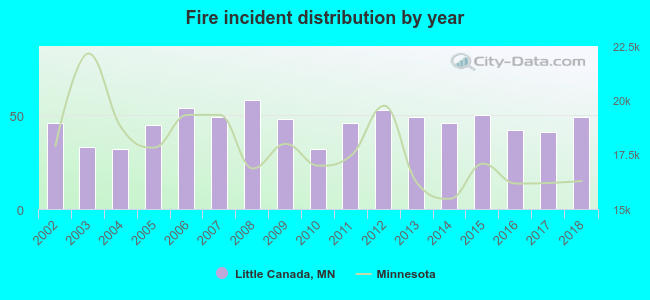 According to the data from the years 2002 - 2018 the average number of fires per year is 45. The highest number of reported fires - 58 took place in 2008, and the least - 32 in 2004. The data has a growing trend.
The average number of yearly fire incidents per 10k residents in Little Canada, MN compared to nearest cities:
(Note: Based on data for the last 3 years, including only cities with population 5,000 and above)
| Little Canada: | 43.0 |
| Vadnais Heights: | 27.4 |
| Roseville: | 26.0 |
| Maplewood: | 31.1 |
| Arden Hills: | 20.6 |
| Shoreview: | 11.8 |
| White Bear Lake: | 19.1 |
| Falcon Heights: | 23.6 |
| New Brighton: | 30.8 |
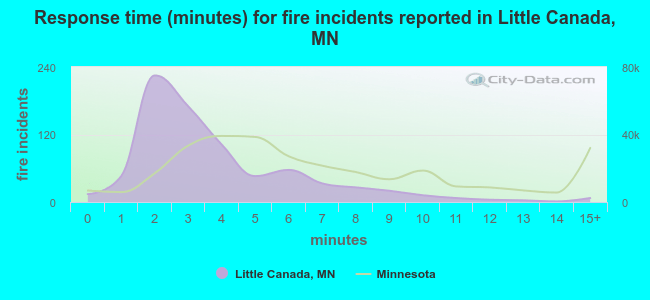 The median response time based on all reported fire incidents is 3 minutes. This is much lower than the state median value.
The median response time in Little Canada, MN compared to nearest cities:
(Note: Based on data for all years, including only cities with at least 500 fire incidents)
| Little Canada: | 3 minutes |
| Vadnais Heights: | 6 minutes |
| Roseville: | 5 minutes |
| Maplewood: | 5 minutes |
| Shoreview: | 6 minutes |
| White Bear Lake: | 6 minutes |
| New Brighton: | 4 minutes |
| Oakdale: | 5 minutes |
| Mounds View: | 7 minutes |
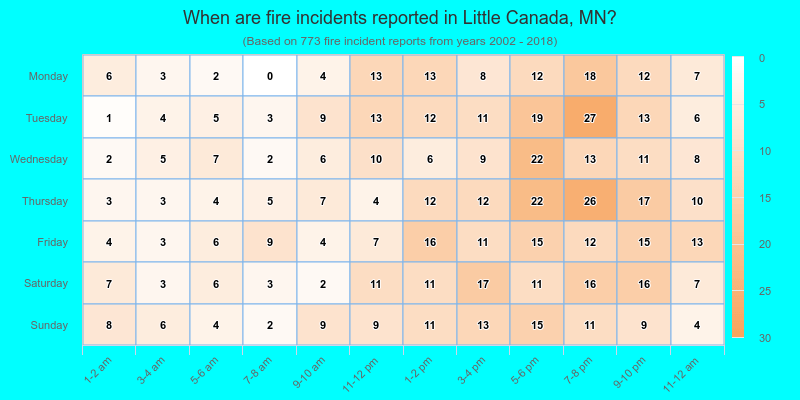
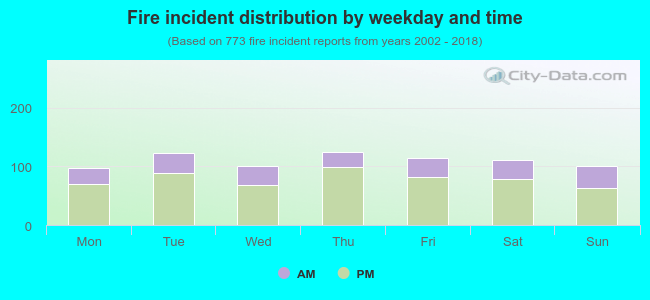 29.0% incidents where reported in the morning and 71.0% in the evening. The most fires (16.2%) took place on Thursday, and the least (12.7%) on Monday.
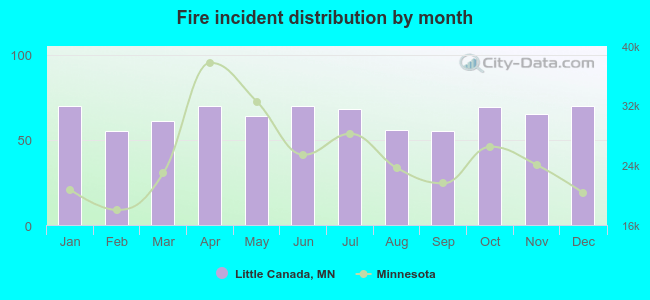 Based on the 773 fires from years 2002 - 2018 most fires (9.1%) took place during January, and the least (7.1%) in February.
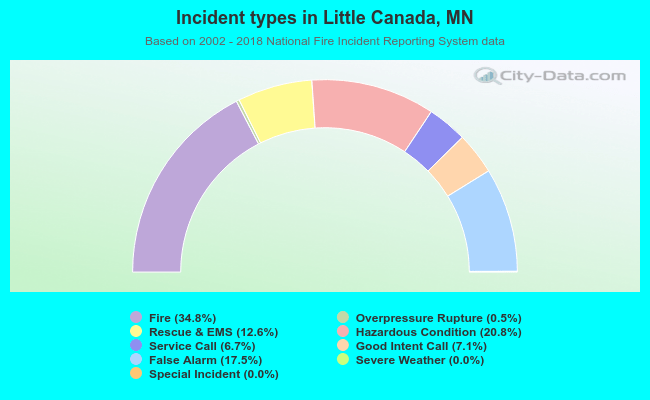 Out of all 2,222 cases reported during the years 2002 - 2018, the most belonged to the categories: Fire (34.8%), Hazardous Condition (20.8%), and False Alarm (17.5%).
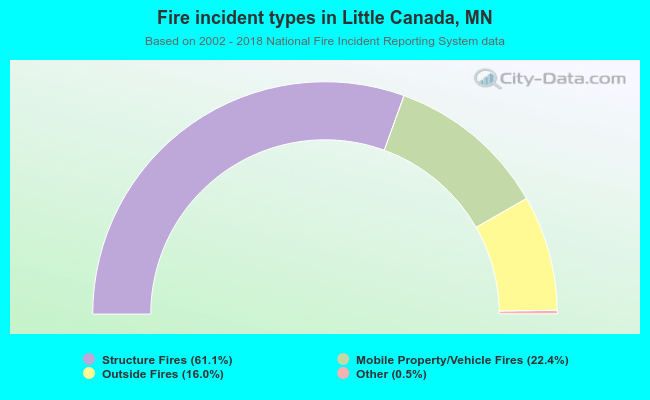 When looking into fire subcategories, the most incidents belonged to: Structure Fires (61.1%), and Mobile Property/Vehicle Fires (22.4%).