Long Beach: Fire Incidents, California (CA)
Where are fire incidents reported in Long Beach, CA
Something went wrong! Please refresh the page.
| Fire incidents reported | |
|---|---|
| Sreet name | Count |
| ATLANTIC AVE | 482 |
| 7TH ST | 416 |
| LONG BEACH BLVD | 396 |
| OCEAN BLVD | 378 |
| ANAHEIM ST | 348 |
| 4TH ST | 310 |
| PINE AVE | 298 |
| PACIFIC COAST HWY | 276 |
| CHERRY AVE | 252 |
| CARSON ST | 238 |
| WILLOW ST | 234 |
| 2ND ST | 232 |
| PACIFIC AVE | 230 |
| PACIFIC COAST HY | 220 |
| CHESTNUT AVE | 214 |
| 3RD ST | 210 |
| LONG BEACH BL | 202 |
| ORANGE AVE | 194 |
| SB 710 FWY | 194 |
| ARTESIA BLVD | 192 |
| CEDAR AVE | 186 |
| ELM AVE | 178 |
| LINDEN AVE | 178 |
| BROADWAY | 176 |
| 10TH ST | 174 |
| NB 710 FWY | 168 |
| SPRING ST | 168 |
| LOCUST AVE | 162 |
| 6TH ST | 158 |
| 1ST ST | 132 |
| Other | 4,051 |
2005 - 2018 National Fire Incident Reporting System (NFIRS) incidents
- Incident types reported to NFIRS in Long Beach, CA
- 94,99561.7%Rescue & EMS
- 22,07214.3%Good Intent Call
- 12,4378.1%Hazardous Condition
- 11,2477.3%Fire
- 8,5535.6%Service Call
- 4,2602.8%False Alarm
- 4240.3%Special Incident
- Fire incident types reported to NFIRS in Long Beach, CA
- 4,21937.5%Outside Fires
- 3,80833.9%Structure Fires
- 1,91117.0%Mobile Property/Vehicle Fires
- 1,30911.6%Other
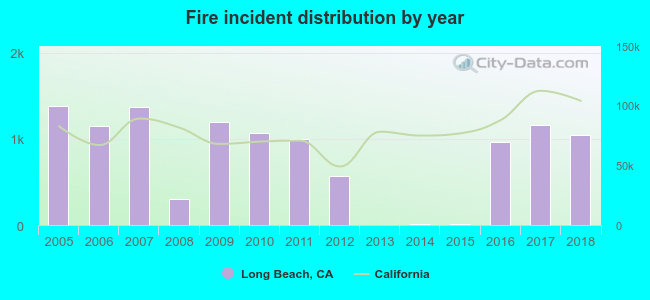 According to the data from the years 2005 - 2018 the average number of fire incidents per year is 803. The highest number of fires - 1,385 took place in 2005, and the least - 3 in 2013. The data has a decreasing trend.
The average number of yearly fire incidents per 10k residents in Long Beach, CA compared to nearest cities:
(Note: Based on data for the last 3 years, including only cities with population 5,000 and above)
| Long Beach: | 22.3 |
| Signal Hill: | 32.1 |
| Lakewood: | 12.0 |
| Rossmoor: | 2.3 |
| Hawaiian Gardens: | 20.8 |
| Seal Beach: | 17.8 |
| Los Alamitos: | 16.2 |
| Bellflower: | 19.1 |
| Artesia: | 14.4 |
 The median response time based on all reported fire incidents is 5 minutes. This is lower compared to the California median value.
The median response time in Long Beach, CA compared to nearest cities:
(Note: Based on data for all years, including only cities with at least 500 fire incidents)
| Long Beach: | 5 minutes |
| Lakewood: | 4 minutes |
| Seal Beach: | 5 minutes |
| Bellflower: | 4 minutes |
| Carson: | 4 minutes |
| Paramount: | 5 minutes |
| Cerritos: | 5 minutes |
| Cypress: | 5 minutes |
| Compton: | 6 minutes |
 According to the reports from the years 2005 - 2018 the average number of fire-related yearly deaths is 1. The highest number of deaths - 6 took place in 2011, and the lowest - 0 in 2005. The data has a constant trend.
The average number of deaths per 1,000 fire incidents is 1. This indicator was the highest - 6 in 2011, and the lowest 0 in 2005. The trend for fatalities per 1,000 incidents is decreasing. Compared to the state value the number of fatalities per 1,000 incidents is lower.
According to the reports from the years 2005 - 2018 the average number of fire-related yearly deaths is 1. The highest number of deaths - 6 took place in 2011, and the lowest - 0 in 2005. The data has a constant trend.
The average number of deaths per 1,000 fire incidents is 1. This indicator was the highest - 6 in 2011, and the lowest 0 in 2005. The trend for fatalities per 1,000 incidents is decreasing. Compared to the state value the number of fatalities per 1,000 incidents is lower.
 Based on the data from the years 2005 - 2018 the average number of fire-related casualties per year is 4. The highest number of injuries - 17 took place in 2007, and the lowest - 0 in 2013. The data has a decreasing trend.
The average number of casualties per 1,000 fires is 4. This indicator was the highest - 12 in 2007, and the lowest 0 in 2013. The trend for casualties per 1,000 fires is decreasing. Compared to the state value the number of casualties per 1,000 fires is lower.
Based on the data from the years 2005 - 2018 the average number of fire-related casualties per year is 4. The highest number of injuries - 17 took place in 2007, and the lowest - 0 in 2013. The data has a decreasing trend.
The average number of casualties per 1,000 fires is 4. This indicator was the highest - 12 in 2007, and the lowest 0 in 2013. The trend for casualties per 1,000 fires is decreasing. Compared to the state value the number of casualties per 1,000 fires is lower.Casualties per 1,000 incidents in Long Beach, CA compared to nearest cities:
(Note: Based on data for all years, including only cities with at least 500 fire incidents)
| Long Beach: | 4.6 |
| Lakewood: | 0.0 |
| Seal Beach: | 11.6 |
| Bellflower: | 0.0 |
| Carson: | 1.5 |
| Paramount: | 0.0 |
| Cerritos: | 0.0 |
| Cypress: | 24.5 |
| Compton: | 1.0 |
 35.4% incidents where reported in the morning and 64.6% in the evening. The most fires (15.4%) took place on Sunday, and the least (13.7%) on Thursday.
 Based on the 11,247 fire incidents from years 2005 - 2018 most fires (11.0%) took place during July, and the least (6.5%) in June.
 Out of all 154,055 cases reported during the years 2005 - 2018, the most belonged to the categories: Rescue & EMS (61.7%), Good Intent Call (14.3%), and Hazardous Condition (8.1%).
 When looking into fire subcategories, the most incidents belonged to: Outside Fires (37.5%), and Structure Fires (33.9%).