Marathon: Fire Incidents, Florida (FL)
Where are fire incidents reported in Marathon, FL
Something went wrong! Please refresh the page.
| Fire incidents reported | |
|---|---|
| Sreet name | Count |
| OVERSEAS HWY | 250 |
| OVERSEAS HWY | 210 |
| OVERSEAS | 66 |
| HAWKS CAY BLVD | 34 |
| OVERSEAS HIGHWAY | 34 |
| SOMBRERO BEACH RD | 34 |
| SOMBRERO BLVD | 26 |
| 92ND ST | 12 |
| COCO PLUM DR | 12 |
| 1ST AVE | 10 |
| AVIATION BLVD | 10 |
| OCEAN DR | 10 |
| US1 | 10 |
| 109TH ST | 8 |
| 63RD ST | 8 |
| 84TH ST | 8 |
| AVIATION BLVD | 8 |
| CALLE ENSUENO | 8 |
| COCO PLUM DR. DR | 8 |
| GULFSTREAM BLVD | 8 |
| HARBOR DR | 8 |
| KNIGHTS KEY BLVD | 8 |
| SOMBRERO BEACH | 8 |
| 15TH ST | 6 |
| 15TH ST | 6 |
| 2ND AVE | 6 |
| 75TH ST | 6 |
| 82 ST | 6 |
| COCO PLUM DR DR | 6 |
| CONCH AVE | 6 |
| Other | 5 |
2002 - 2018 National Fire Incident Reporting System (NFIRS) incidents
- Incident types reported to NFIRS in Marathon, FL
- 7,23869.0%Rescue & EMS
- 8458.1%Fire
- 7667.3%Service Call
- 6165.9%Good Intent Call
- 5124.9%False Alarm
- 4494.3%Hazardous Condition
- 580.6%Special Incident
- Fire incident types reported to NFIRS in Marathon, FL
- 35742.2%Outside Fires
- 21925.9%Structure Fires
- 14116.7%Mobile Property/Vehicle Fires
- 12815.1%Other
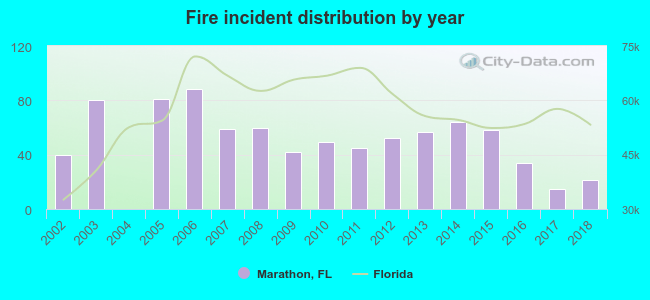 According to the data from the years 2002 - 2018 the average number of fire incidents per year is 50. The highest number of reported fire incidents - 88 took place in 2006, and the least - 0 in 2004. The data has a dropping trend.
The average number of yearly fire incidents per 10k residents in Marathon, FL compared to nearest cities:
(Note: Based on data for the last 3 years, including only cities with population 5,000 and above)
| Marathon: | 26.8 |
| Islamorada: | 61.2 |
| Key Largo: | 39.9 |
| Key West: | 24.8 |
| Florida City: | 0.8 |
| Homestead: | 17.9 |
| Cutler Bay: | 13.9 |
| Palmetto Bay: | 9.5 |
| Pinecrest: | 12.6 |
 The median response time based on all reported fire incidents is 5 minutes. This is lower than the Florida median value.
The median response time in Marathon, FL compared to nearest cities:
(Note: Based on data for all years, including only cities with at least 500 fire incidents)
| Marathon: | 5 minutes |
| Islamorada: | 4 minutes |
| Key Largo: | 5 minutes |
| Key West: | 3 minutes |
| Homestead: | 6 minutes |
| Cutler Bay: | 6 minutes |
| Coral Gables: | 5 minutes |
| Doral: | 6 minutes |
| Key Biscayne: | 4 minutes |
 Based on the data from the years 2002 - 2018 the average number of fire-related casualties per year is 0. The highest number of reported injuries - 4 took place in 2013, and the lowest - 0 in 2002. The data has a constant trend.
The average number of injuries per 1,000 fires is 8. This indicator was the highest - 70 in 2013, and the lowest 0 in 2002. The trend for casualties per 1,000 fire incidents is constant. Compared to the Florida value the number of casualties per 1,000 incidents is lower.
Based on the data from the years 2002 - 2018 the average number of fire-related casualties per year is 0. The highest number of reported injuries - 4 took place in 2013, and the lowest - 0 in 2002. The data has a constant trend.
The average number of injuries per 1,000 fires is 8. This indicator was the highest - 70 in 2013, and the lowest 0 in 2002. The trend for casualties per 1,000 fire incidents is constant. Compared to the Florida value the number of casualties per 1,000 incidents is lower.Casualties per 1,000 incidents in Marathon, FL compared to nearest cities:
(Note: Based on data for all years, including only cities with at least 500 fire incidents)
| Marathon: | 8.3 |
| Islamorada: | 8.2 |
| Key Largo: | 7.6 |
| Key West: | 4.8 |
| Homestead: | 0.0 |
| Cutler Bay: | 0.0 |
| Coral Gables: | 3.2 |
| Doral: | 0.0 |
| Key Biscayne: | 1.5 |
 36.8% incidents where reported in the morning and 63.2% in the evening. The most fires (17.8%) took place on Saturday, and the least (12.1%) on Tuesday.
 Based on the 845 fire incident reports from years 2002 - 2018 most fires (12.5%) took place during April, and the least (6.3%) in December.
 Out of all 10,489 cases reported during the years 2002 - 2018, the most belonged to the categories: Rescue & EMS (69.0%), Fire (8.1%), and Service Call (7.3%).
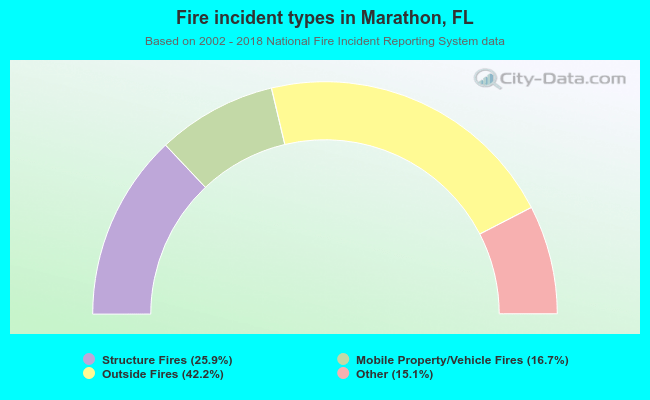 When looking into fire subcategories, the most reports belonged to: Outside Fires (42.2%), and Structure Fires (25.9%).