Martin: Fire Incidents, Tennessee (TN)
Where are fire incidents reported in Martin, TN
Something went wrong! Please refresh the page.
| Fire incidents reported | |
|---|---|
| Sreet name | Count |
| LINDELL ST | 70 |
| UNIVERSITY ST | 68 |
| HIGHWAY 45 | 54 |
| HANNINGS LN | 52 |
| HIGHWAY 22 | 48 |
| MAIN ST | 42 |
| MT PELIA RD | 40 |
| PEACH ST | 36 |
| ELM ST | 26 |
| HIGHWAY 431 | 26 |
| RALSTON RD | 26 |
| HWY 22 | 24 |
| HYNDSVER RD | 22 |
| MT. PELIA RD | 22 |
| PAIR RD | 22 |
| HARRISON RD | 20 |
| MCCOMB ST | 20 |
| HAWKS RD | 18 |
| BIBLE UNION RD | 16 |
| FULTON ST | 16 |
| OLIVE ST | 16 |
| TRAVIS RD | 16 |
| JACKSON RD | 14 |
| KING RD | 14 |
| OLD SALEM RD | 14 |
| ELLIS ST | 12 |
| HAYGOOD RD | 12 |
| HIGHLAND AVE | 12 |
| INDUSTRIAL PARK DR | 12 |
| LACKEY RD | 12 |
| Other | 518 |
2002 - 2018 National Fire Incident Reporting System (NFIRS) incidents
- Incident types reported to NFIRS in Martin, TN
- 4,75253.1%Rescue & EMS
- 1,32014.8%Fire
- 8209.2%False Alarm
- 7968.9%Hazardous Condition
- 7948.9%Service Call
- 4274.8%Good Intent Call
- 150.2%Special Incident
- 110.1%Overpressure Rupture
- 110.1%Severe Weather
- Fire incident types reported to NFIRS in Martin, TN
- 54541.3%Outside Fires
- 46935.5%Structure Fires
- 19915.1%Mobile Property/Vehicle Fires
- 1078.1%Other
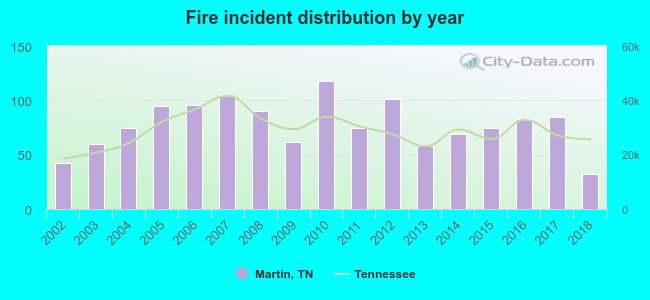 Based on the data from the years 2002 - 2018 the average number of fire incidents per year is 78. The highest number of reported fires - 118 took place in 2010, and the least - 32 in 2018. The data has a declining trend.
 The median response time based on all reported fire incidents is 5 minutes. This is lower than the state median value.
The median response time in Martin, TN compared to nearest cities:
(Note: Based on data for all years, including only cities with at least 500 fire incidents)
| Martin: | 5 minutes |
| Dresden: | 5 minutes |
| Union City: | 5 minutes |
| McKenzie: | 6 minutes |
| Trenton: | 6 minutes |
| Newbern: | 8 minutes |
| Mayfield: | 5 minutes |
| Milan: | 6 minutes |
| Paris: | 5 minutes |
 Based on the reports from the years 2002 - 2018 the average number of fire-related yearly deaths is 1. The highest number of reported deaths - 2 took place in 2006, and the lowest - 0 in 2002. The data has a growing trend.
 Based on the data from the years 2002 - 2018 the average number of fire-related casualties per year is 0. The highest number of casualties - 2 took place in 2015, and the lowest - 0 in 2002. The data has a constant trend.
The average number of casualties per 1,000 fires is 3. This indicator was the highest - 27 in 2015, and the lowest 0 in 2002. The trend for injuries per 1,000 fire incidents is increasing. Compared to the state value the number of casualties per 1,000 incidents is much lower.
Based on the data from the years 2002 - 2018 the average number of fire-related casualties per year is 0. The highest number of casualties - 2 took place in 2015, and the lowest - 0 in 2002. The data has a constant trend.
The average number of casualties per 1,000 fires is 3. This indicator was the highest - 27 in 2015, and the lowest 0 in 2002. The trend for injuries per 1,000 fire incidents is increasing. Compared to the state value the number of casualties per 1,000 incidents is much lower.
 30.0% incidents where reported in the morning and 70.0% in the evening. The most fires (16.0%) took place on Thursday, and the least (11.6%) on Monday.
 Based on the 1,320 fire incidents from years 2002 - 2018 most fires (10.8%) took place during March, and the least (5.5%) in May.
 Out of all 8,946 cases reported during the years 2002 - 2018, the most belonged to the categories: Rescue & EMS (53.1%), Fire (14.8%), and False Alarm (9.2%).
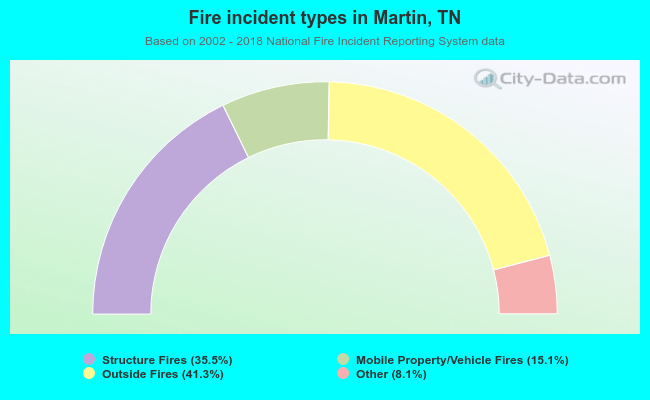 When looking into fire subcategories, the most incidents belonged to: Outside Fires (41.3%), and Structure Fires (35.5%).