Union City: Fire Incidents, Tennessee (TN)
Where are fire incidents reported in Union City, TN
Something went wrong! Please refresh the page.
| Fire incidents reported | |
|---|---|
| Sreet name | Count |
| REELFOOT AVE | 360 |
| FIRST ST | 184 |
| MAIN ST | 126 |
| NASH ST | 126 |
| HWY 22 | 98 |
| FIFTH ST | 76 |
| SECOND ST | 72 |
| CLOVER ST | 66 |
| CHURCH ST | 64 |
| URY ST | 56 |
| COLLEGE ST | 54 |
| MORGAN ST | 54 |
| HWY 51 | 52 |
| MARTIN LUTHER KING DR | 50 |
| BREVARD RD | 48 |
| DIVISION ST | 48 |
| HOME ST | 48 |
| SECTION LINE RD | 48 |
| SUNSWEPT DR | 44 |
| VINE ST | 44 |
| EVERETT BLVD | 38 |
| BEECH CHAPEL RD | 36 |
| KEN TENN HWY | 36 |
| THIRD ST | 34 |
| COUNTY HOME RD | 32 |
| MILES AVE | 32 |
| OLD TROY RD | 32 |
| HIGH ST | 30 |
| FLORIDA AVE | 28 |
| GLENDALE ST | 28 |
| Other | 54 |
2002 - 2018 National Fire Incident Reporting System (NFIRS) incidents
- Incident types reported to NFIRS in Union City, TN
- 6,35058.3%Rescue & EMS
- 2,09819.3%Fire
- 8587.9%False Alarm
- 6195.7%Hazardous Condition
- 4704.3%Service Call
- 4514.1%Good Intent Call
- 160.1%Special Incident
- 140.1%Severe Weather
- 130.1%Overpressure Rupture
- Fire incident types reported to NFIRS in Union City, TN
- 1,01748.5%Structure Fires
- 66131.5%Outside Fires
- 32115.3%Mobile Property/Vehicle Fires
- 994.7%Other
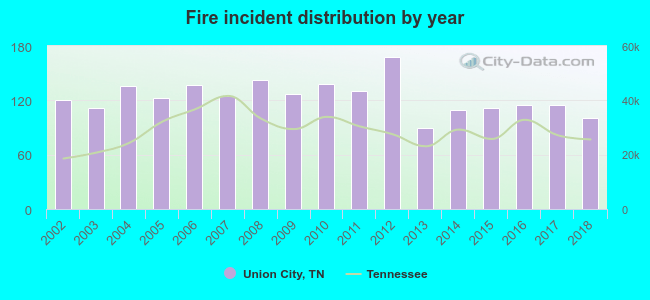 Based on the data from the years 2002 - 2018 the average number of fires per year is 123. The highest number of fire incidents - 168 took place in 2012, and the least - 90 in 2013. The data has a dropping trend.
 The median response time based on all reported fire incidents is 5 minutes. This is lower than the state median value.
The median response time in Union City, TN compared to nearest cities:
(Note: Based on data for all years, including only cities with at least 500 fire incidents)
| Union City: | 5 minutes |
| Martin: | 5 minutes |
| Dresden: | 5 minutes |
| Newbern: | 8 minutes |
| Mayfield: | 5 minutes |
| Trenton: | 6 minutes |
| Dyersburg: | 5 minutes |
| McKenzie: | 6 minutes |
| Portageville: | 9 minutes |
 According to the reports from the years 2002 - 2018 the average number of fire-related fatalities per year is 1. The highest number of deaths - 3 took place in 2013, and the lowest - 0 in 2002. The data has a constant trend.
 Based on the data from the years 2002 - 2018 the average number of fire-related casualties per year is 3. The highest number of casualties - 9 took place in 2007, and the lowest - 1 in 2002. The data has a constant trend.
The average number of injuries per 1,000 fires is 22. This indicator was the highest - 72 in 2007, and the lowest 7 in 2008. The trend for casualties per 1,000 incidents is growing. Compared to the Tennessee value the number of injuries per 1,000 fire incidents is much higher.
Based on the data from the years 2002 - 2018 the average number of fire-related casualties per year is 3. The highest number of casualties - 9 took place in 2007, and the lowest - 1 in 2002. The data has a constant trend.
The average number of injuries per 1,000 fires is 22. This indicator was the highest - 72 in 2007, and the lowest 7 in 2008. The trend for casualties per 1,000 incidents is growing. Compared to the Tennessee value the number of injuries per 1,000 fire incidents is much higher.
 32.9% incidents where reported in the morning and 67.1% in the evening. The most fires (15.7%) took place on Saturday, and the least (12.4%) on Tuesday.
 According to the 2,098 fire incident reports from years 2002 - 2018 most fires (9.7%) took place during January, and the least (7.1%) in May.
 Out of all 10,889 cases reported during the years 2002 - 2018, the most belonged to the categories: Rescue & EMS (58.3%), Fire (19.3%), and False Alarm (7.9%).
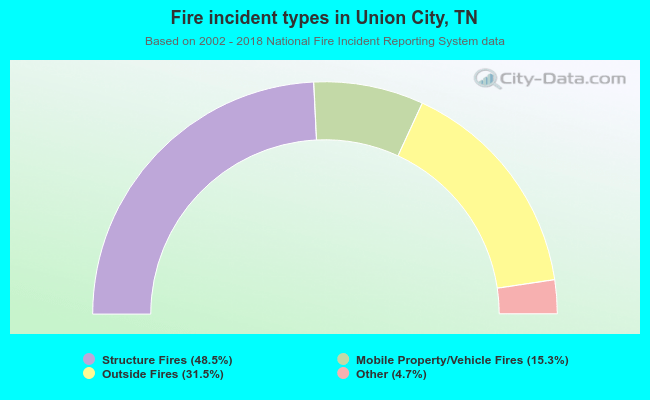 When looking into fire subcategories, the most incidents belonged to: Structure Fires (48.5%), and Outside Fires (31.5%).