Natick: Fire Incidents, Massachusetts (MA)
Where are fire incidents reported in Natick, MA
Something went wrong! Please refresh the page.
| Fire incidents reported | |
|---|---|
| Sreet name | Count |
| WORCESTER ST | 480 |
| SPEEN ST | 146 |
| WEST CENTRAL ST | 138 |
| NORTH MAIN ST | 96 |
| MASS TURNPIKE | 58 |
| EAST CENTRAL ST | 50 |
| POND ST | 48 |
| UNION ST | 44 |
| MILL ST | 38 |
| WEST ST | 38 |
| COTTAGE ST | 36 |
| ELIOT ST | 36 |
| OAK ST | 36 |
| SOUTH MAIN ST | 36 |
| VILLAGE ROCK LN | 30 |
| WASHINGTON AVE | 30 |
| HIGHLAND ST | 28 |
| VILLAGE HILL LN | 28 |
| VILLAGE WAY | 28 |
| WALNUT ST | 24 |
| ROCKLAND ST | 22 |
| WEST HILL PARK | 22 |
| WINTER ST | 22 |
| FAIRVIEW AVE | 20 |
| WALDEN DR | 20 |
| BACON ST | 18 |
| CEDAR AVE | 18 |
| LINCOLN SOUTH ST | 18 |
| MAIN ST | 18 |
| UNDERPRICE WAY | 18 |
2002 - 2018 National Fire Incident Reporting System (NFIRS) incidents
- Incident types reported to NFIRS in Natick, MA
- 12,18748.0%Rescue & EMS
- 5,10320.1%Hazardous Condition
- 3,02011.9%False Alarm
- 2,2548.9%Service Call
- 1,5936.3%Fire
- 1,1474.5%Good Intent Call
- 450.2%Special Incident
- Fire incident types reported to NFIRS in Natick, MA
- 77548.7%Structure Fires
- 50631.8%Outside Fires
- 19112.0%Mobile Property/Vehicle Fires
- 1217.6%Other
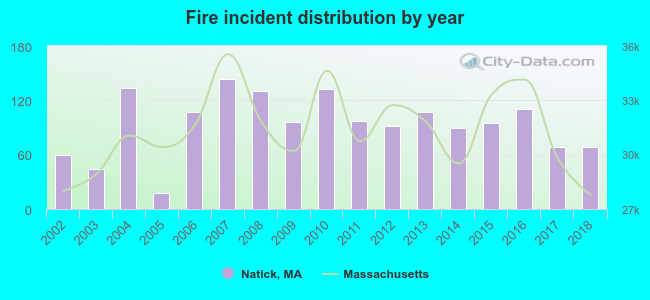 According to the data from the years 2002 - 2018 the average number of fires per year is 94. The highest number of reported fire incidents - 144 took place in 2007, and the least - 18 in 2005. The data has an increasing trend.
The average number of yearly fire incidents per 10k residents in Natick, MA compared to nearest cities:
(Note: Based on data for the last 3 years, including only cities with population 5,000 and above)
| Natick: | 25.0 |
| Wellesley: | 18.2 |
| Framingham: | 89.7 |
| Wayland: | 19.2 |
| Weston: | 34.3 |
| Ashland: | 30.1 |
| Needham: | 17.8 |
| Medfield: | 29.8 |
| Sudbury: | 15.3 |
 The median response time based on all reported fire incidents is 5 minutes. This is higher compared to the Massachusetts median value.
The median response time in Natick, MA compared to nearest cities:
(Note: Based on data for all years, including only cities with at least 500 fire incidents)
| Natick: | 5 minutes |
| Wellesley: | 4 minutes |
| Framingham: | 4 minutes |
| Wayland: | 3 minutes |
| Weston: | 4 minutes |
| Needham: | 4 minutes |
| Sudbury: | 4 minutes |
| Newton: | 5 minutes |
| Waltham: | 4 minutes |
 Based on the data from the years 2002 - 2018 the average number of fire-related yearly casualties is 1. The highest number of injuries - 2 took place in 2004, and the lowest - 0 in 2009. The data has a declining trend.
The average number of casualties per 1,000 fires is 12. This indicator was the highest - 56 in 2005, and the lowest 0 in 2009. The trend for injuries per 1,000 fires is decreasing. Compared to the Massachusetts value the number of casualties per 1,000 incidents is lower.
Based on the data from the years 2002 - 2018 the average number of fire-related yearly casualties is 1. The highest number of injuries - 2 took place in 2004, and the lowest - 0 in 2009. The data has a declining trend.
The average number of casualties per 1,000 fires is 12. This indicator was the highest - 56 in 2005, and the lowest 0 in 2009. The trend for injuries per 1,000 fires is decreasing. Compared to the Massachusetts value the number of casualties per 1,000 incidents is lower.
 28.9% incidents where reported in the morning and 71.1% in the evening. The most fires (15.4%) took place on Monday, and the least (12.9%) on Tuesday.
 Based on the 1,593 fires from years 2002 - 2018 most fires (12.9%) took place during May, and the least (6.3%) in August.
 Out of all 25,371 cases reported during the years 2002 - 2018, the most belonged to the categories: Rescue & EMS (48.0%), Hazardous Condition (20.1%), and False Alarm (11.9%).
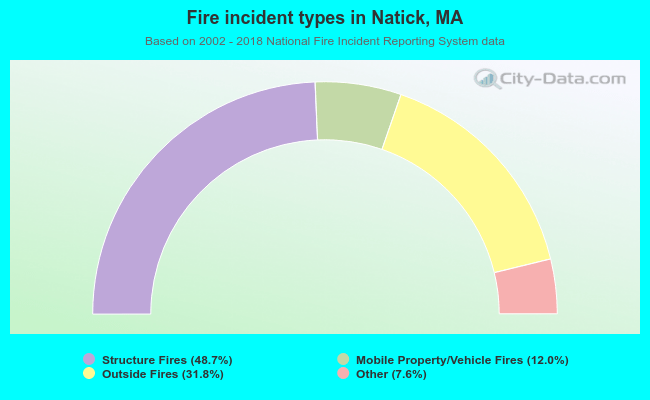 When looking into fire subcategories, the most incidents belonged to: Structure Fires (48.7%), and Outside Fires (31.8%).