Needham: Fire Incidents, Massachusetts (MA)
Where are fire incidents reported in Needham, MA
Something went wrong! Please refresh the page.
| Fire incidents reported | |
|---|---|
| Sreet name | Count |
| HIGHLAND AVE | 210 |
| CENTRAL AVE | 138 |
| CHESTNUT ST | 126 |
| RT128N HWY | 88 |
| GREAT PLAIN AVE | 84 |
| RT128S HWY | 82 |
| GREENDALE AVE | 56 |
| WEBSTER ST | 54 |
| 2ND AVE | 52 |
| CHARLES RIVER ST | 32 |
| 1ST AVE | 26 |
| GOULD ST | 26 |
| KENDRICK ST | 26 |
| SOUTH ST | 26 |
| WEST ST | 26 |
| CHAMBERS ST | 24 |
| DEDHAM AVE | 24 |
| HILLSIDE AVE | 24 |
| BROOKLINE ST | 22 |
| CHAPEL ST | 22 |
| HUNNEWELL ST | 20 |
| CABOT ST | 16 |
| BROADMEADOW RD | 14 |
| JUNCTION ST | 14 |
| CRAWFORD ST | 12 |
| HARRIS AVE | 12 |
| HIGH ROCK WOODS | 12 |
| PICKERING ST | 12 |
| A ST | 10 |
| B ST | 10 |
2002 - 2018 National Fire Incident Reporting System (NFIRS) incidents
- Incident types reported to NFIRS in Needham, MA
- 10,60042.7%Rescue & EMS
- 4,09016.5%Service Call
- 3,91815.8%Hazardous Condition
- 3,69014.8%False Alarm
- 1,3335.4%Good Intent Call
- 1,1114.5%Fire
- 600.2%Special Incident
- 300.1%Overpressure Rupture
- Fire incident types reported to NFIRS in Needham, MA
- 44640.1%Structure Fires
- 44540.1%Outside Fires
- 15714.1%Mobile Property/Vehicle Fires
- 635.7%Other
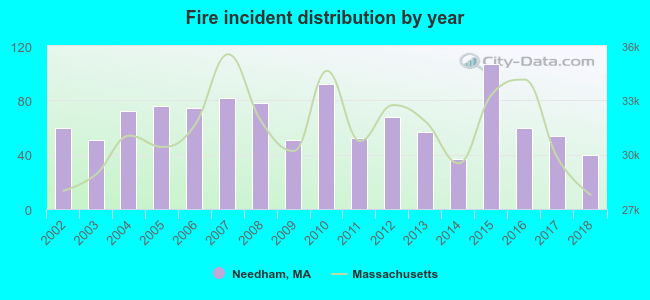 According to the data from the years 2002 - 2018 the average number of fires per year is 65. The highest number of reported fire incidents - 107 took place in 2015, and the least - 37 in 2014. The data has a decreasing trend.
The average number of yearly fire incidents per 10k residents in Needham, MA compared to nearest cities:
(Note: Based on data for the last 3 years, including only cities with population 5,000 and above)
| Needham: | 17.8 |
| Wellesley: | 18.2 |
| Newton: | 29.6 |
| Dedham: | 66.2 |
| Westwood: | 92.1 |
| Weston: | 34.3 |
| Brookline: | 72.0 |
| Natick: | 25.0 |
| Watertown: | 12.2 |
 The median response time based on all reported fire incidents is 4 minutes. This is comparable to the Massachusetts median value.
The median response time in Needham, MA compared to nearest cities:
(Note: Based on data for all years, including only cities with at least 500 fire incidents)
| Needham: | 4 minutes |
| Wellesley: | 4 minutes |
| Newton: | 5 minutes |
| Dedham: | 4 minutes |
| Westwood: | 5 minutes |
| Weston: | 4 minutes |
| Brookline: | 3 minutes |
| Natick: | 5 minutes |
| Watertown: | 4 minutes |
 Based on the data from the years 2002 - 2018 the average number of fire-related yearly casualties is 1. The highest number of injuries - 3 took place in 2002, and the lowest - 0 in 2003. The data has a declining trend.
The average number of casualties per 1,000 fires is 8. This indicator was the highest - 50 in 2002, and the lowest 0 in 2003. The trend for injuries per 1,000 fires is decreasing. Compared to the Massachusetts value the number of casualties per 1,000 incidents is lower.
Based on the data from the years 2002 - 2018 the average number of fire-related yearly casualties is 1. The highest number of injuries - 3 took place in 2002, and the lowest - 0 in 2003. The data has a declining trend.
The average number of casualties per 1,000 fires is 8. This indicator was the highest - 50 in 2002, and the lowest 0 in 2003. The trend for injuries per 1,000 fires is decreasing. Compared to the Massachusetts value the number of casualties per 1,000 incidents is lower.
 29.8% incidents where reported in the morning and 70.2% in the evening. The most fires (16.4%) took place on Friday, and the least (12.0%) on Sunday.
 Based on the 1,111 fires from years 2002 - 2018 most fires (11.7%) took place during May, and the least (5.8%) in March.
 Out of all 24,851 cases reported during the years 2002 - 2018, the most belonged to the categories: Rescue & EMS (42.7%), Service Call (16.5%), and Hazardous Condition (15.8%).
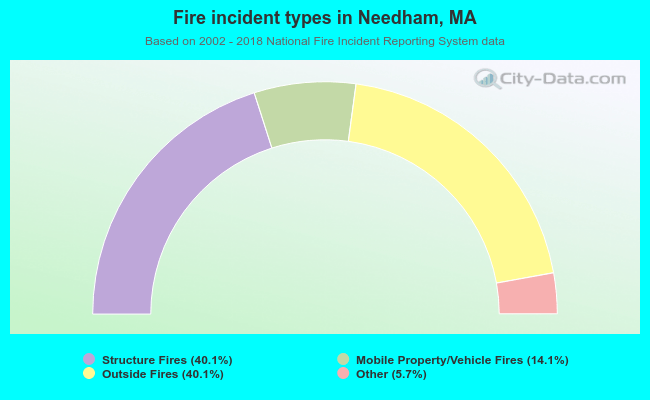 When looking into fire subcategories, the most incidents belonged to: Structure Fires (40.1%), and Outside Fires (40.1%).