Pemberton: Fire Incidents, New Jersey (NJ)
Where are fire incidents reported in Pemberton, NJ
Something went wrong! Please refresh the page.
| Fire incidents reported | |
|---|---|
| Sreet name | Count |
| MAGNOLIA RD | 116 |
| PEMBERTON RD | 64 |
| PEMBERTON BROWNS MILLS RD | 62 |
| KINSLEY RD | 58 |
| HANOVER ST | 56 |
| ARNEYS MOUNT RD | 36 |
| HAMPTON ST | 34 |
| FT DIX RD | 30 |
| NEW LISBON RD | 26 |
| SIMONTOWN RD | 26 |
| STOCKTONS BRIDGE RD | 26 |
| SCRAPETOWN RD | 24 |
| PEMBERTON BROWNS MILLS RO | 22 |
| EGBERT ST | 20 |
| LEMMON | 20 |
| NEW JERSEY RD | 20 |
| POINTVILLE RD | 20 |
| URSINUS CT | 20 |
| BIRMINGHAM RD | 18 |
| ANDERSON RD | 16 |
| FOUR MILE RD | 16 |
| PEMBERTON | 16 |
| VINCENTOWN RD | 16 |
| BRANDYWINE RD | 14 |
| CORNELL | 14 |
| LAKEHURST RD | 14 |
| LOUISIANA | 14 |
| MT MISERY RD | 14 |
| SENECA | 14 |
| SOUTH PEMBERTON ROAD | 14 |
| Other | 158 |
2002 - 2018 National Fire Incident Reporting System (NFIRS) incidents
- Incident types reported to NFIRS in Pemberton, NJ
- 1,72029.8%Hazardous Condition
- 1,03718.0%Rescue & EMS
- 1,01817.7%Fire
- 78313.6%Service Call
- 66711.6%Good Intent Call
- 4517.8%False Alarm
- 671.2%Special Incident
- 200.3%Severe Weather
- Fire incident types reported to NFIRS in Pemberton, NJ
- 65163.9%Structure Fires
- 23723.3%Outside Fires
- 10710.5%Mobile Property/Vehicle Fires
- 232.3%Other
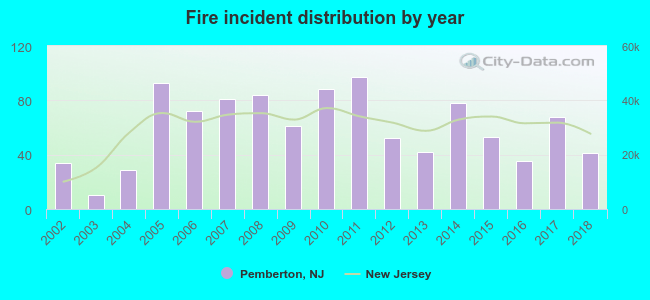 According to the data from the years 2002 - 2018 the average number of fires per year is 60. The highest number of fires - 97 took place in 2011, and the least - 10 in 2003. The data has a growing trend.
 The median response time based on all reported fire incidents is 7 minutes. This is higher compared to the state median value.
The median response time in Pemberton, NJ compared to nearest cities:
(Note: Based on data for all years, including only cities with at least 500 fire incidents)
| Pemberton: | 7 minutes |
| Browns Mills: | 7 minutes |
| Florence: | 8 minutes |
| Bordentown: | 7 minutes |
| Robbinsville: | 5 minutes |
| Trenton: | 4 minutes |
| Berlin: | 5 minutes |
| Palmyra: | 4 minutes |
| Haddonfield: | 6 minutes |
 33.7% incidents where reported in the morning and 66.3% in the evening. The most fires (16.4%) took place on Wednesday, and the least (12.8%) on Monday.
 According to the 1,018 reports from years 2002 - 2018 most fires (11.8%) took place during April, and the least (6.0%) in August.
 Out of all 5,765 cases reported during the years 2002 - 2018, the most belonged to the categories: Hazardous Condition (29.8%), Rescue & EMS (18.0%), and Fire (17.7%).
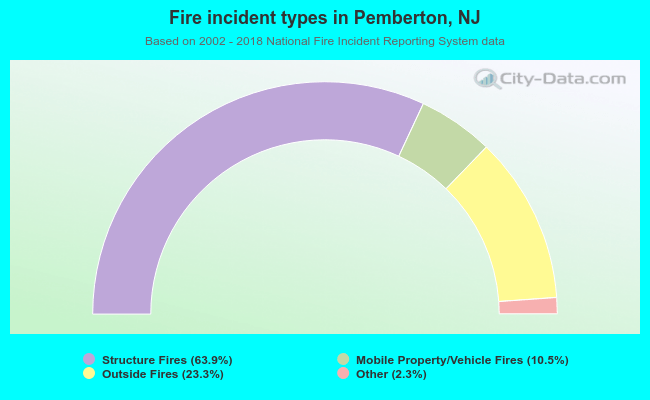 When looking into fire subcategories, the most reports belonged to: Structure Fires (63.9%), and Outside Fires (23.3%).