Toms River: Fire Incidents, New Jersey (NJ)
Where are fire incidents reported in Toms River, NJ
Something went wrong! Please refresh the page.
| Fire incidents reported | |
|---|---|
| Sreet name | Count |
| ROUTE 37 | 192 |
| HOOPER AVE | 122 |
| FISCHER BLVD | 74 |
| ROUTE 9 | 66 |
| 37 RT | 64 |
| BAY AVE | 62 |
| WHITESVILLE RD | 52 |
| WINDSOR AVE | 48 |
| 9 RT | 46 |
| WASHINGTON ST | 34 |
| ROUTE 166 | 32 |
| VAUGHN AVE | 32 |
| ELIZABETH AVE | 30 |
| WATER ST | 30 |
| SUNSET AVE | 28 |
| GARDEN STATE PKY | 26 |
| HIGHLAND PKY | 26 |
| ROUTE 37 HWY | 26 |
| COMMONWEALTH BLVD | 24 |
| ROUTE 37 E | 24 |
| WATERS EDGE DR | 24 |
| ADAMS AVE | 22 |
| LAKEWOOD RD | 22 |
| CHURCH RD | 20 |
| COLLEGE DR | 18 |
| MAPLECREST RD | 18 |
| PRESIDENTIAL BLVD | 18 |
| WALNUT ST | 18 |
| COLONIAL DR | 16 |
| EDGEWOOD DR | 16 |
| Other | 678 |
2003 - 2018 National Fire Incident Reporting System (NFIRS) incidents
- Incident types reported to NFIRS in Toms River, NJ
- 2,15932.0%Hazardous Condition
- 1,90828.3%Fire
- 1,45321.5%False Alarm
- 67810.1%Good Intent Call
- 3375.0%Service Call
- 1622.4%Rescue & EMS
- 360.5%Special Incident
- 80.1%Severe Weather
- Fire incident types reported to NFIRS in Toms River, NJ
- 99552.1%Structure Fires
- 42522.3%Outside Fires
- 27514.4%Mobile Property/Vehicle Fires
- 21311.2%Other
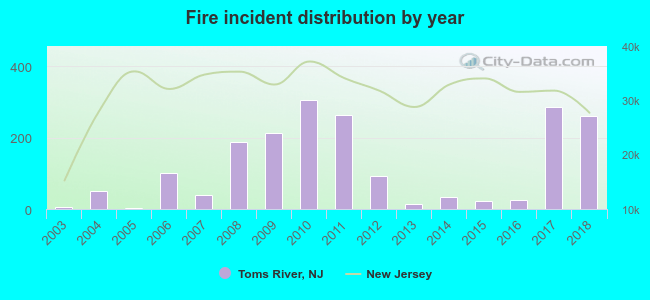 Based on the data from the years 2003 - 2018 the average number of fire incidents per year is 119. The highest number of reported fire incidents - 305 took place in 2010, and the least - 3 in 2005. The data has a rising trend.
The average number of yearly fire incidents per 10k residents in Toms River, NJ compared to nearest cities:
(Note: Based on data for the last 3 years, including only cities with population 5,000 and above)
| Toms River: | 21.6 |
| Beachwood: | 36.7 |
| Lakewood: | 1.7 |
| Point Pleasant: | 5.9 |
| Forked River: | 125.2 |
| Manasquan: | 64.2 |
| Belmar: | 23.9 |
| Asbury Park: | 53.2 |
| Freehold: | 84.1 |
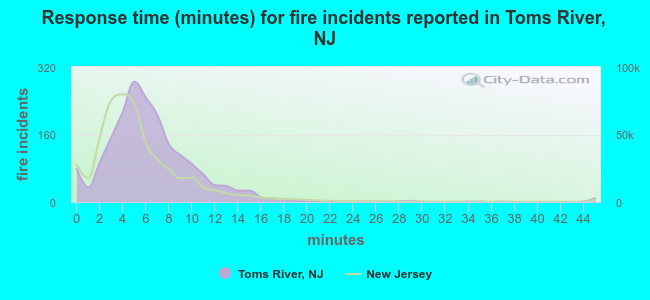 The median response time based on all reported fire incidents is 6 minutes. This is close to the New Jersey median value.
The median response time in Toms River, NJ compared to nearest cities:
(Note: Based on data for all years, including only cities with at least 500 fire incidents)
| Toms River: | 6 minutes |
| Beachwood: | 4 minutes |
| Lakewood: | 4 minutes |
| Forked River: | 5 minutes |
| Manasquan: | 5 minutes |
| Barnegat: | 5 minutes |
| Asbury Park: | 3 minutes |
| Manahawkin: | 4 minutes |
| Freehold: | 5 minutes |
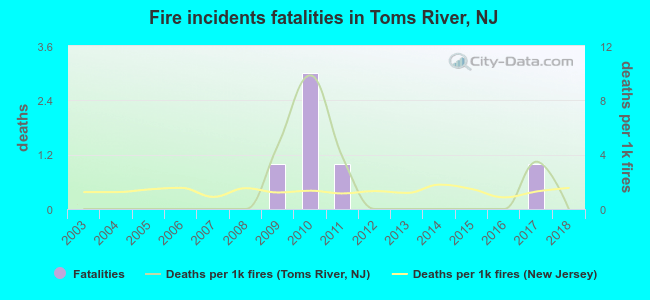 Based on the reports from the years 2003 - 2018 the average number of fire-related yearly deaths is 0. The highest number of deaths - 3 took place in 2010, and the lowest - 0 in 2003. The data has a constant trend.
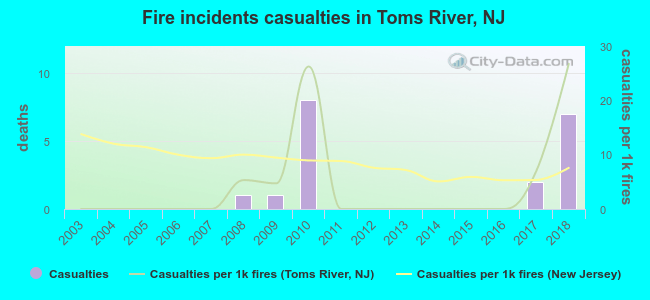 Based on the reports from the years 2003 - 2018 the average number of fire-related casualties per year is 1. The highest number of casualties - 8 took place in 2010, and the lowest - 0 in 2003. The data has a growing trend.
The average number of casualties per 1,000 fires is 4. This indicator was the highest - 27 in 2018, and the lowest 0 in 2003. The trend for injuries per 1,000 fires is rising. Compared to the New Jersey value the number of casualties per 1,000 incidents is similar.
Based on the reports from the years 2003 - 2018 the average number of fire-related casualties per year is 1. The highest number of casualties - 8 took place in 2010, and the lowest - 0 in 2003. The data has a growing trend.
The average number of casualties per 1,000 fires is 4. This indicator was the highest - 27 in 2018, and the lowest 0 in 2003. The trend for injuries per 1,000 fires is rising. Compared to the New Jersey value the number of casualties per 1,000 incidents is similar.Casualties per 1,000 incidents in Toms River, NJ compared to nearest cities:
(Note: Based on data for all years, including only cities with at least 500 fire incidents)
| Toms River: | 10.0 |
| Beachwood: | 10.2 |
| Lakewood: | 44.4 |
| Forked River: | 9.1 |
| Manasquan: | 7.1 |
| Barnegat: | 0.0 |
| Asbury Park: | 11.6 |
| Manahawkin: | 10.8 |
| Freehold: | 3.1 |
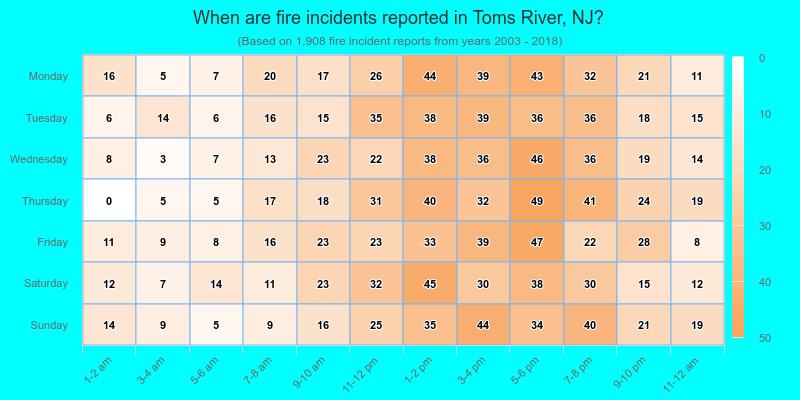
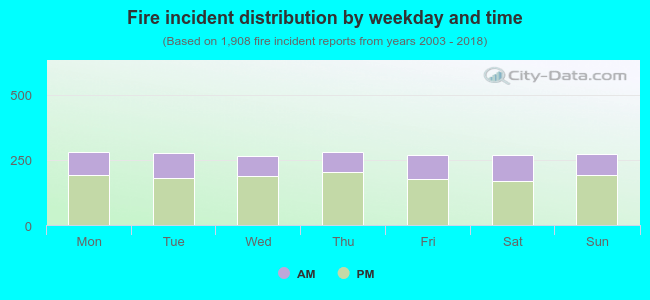 31.6% incidents where reported in the morning and 68.4% in the evening. The most fires (14.7%) took place on Monday, and the least (13.9%) on Wednesday.
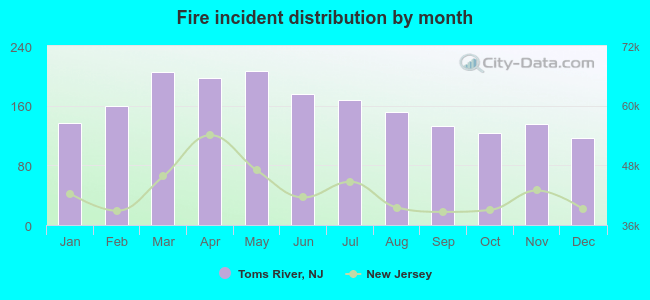 Based on the 1,908 fire incidents from years 2003 - 2018 most fires (10.8%) took place during May, and the least (6.1%) in December.
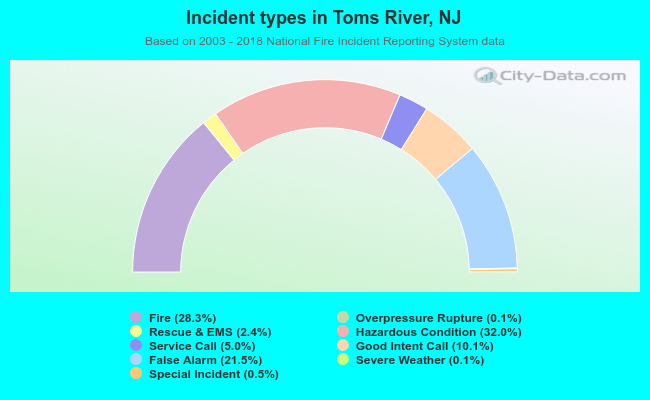 Out of all 6,745 cases reported during the years 2003 - 2018, the most belonged to the categories: Hazardous Condition (32.0%), Fire (28.3%), and False Alarm (21.5%).
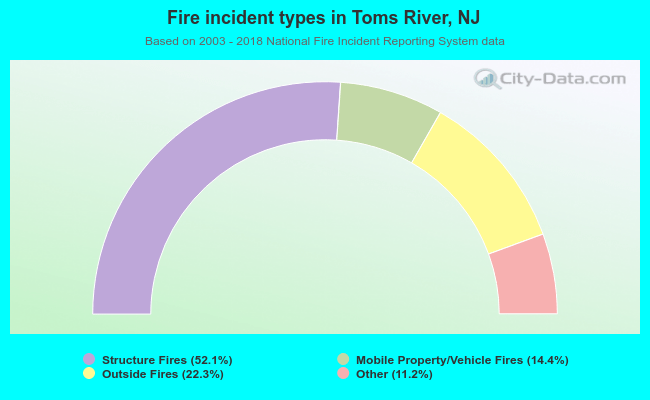 When looking into fire subcategories, the most reports belonged to: Structure Fires (52.1%), and Outside Fires (22.3%).