Forked River: Fire Incidents, New Jersey (NJ)
Where are fire incidents reported in Forked River, NJ
Something went wrong! Please refresh the page.
|
| |||||||||||||||||||||||||||||||||||||||||||||||||||||||||||||||||||||||||||||||||||||||||||||||||||||||||||||
2004 - 2018 National Fire Incident Reporting System (NFIRS) incidents
- Incident types reported to NFIRS in Forked River, NJ
- 1,66143.4%Hazardous Condition
- 99326.0%Fire
- 55714.6%False Alarm
- 2997.8%Service Call
- 1684.4%Good Intent Call
- 1183.1%Rescue & EMS
- 120.3%Severe Weather
- 100.3%Overpressure Rupture
- 50.1%Special Incident
- Fire incident types reported to NFIRS in Forked River, NJ
- 38638.9%Outside Fires
- 38038.3%Structure Fires
- 15715.8%Mobile Property/Vehicle Fires
- 707.0%Other
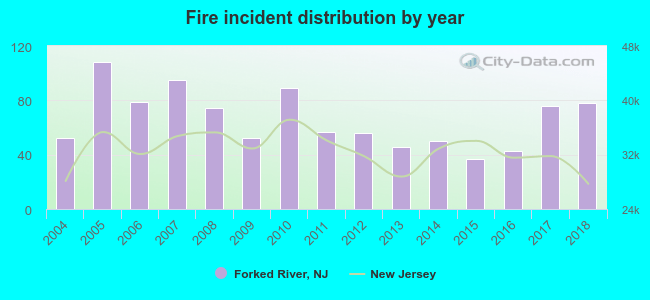 Based on the data from the years 2004 - 2018 the average number of fires per year is 66. The highest number of reported fire incidents - 108 took place in 2005, and the least - 37 in 2015. The data has a rising trend.
The average number of yearly fire incidents per 10k residents in Forked River, NJ compared to nearest cities:
(Note: Based on data for the last 3 years, including only cities with population 5,000 and above)
| Forked River: | 125.2 |
| Beachwood: | 36.7 |
| Toms River: | 21.6 |
| Point Pleasant: | 5.9 |
| Lakewood: | 1.7 |
| Mystic Island: | 16.5 |
| Manasquan: | 64.2 |
| Browns Mills: | 65.3 |
| Belmar: | 23.9 |
 The median response time based on all reported fire incidents is 5 minutes. This is about the same as the New Jersey median value.
The median response time in Forked River, NJ compared to nearest cities:
(Note: Based on data for all years, including only cities with at least 500 fire incidents)
| Forked River: | 5 minutes |
| Barnegat: | 5 minutes |
| Beachwood: | 4 minutes |
| Manahawkin: | 4 minutes |
| Toms River: | 6 minutes |
| Lakewood: | 4 minutes |
| Manasquan: | 5 minutes |
| Browns Mills: | 7 minutes |
| Pemberton: | 7 minutes |
 30.7% incidents where reported in the morning and 69.3% in the evening. The most fires (17.3%) took place on Sunday, and the least (12.4%) on Monday.
 According to the 993 reports from years 2004 - 2018 most fires (11.1%) took place during November, and the least (4.9%) in January.
 Out of all 3,823 cases reported during the years 2004 - 2018, the most belonged to the categories: Hazardous Condition (43.4%), Fire (26.0%), and False Alarm (14.6%).
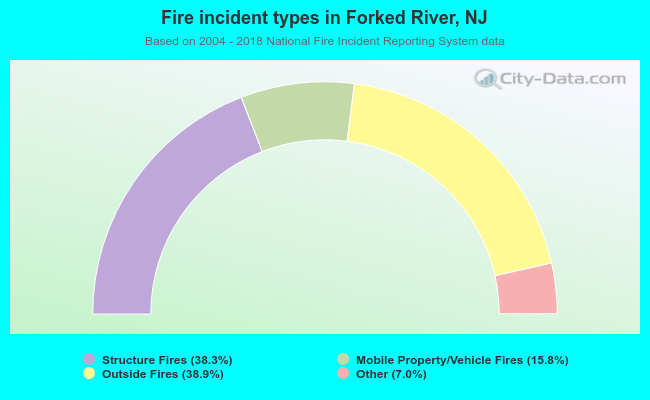 When looking into fire subcategories, the most reports belonged to: Outside Fires (38.9%), and Structure Fires (38.3%).