Williston: Fire Incidents, Vermont (VT)
Where are fire incidents reported in Williston, VT
Something went wrong! Please refresh the page.
|
| |||||||||||||||||||||||||||||||||||||||||||||||||||||||||||||||||||||||||||||||||||||||||||||||||||||||||||||
| Other | 8 | |||||||||||||||||||||||||||||||||||||||||||||||||||||||||||||||||||||||||||||||||||||||||||||||||||||||||||||
2002 - 2018 National Fire Incident Reporting System (NFIRS) incidents
- Incident types reported to NFIRS in Williston, VT
- 3,85337.8%Rescue & EMS
- 2,11120.7%Good Intent Call
- 1,48414.5%Hazardous Condition
- 1,18611.6%False Alarm
- 1,04510.2%Service Call
- 5105.0%Fire
- Fire incident types reported to NFIRS in Williston, VT
- 24548.0%Structure Fires
- 13025.5%Outside Fires
- 10721.0%Mobile Property/Vehicle Fires
- 285.5%Other
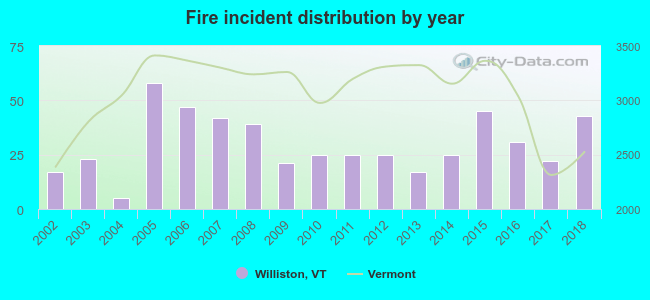 Based on the data from the years 2002 - 2018 the average number of fire incidents per year is 30. The highest number of fires - 58 took place in 2005, and the least - 5 in 2004. The data has a rising trend.
The average number of yearly fire incidents per 10k residents in Williston, VT compared to nearest cities:
(Note: Based on data for the last 3 years, including only cities with population 5,000 and above)
| Williston: | 36.8 |
| Essex Junction: | 59.0 |
| Essex: | 1.4 |
| South Burlington: | 33.6 |
| Winooski: | 101.5 |
| Burlington: | 29.8 |
| Shelburne: | 38.3 |
| Colchester: | 28.9 |
| Montpelier: | 37.8 |
 The median response time based on all reported fire incidents is 5 minutes. This is lower than the Vermont median value.
The median response time in Williston, VT compared to nearest cities:
(Note: Based on data for all years, including only cities with at least 500 fire incidents)
| Williston: | 5 minutes |
| Essex Junction: | 7 minutes |
| South Burlington: | 4 minutes |
| Winooski: | 5 minutes |
| Burlington: | 3 minutes |
| Colchester: | 7 minutes |
| Milton: | 9 minutes |
| Plattsburgh: | 6 minutes |
| Montpelier: | 4 minutes |
 28.6% incidents where reported in the morning and 71.4% in the evening. The most fires (16.7%) took place on Thursday, and the least (12.7%) on Sunday.
 Based on the 510 incident reports from years 2002 - 2018 most fires (12.2%) took place during April, and the least (5.7%) in November.
 Out of all 10,206 cases reported during the years 2002 - 2018, the most belonged to the categories: Rescue & EMS (37.8%), Good Intent Call (20.7%), and Hazardous Condition (14.5%).
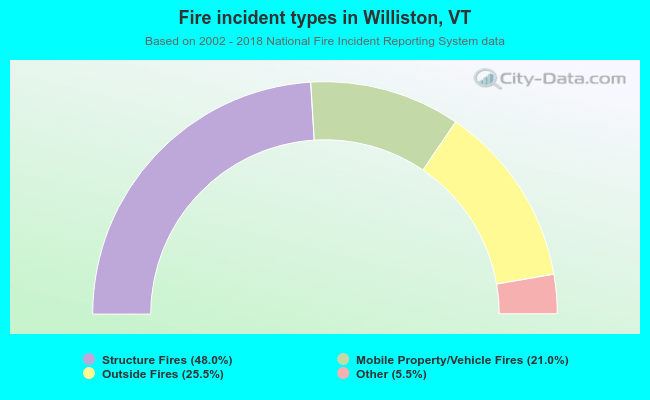 When looking into fire subcategories, the most incidents belonged to: Structure Fires (48.0%), and Outside Fires (25.5%).