Colchester: Fire Incidents, Vermont (VT)
Where are fire incidents reported in Colchester, VT
Something went wrong! Please refresh the page.
| Fire incidents reported | |
|---|---|
| Sreet name | Count |
| MAIN ST | 62 |
| ROOSEVELT HWY | 50 |
| LAKESHORE DR | 46 |
| HEINEBURG DR | 36 |
| MALLETTS BAY AVE | 32 |
| PRIM RD | 32 |
| PORTERS POINT RD | 30 |
| MACRAE RD | 28 |
| BLAKELY RD | 26 |
| COLLEGE PKY | 24 |
| EAST RD | 22 |
| HERCULES DR | 22 |
| SULLIVAN LN | 20 |
| WILLIAMS RD | 20 |
| BAY RD | 18 |
| ETHAN ALLEN AVE | 18 |
| JASPER MINE RD | 18 |
| CASHMAN RD | 16 |
| CHURCH RD | 16 |
| CREEK FARM RD | 16 |
| I-89 | 16 |
| ROUTE 7 | 16 |
| SOUTH PARK DR | 16 |
| MIDDLE RD | 14 |
| BONANZA PARK | 12 |
| HOLY CROSS RD | 12 |
| PONTIGNY PL | 12 |
| SEVERANCE RD | 12 |
| BARNES AVE | 10 |
| BLUEBIRD DR | 10 |
| Other | 252 |
2002 - 2018 National Fire Incident Reporting System (NFIRS) incidents
- Incident types reported to NFIRS in Colchester, VT
- 2,33329.0%Hazardous Condition
- 1,51718.9%Rescue & EMS
- 1,34616.7%False Alarm
- 1,06113.2%Good Intent Call
- 93411.6%Fire
- 82210.2%Service Call
- 120.1%Overpressure Rupture
- Fire incident types reported to NFIRS in Colchester, VT
- 41444.3%Structure Fires
- 29131.2%Outside Fires
- 14115.1%Mobile Property/Vehicle Fires
- 889.4%Other
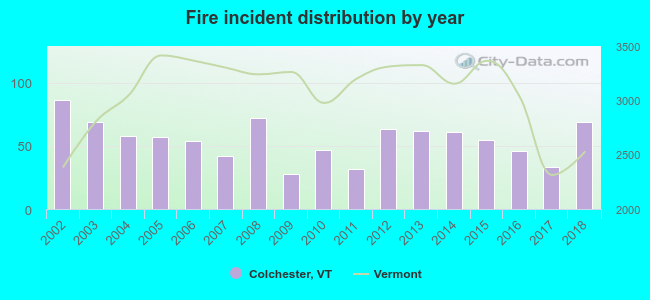 According to the data from the years 2002 - 2018 the average number of fire incidents per year is 55. The highest number of fire incidents - 86 took place in 2002, and the least - 28 in 2009. The data has a dropping trend.
The average number of yearly fire incidents per 10k residents in Colchester, VT compared to nearest cities:
(Note: Based on data for the last 3 years, including only cities with population 5,000 and above)
| Colchester: | 28.9 |
| Winooski: | 101.5 |
| Burlington: | 29.8 |
| Essex Junction: | 59.0 |
| Essex: | 1.4 |
| South Burlington: | 33.6 |
| Williston: | 36.8 |
| Shelburne: | 38.3 |
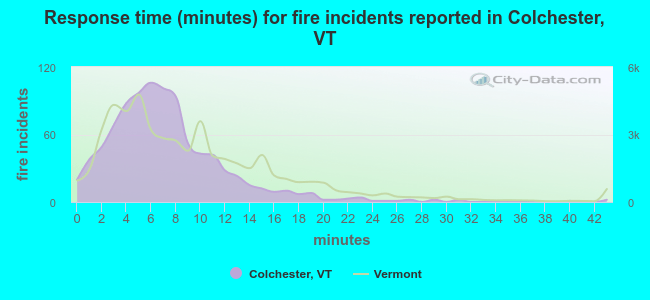 The median response time based on all reported fire incidents is 7 minutes. This is lower than the state median value.
The median response time in Colchester, VT compared to nearest cities:
(Note: Based on data for all years, including only cities with at least 500 fire incidents)
| Colchester: | 7 minutes |
| Winooski: | 5 minutes |
| Burlington: | 3 minutes |
| Essex Junction: | 7 minutes |
| South Burlington: | 4 minutes |
| Milton: | 9 minutes |
| Williston: | 5 minutes |
| Plattsburgh: | 6 minutes |
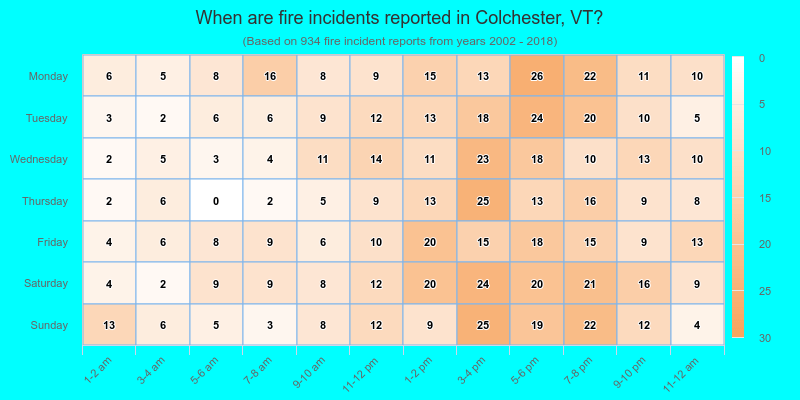
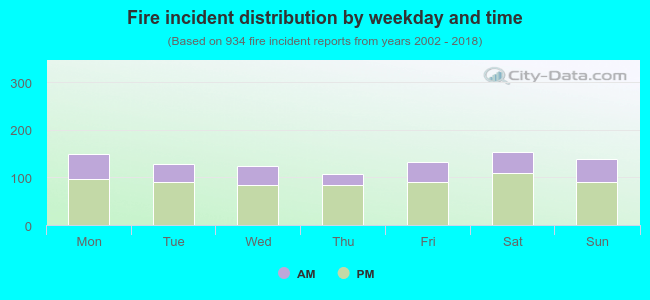 30.7% incidents where reported in the morning and 69.3% in the evening. The most fires (16.5%) took place on Saturday, and the least (11.6%) on Thursday.
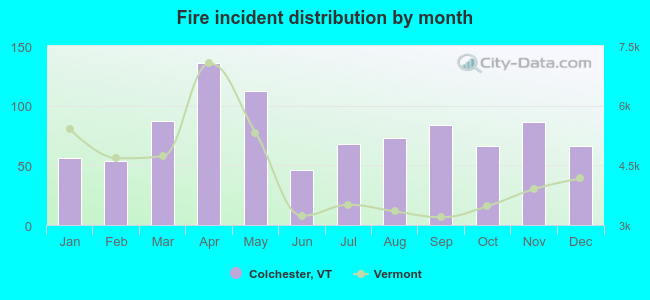 According to the 934 fires from years 2002 - 2018 most fires (14.6%) took place during April, and the least (4.9%) in June.
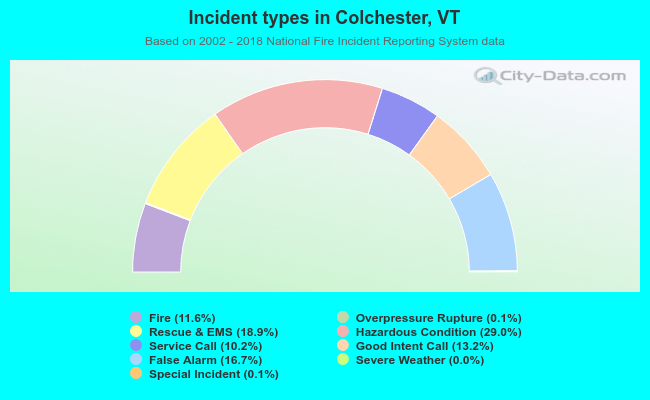 Out of all 8,037 cases reported during the years 2002 - 2018, the most belonged to the categories: Hazardous Condition (29.0%), Rescue & EMS (18.9%), and False Alarm (16.7%).
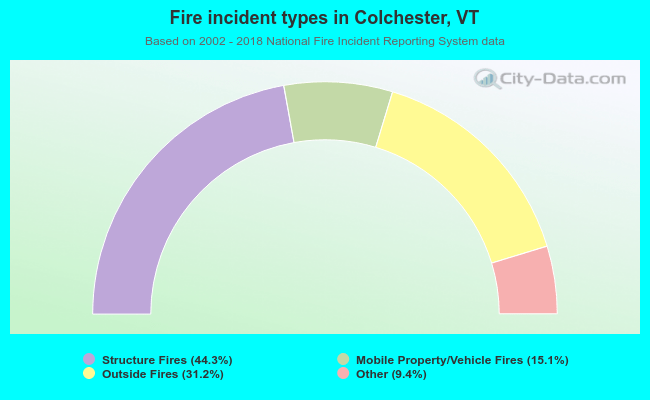 When looking into fire subcategories, the most reports belonged to: Structure Fires (44.3%), and Outside Fires (31.2%).