Winooski: Fire Incidents, Vermont (VT)
Where are fire incidents reported in Winooski, VT
Something went wrong! Please refresh the page.
|
| |||||||||||||||||||||||||||||||||||||||||||||||||||||||||||||||||||||||||||||||||||||||||||||||||||||||||||||
2002 - 2018 National Fire Incident Reporting System (NFIRS) incidents
- Incident types reported to NFIRS in Winooski, VT
- 1,00028.3%Fire
- 83123.5%Hazardous Condition
- 79422.5%False Alarm
- 35610.1%Service Call
- 3269.2%Good Intent Call
- 2216.3%Rescue & EMS
- Fire incident types reported to NFIRS in Winooski, VT
- 81281.2%Structure Fires
- 11711.7%Outside Fires
- 404.0%Other
- 313.1%Mobile Property/Vehicle Fires
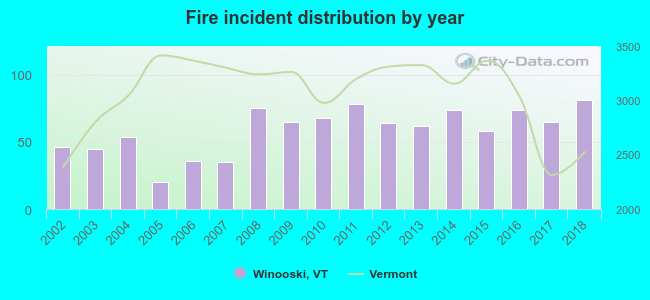 Based on the data from the years 2002 - 2018 the average number of fire incidents per year is 59. The highest number of fires - 81 took place in 2018, and the least - 20 in 2005. The data has a rising trend.
The average number of yearly fire incidents per 10k residents in Winooski, VT compared to nearest cities:
(Note: Based on data for the last 3 years, including only cities with population 5,000 and above)
| Winooski: | 101.5 |
| Burlington: | 29.8 |
| South Burlington: | 33.6 |
| Colchester: | 28.9 |
| Essex Junction: | 59.0 |
| Essex: | 1.4 |
| Williston: | 36.8 |
| Shelburne: | 38.3 |
 The median response time based on all reported fire incidents is 5 minutes. This is lower than the Vermont median value.
The median response time in Winooski, VT compared to nearest cities:
(Note: Based on data for all years, including only cities with at least 500 fire incidents)
| Winooski: | 5 minutes |
| Burlington: | 3 minutes |
| South Burlington: | 4 minutes |
| Colchester: | 7 minutes |
| Essex Junction: | 7 minutes |
| Williston: | 5 minutes |
| Milton: | 9 minutes |
| Plattsburgh: | 6 minutes |
 30.7% incidents where reported in the morning and 69.3% in the evening. The most fires (15.8%) took place on Friday, and the least (11.9%) on Saturday.
 Based on the 1,000 incident reports from years 2002 - 2018 most fires (10.6%) took place during May, and the least (6.4%) in February.
 Out of all 3,530 cases reported during the years 2002 - 2018, the most belonged to the categories: Fire (28.3%), Hazardous Condition (23.5%), and False Alarm (22.5%).
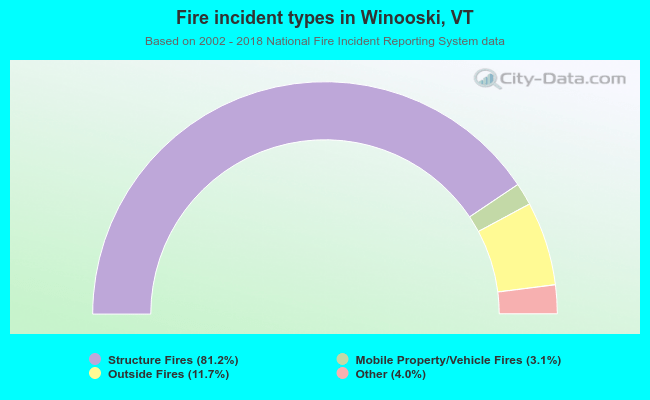 When looking into fire subcategories, the most incidents belonged to: Structure Fires (81.2%), and Outside Fires (11.7%).