Please register to participate in our discussions with 2 million other members - it's free and quick! Some forums can only be seen by registered members. After you create your account, you'll be able to customize options and access all our 15,000 new posts/day with fewer ads.
It is probably because the Dallas/Fort Worth Metroplex is a multifaceted area whereas the Houston area is singular in both function and design. Both Downtown Dallas and Downtown Fort Worth are large employment centers with tens of millions in Class A, Class B, and Class C office space and massive corporate offices or headquarters, and then there are secondary business districts and edge cities in both cities (city propers) beyond that to serve as secondary nodes. Both downtowns are the commercial hubs of their respective parts of the Metroplex. In addition to that, the Metroplex suburbs are even further decentralized, with several cities with large office parks and business districts (I.E. Legacy West in Plano or Las Calinas in Irving).
The Dallas/Fort Worth Metroplex CSA has a population of 7.5 million; the Dallas/Fort Worth Metroplex MSA has a population of 7.1 million. Dallas by itself will only feel as large as its side of the Metroplex (5.1 million people in the CSA; 4.8 million in the MSA), while Fort Worth will only feel like the size of its side of the Metroplex (2.4 million people in the CSA; 2.3 million in the MSA). So yes, in essence when you're in core Dallas it will give off the feel of a city with a smaller immediate pull and continuity than Houston, because its side of the Metroplex is in fact smaller than Houston's.
Over the decades though the Metroplex's two parts grew together and today are a seamlessly transitioning area from one part to the other. So when taken in account, the metropolitan area as a whole, it is larger than Houston and will feel larger than Houston. The Dallas/Fort Worth Metroplex as one unified area from one end to the other will feel larger than Greater Houston by a little bit. Just that at a more micro level when you look at city propers or the Houston MSA versus the Dallas-Plano-Irving Metropolitan Division, Houston will be and feel significantly larger in each case.
The "Metroplex" is a term to describe the type of metropolitan area that Dallas/Fort Worth is. A Metroplex is an area centered around exactly 2 parts, with one part always being either the same equal size or about 2 X the size of the other (such as the case here with Dallas Metropolitan Division: 5.1 million; Fort Worth Metropolitan Division: 2.4 million). Another area (albeit at the CSA level) that can be categorized in this manner is Washington DC-Baltimore, where Washington DC (MSA of 6.1 million) and Baltimore (MSA of 2.8 million) have the same 2:1 relationship (size/population ratio) and at this point spillover seamlessly from one area to the next (albeit much less so than Dallas to Fort Worth).
Chicago is more like what Houston is. Outside of each of those respective city propers, the rest of each of the metropolitan areas only consist of straight suburbia, smaller satellite cities with business districts and edge cities, or little tiny historic coastal towns that depend on the central city across the board for things (chief among those, economically).
Funny because I'm of the opinion that Dallas is more urban than Houston is, especially in the core. Houston has no answer to the Uptown neighborhoods of Dallas.
Great link highlighting the square mileage of all the MSA's and CSA's.
One thing to note: I've noticed many posters in this forum criticizing the boundaries (or size)for the South Florida CSA. This map shows how minuscule it is, compared to the likes of many other CSA's.
CSA's and MSA"s use counties so certain places will always have ridiculously large CSA's regardless. Houston's CSA is a joke because on 100,000 or so extra people live in another 2,000 or so extra miles. I know zero people who live in the county, and Every time I went to these CSA's 100% of people when asked answered this is Brenham etc. No one acted like they were part of Houston, while in Houston most suburban people would answer Houston if someone from out of state visited.
Some Stats
Brenham to Houston(Downtown) is 75 miles.
Brenham to the closest recognized area of Houston metro (Hempstead) is twenty miles.
Brenham to Houston's sprawl (Cypress around Premium Outlets) is 45 miles. If just measuring UA as the metro
Funny because I'm of the opinion that Dallas is more urban than Houston is, especially in the core. Houston has no answer to the Uptown neighborhoods of Dallas.
I don't know the specifics about Nashville but I suspect that a similar pattern of urban housing development is happening there as it is in Raleigh. In Raleigh, there seems to be an endless pipeline of urban housing projects over the last 10 years and specifically since the end of the recession. There are now always several of these projects happening at the same time but in different phases of development. Before new projects are even delivered to the market, new projects are announced while others are either breaking ground or are midway into construction.
I really doubt Raleigh can match the list of urban development Nashville has.
Neither city is urban; that's the easy answer. Although I have been to Nashville and am familiar with it, I am obviously more familiar with Raleigh. I imagine (as I have said in previous posts) that Nashville is doing the same thing that Raleigh is doing with intense focus on its core. Nonetheless, neither city is objectively urban by nature. Both cities have walkable areas but score horrendously on Walk Score with Raleigh coming in at 29 and Nashville even lower at 26. This places the cities 46th and 48th on the list of large cities respectively. Both cities face the same challenge in that their cores are small in comparison to their total land area. That all said, both cities are growing larger now at a time when there is a national renewed focus on walkable and urban development. This will bode well for both cities in the future.
I don't know the specifics about Nashville but I suspect that a similar pattern of urban housing development is happening there as it is in Raleigh. In Raleigh, there seems to be an endless pipeline of urban housing projects over the last 10 years and specifically since the end of the recession. There are now always several of these projects happening at the same time but in different phases of development. Before new projects are even delivered to the market, new projects are announced while others are either breaking ground or are midway into construction.
That walk score thing is so misleading. But since you opened that can of worms, let's look into it more closely.
The walk score for the city of Raleigh is 29, Nashville's is 26. Both are pretty miserable (if you base your life on walk scores). However, according to that web site the most walkable neighborhood in Raleigh is Oakwood which has a walk score of 70. Nashville has three neighborhoods with higher scores than that: Downtown (83), East End (80), and Southside (71). So, according to that web site which is really nothing more than a front for realty ads, if you want a more urban, walkable living experience you'll find more of it in Nashville than in Raleigh.
As far as new projects go, there are 40 projects in Nashville right now worth at least $100 million each, most are residential, and most are in the urban core. And housing development in Nashville is accelerating. So far in 2016, the only metro areas with more housing starts than Nashville (3,969) are, in order, DFW (7,205), Houston (6,942), Atlanta (6,628), NYC (4,954), L.A. (4,582), and Phoenix (4,019). Raleigh has had 1,289 (Durham has had 1,109). Of Nashville's housing starts, 2,248 are in buildings with 5 or more units. By comparison, of Raleigh's housing starts, only 18 are in buildings of multiple units, and the rest (1,271) are all single family homes. The only other metro areas with more housing units under construction than Nashville so far in 2016 in buildings of 5 or more units are NYC (3,348), L.A. (3,289), Atlanta (3,257), DFW (2,893), and Miami-Ft Lauderdale (2,353).
It's so interesting how Houston feels so much larger than DFW.
Ok, so I'm not alone in this. Houston feels larger than Atlanta does too. Houston > Atlanta > Dallas in terms of perception. We all know what it is in reality.
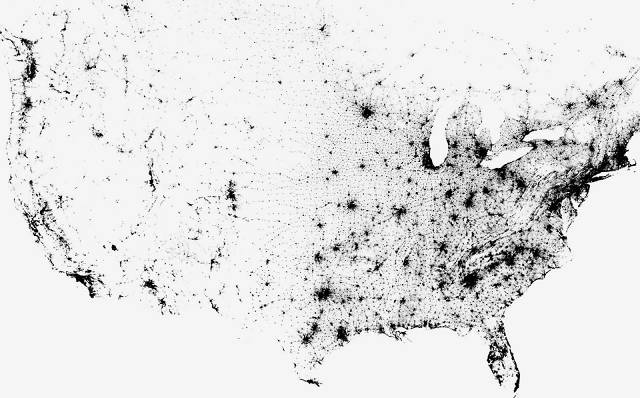
What's insane though, is looking at each of their sprawl on a map. Atlanta is ridiculous in this regard. By this image alone, you would think it is the 2 (or 3rd) largest city in America.
Ok, so I'm not alone in this. Houston feels larger than Atlanta does too. Houston > Atlanta > Dallas in terms of perception. We all know what it is in reality.
What's insane though, is looking at each of their sprawl on a map. Atlanta is ridiculous in this regard. By this image alone, you would think it is the 2 (or 3rd) largest city in America.
Seattle too, look at how huge it looks compared to the more compact, dense, and condensed San Francisco Bay Area.
Chicago, Denver, and Minneapolis/Saint Paul too actually.
"No, trends are just reverting back to what they used to be like 2000 - 2006.
The same places that were booming then will be doing so now. If you need evidence just take a look at Nevada and Las Vegas' comeback. More evidence, take a lot at how Orlando has accelerated every year since the last census was taken and how Florida, like Nevada is making a comeback to what it regularly was. More evidence? Take a look at the comeback in Arizona and Georgia.
People are once again flocking to places that have cheap costs of living and more "benign" climate like they were last decade before the recession. Most of the growth in the Sunbelt FL, NV, AZ, GA are in the suburbs again with city proper decelerating each passing year.
I believe last decade places like New York, Chicago, and Los Angeles had more extreme net (negative) domestic migration than what we have been seeing 2008 - 2013 when people mostly stayed put (due to economic uncertainty).
The country is just reverting back to it's sprawling, high consuming ways and the places that were booming the most before the recession will boom the most from here on out."
Florida, Nevada, Arizona, and the like did continue to accelerate and are now once again the fastest growing states in the nation.
The other states that I mentioned a deceleration for, every single one of them decelerated.
Further verification. My post above with the 1970-2015 statistics for the 14 largest MSAs will verify my opinion from last year. Phoenix just posted its best year in 2015 since 2008. Atlanta has come back to post its best year in 2015 since 2008. All the states that I said would decelerate did, look at their largest MSAs, all of them have slowed down in 2015 as compared to 2014.
The states of NV, AZ, FL, NC, GA, SC (and their major MSAs) will continue accelerating again next year and years into the future as states such as NY, IL, NJ, PA, MA, MI and their largest MSAs continue to decelerate each year into the future as the nation as a whole takes back its pre-Recession form.
Last edited by Trafalgar Law; 04-22-2016 at 05:59 PM..
Please register to post and access all features of our very popular forum. It is free and quick. Over $68,000 in prizes has already been given out to active posters on our forum. Additional giveaways are planned.
Detailed information about all U.S. cities, counties, and zip codes on our site: City-data.com.

 Please register to participate in our discussions with 2 million other members - it's free and quick! Some forums can only be seen by registered members. After you create your account, you'll be able to customize options and access all our 15,000 new posts/day with fewer ads.