Welcome to City-Data.com Forum!
U.S. CitiesCity-Data Forum Index
Go Back   City-Data Forum > General Forums > Weather
 [Register]
Please register to participate in our discussions with 2 million other members - it's free and quick! Some forums can only be seen by registered members. After you create your account, you'll be able to customize options and access all our 15,000 new posts/day with fewer ads.
View detailed profile (Advanced) or search
site with Google Custom Search

Search Forums  (Advanced)
Reply Start New Thread
 
Old 09-14-2015, 06:58 AM
 
Location: Northern Ireland and temporarily England
7,668 posts, read 5,262,503 times
Reputation: 1392

Advertisements

This is an interesting preposition.

It's hard to predict because I don't know what way things are swinging? Lately we've been colder.

January: 5.8c/0.4c
February: 6.3c/0.8c
March: 7:9c/1.3c
April: 11.7c/2.9c
May: 14.6c/6.5c
June: 17.2c/8.8c
July: 19.0c/9.9c
August: 19.1c/9.8c
September: 17.7c/9.2c
October: 13.7c/6.7c
November: 8.1c/2.2c
December: 6.1c/1.6c
Reply With Quote Quick reply to this message

 
Old 09-14-2015, 06:59 AM
 
Location: Northern Ireland and temporarily England
7,668 posts, read 5,262,503 times
Reputation: 1392
Quote:
Originally Posted by irlinit View Post
So whether you believe in global warming or not, please post your predictions of the averages of your climate now, followed by your predictions for 100 years time.

For my area in London, there has been a noticeable warming trend.. minima are higher than they used to be thanks in part to the UHI, but also temperatures in general have risen in recent decades for almost every month.

Current averages in degrees celcius:

Jan: 8/2
Feb: 9/2
Mar: 12/4
Apr: 14/6
May: 18.0/9
Jun: 21.0/12
Jul: 24/14
Aug: 23/14
Sep: 20/11
Oct: 16/8
Nov: 11/5
Dec: 8/3

Average absolute max each year: 33.4C/92F

2114 predictions:

Jan: 10/3
Feb: 11/3
Mar: 14/5
Apr: 16/7
May: 20/10
Jun: 23/14
Jul: 26/16
Aug: 26/16
Sep: 22/14
Oct: 17/10
Nov: 14/7
Dec: 11/4

Average absolute max each year: 35.8C/96F


This is based on about a 1-2C increase in temperature for the majority of the months including bigger UHI.

Generally it would be a much better climate for me, and would be very close to being classified as subtropical with a July mean of 21C
11c average high in winter? Really!? I don't think so..
Reply With Quote Quick reply to this message
 
Old 09-14-2015, 07:03 AM
 
Location: Northern Ireland and temporarily England
7,668 posts, read 5,262,503 times
Reputation: 1392
Quote:
Originally Posted by chicagogeorge View Post
London and the UK in general are going to see the least amount of warming when compared to the rest of Europe. That's obviously because of the Atlantic's influence.


Personally, I think these models are full of crap. I doubt there will be more than an additional 1C rise in mean temps within the next 100 years.

This is absolute bull. Why do they even put this crap out. This is nothing more than alarmism
I think it might cool where I live.
Reply With Quote Quick reply to this message
 
Old 09-14-2015, 07:43 AM
 
Location: Munich, Germany
1,761 posts, read 1,686,070 times
Reputation: 1203
Here is my Prediction for Munich City 2081-2110


Munich has already warmed up immensely the last few years.
Here are averages from the Munich City weather station for the last 10 years ( August 2005-August 2015)
Klima München - Wetterdienst.de
Reply With Quote Quick reply to this message
 
Old 09-14-2015, 10:29 AM
 
29,541 posts, read 19,632,331 times
Reputation: 4551
If you believe the climate models this is how many 90F/32C days Chicago/ORD will get. Currently OD averages 17 such days (MDW averages 23).


Here's How Many Ridiculously Hot Days Your City Will Have in the Future | Mother Jones


Ironically, we have been going in the exact opposite direction then they forecast models

Reply With Quote Quick reply to this message
 
Old 09-14-2015, 10:57 AM
 
Location: Freiburg
1,387 posts, read 1,189,563 times
Reputation: 648
That's because of the Cold Epoch. I'm certain the trend will reverse soon.
Reply With Quote Quick reply to this message
 
Old 09-14-2015, 11:35 AM
 
29,541 posts, read 19,632,331 times
Reputation: 4551
Quote:
Originally Posted by alphatier View Post
That's because of the Cold Epoch. I'm certain the trend will reverse soon.
You're kidding right? There is no cold epoch, and there is no evidence that points to any reversal in trends for the Midwest.


Our extreme heat has become a thing of the past it seems, or at least much more rare. Though, our average temperatures have climbed a little bit.


Some point to the fact that our summers are getting muggier. Higher dew points make it more difficult for temps to climb that high, but keep nights warmer, and heat indecies higher


Winters are generally getting milder (though the trend seems to have reversed the last 5 years)


http://www.climatecentral.org/news/s...ur-state-18608
Reply With Quote Quick reply to this message
 
Old 09-15-2015, 09:32 PM
 
Location: Wisconsin
623 posts, read 675,650 times
Reputation: 348
In 100 years: they should be about the same temperature-wise, but 5-10" wetter.
For each normal period, average temperature in January/July/Annual and then annual precipitation (deg F and in)

1921-1950 19.1 / 73.0 / 46.6 // 30.00 (warmest normals, warmest summer and winter)
1931-1960 18.0 / 71.1 / 45.3 // 30.16
1941-1970 16.8 / 70.1 / 44.9 // 30.25 (coldest normals, coldest summer)
1951-1980 15.6 / 70.6 / 45.2 // 30.84(coldest winter)
1961-1990 16.0 / 71.0 / 45.2 // 30.88
1971-2000 17.3 / 71.6 / 46.1 // 32.95
1981-2010 18.8 / 71.3 / 46.4 // 34.48

2081-2110 23.8 / 74.3 / 50.2 // 45.06 (linear extrapolation from 1941-1970)
2081-2110 18.3 / 68.5 / 46.1 // 41.95 (linear extrapolation from 1921-1950)


Edit: Found images of the long-term temperature, snowfall, precipitation, etc at this site.


The diurnal range probably didn't change as much as it looks. Data was taken in the city (early years) and airport in later years. Before 1896 temperatures were only recorded at 7am, 2pm, and 7pm so the max/min wasn't always the true value.


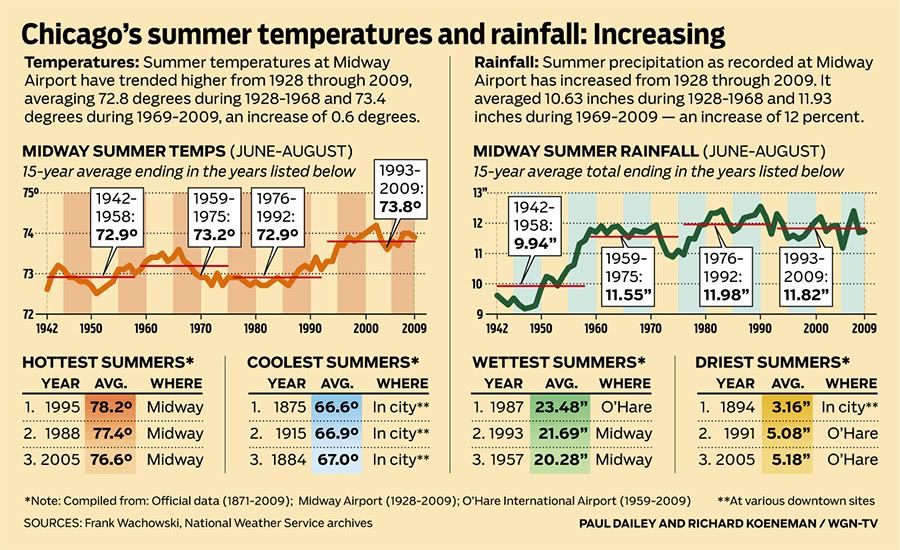
Except for a few extremely wet years in the early 1880s, most of the wettest years have been recent.


Snowfall has been up since the 1950s or so. 2013-2014 had about 60" of snow, 2014-2015 had a little under 30".


Temperatures have stayed similar and so has the annual maximum temperature, but the heating degree days have trended downward, annual minimum temperature has been milder as of late, and the average ice cover at the largest lake in Madison (Lake Mendota) has decreased steadily:


Last edited by Crunch41; 09-15-2015 at 10:06 PM..
Reply With Quote Quick reply to this message
 
Old 09-17-2015, 05:08 AM
 
29,541 posts, read 19,632,331 times
Reputation: 4551
Quote:
Originally Posted by chicagogeorge View Post
If you believe the climate models this is how many 90F/32C days Chicago/ORD will get. Currently OD averages 17 such days (MDW averages 23).


Here's How Many Ridiculously Hot Days Your City Will Have in the Future | Mother Jones


Ironically, we have been going in the exact opposite direction then they forecast models
Hmm...


https://twitter.com/SteveSGoddard/st...65875945078784
Reply With Quote Quick reply to this message
 
Old 09-21-2015, 03:26 AM
 
44 posts, read 74,839 times
Reputation: 47
Here are a couple of data visualizations I put together. It's based on the NASA NEX-GDDP climate projections at RCP 8.5 using data for 2015, 2050 and 2100. Click on a visualization to go to the blog post and interact with it.

All data compare future US & Canadian climate analogs with present-day cities. Unsurprisingly, the data show that matches are closer to the equator in future years, but some of the matches are interesting. It's also intriguing that southern cities seem to be less impacted (as shown by blue lines) than mid and upper-latitude cities.


To skip the blog posts and go straight to the main site to browse the data, go here.
Reply With Quote Quick reply to this message
Please register to post and access all features of our very popular forum. It is free and quick. Over $68,000 in prizes has already been given out to active posters on our forum. Additional giveaways are planned.

Detailed information about all U.S. cities, counties, and zip codes on our site: City-data.com.


Reply
Please update this thread with any new information or opinions. This open thread is still read by thousands of people, so we encourage all additional points of view.

Quick Reply
Message:


Over $104,000 in prizes was already given out to active posters on our forum and additional giveaways are planned!

Go Back   City-Data Forum > General Forums > Weather

All times are GMT -6. The time now is 07:01 PM.

© 2005-2024, Advameg, Inc. · Please obey Forum Rules · Terms of Use and Privacy Policy · Bug Bounty

City-Data.com - Contact Us - Archive 1, 2, 3, 4, 5, 6, 7, 8, 9, 10, 11, 12, 13, 14, 15, 16, 17, 18, 19, 20, 21, 22, 23, 24, 25, 26, 27, 28, 29, 30, 31, 32, 33, 34, 35, 36, 37 - Top