Please register to participate in our discussions with 2 million other members - it's free and quick! Some forums can only be seen by registered members. After you create your account, you'll be able to customize options and access all our 15,000 new posts/day with fewer ads.
Location: João Pessoa,Brazil(The easternmost point of Americas)
2,540 posts, read 2,005,110 times
Reputation: 644
It is only 23pm at BR time and many stations on Southern Brazil are already close or below freezing, their coldest temperature are usually registered during 7am, so there are a chance to many towns there broke their April all time record low.
Merely uttering the words ‘El Nino’ sends shudders down my thorax. But we still have plenty of reasons for hope. Most international climate models have us reaching the El Nino threshold at some point during the winter. Classic El Nino events are not great news for the Aussie Alps, they are associated with nasty highs parking their fat arse over the region blocking off all the juicy snow-bearing fronts to the south.
Quote:
Sometimes we get a double dose of ass-whopping. The Indian Nino (or the Indian Dipole as it is more commonly known) is the see-saw in sea surface temperature anomalies between the Arabian Sea and the South of Indonesia. Generally speaking, a negative IOD gives us wetter than average conditions in South Australia while a positive IOD does the opposite. While the IOD is currently neutral most international climate models (not BOM) forecast it to turn positive for the second half of winter possibly increasing the chances of a drier than average period reinforcing the effects of a developing El Nino.
Quote:
It is entirely possible that neutral ENSO conditions prevail throughout the entire winter. Neutral years register on average 20cm more snow than either La Nina or El Nino years. Even if an El Nino does develop it is likely to be weaker than the bully we saw in 2015. No two El Nino’s are the same. We have our “classics” and then the “wrong’uns”. Wrong’uns deliver much more snow than you’d expect compared with a normal El Nino year. During a wrong’un the juicy lows to the south cosy up to the Aussie Alps and westerly winds blow our worries away resulting in huge grins all around and a happy Reggae Ellis. 1992 and 2004 are good examples, they registered 316 cm and 216 cm of snow respectively.
Peak snow depth chart since 1971 (also from the article:
Plenty of variability in peak snow depth, it's not uncommon to get a really fabulous year followed by a shocker, such as 1981 (361cm) and 1982 (91cm).
March was - thankfully - very wet and cloudy . One of the best months in my "criteria"
Rain (326mm) fell on all but seven days making it the wettest March since 1975 (380mm) and the monthly sun total of 140 hours was the lowest since 1989 (136 hrs) and the lowest of any month since June 2013 (118 hrs)
This month (April) started off on a great note with wet and cloudy weather that had begun from the third week of February onwards but halfway through, conditions changed with far too much sunny, dry and icy westerlies blowing
Very cold yesterday as well as this morning with icy westerlies being horrendous in wind tunnel areas
Last edited by koyaanisqatsi1; 04-28-2017 at 09:53 PM..
March was - thankfully - very wet and cloudy . One of the best months in my "criteria"
Rain (326mm) fell on all but seven days making it the wettest March since 1975 (380mm) and the monthly sun total of 140 hours was the lowest since 1989 (136 hrs) and the lowest of any month since June 2013 (118 hrs)
This month (April) started off on a great note with wet and cloudy weather continuing since the third week of February but halfway through, conditions changed with far too much sunny, dry and icy westerlies blowing
Very cold yesterday as well as this morning with icy westerlies being horrendous in wind tunnel areas
After experiencing the hottest nights on record - I wouldn't expect you to understand
10C under an icy westerly flow (wind chill factor making it feel like 4 to 5C) would feel very cold to us "Sydneysiders" after an prolonged period of when minimums failed to drop below 20C for weeks
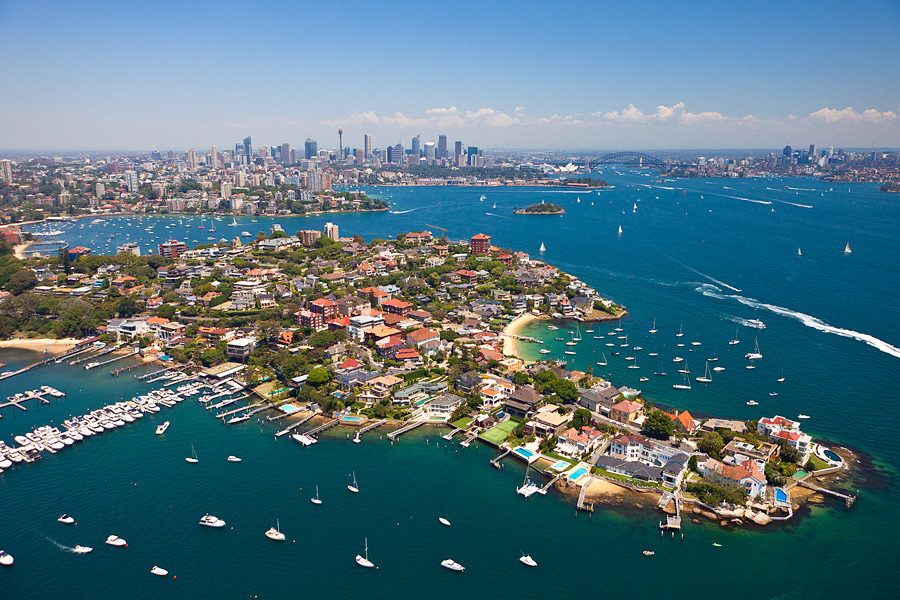
I'd like to see a weather station and climate data for that little green triangle next to the blue oval at the tip of that peninsula in the foreground of the Sydney pic. Anyone wanna make a climate box for it?
Please register to post and access all features of our very popular forum. It is free and quick. Over $68,000 in prizes has already been given out to active posters on our forum. Additional giveaways are planned.
Detailed information about all U.S. cities, counties, and zip codes on our site: City-data.com.

 Please register to participate in our discussions with 2 million other members - it's free and quick! Some forums can only be seen by registered members. After you create your account, you'll be able to customize options and access all our 15,000 new posts/day with fewer ads.


 . One of the best months in my "criteria"