Baxter, TN (Tennessee) Houses and Residents
| Baxter: | $241,326 |
| Tennessee: | $284,800 |
Mean price in 2022:
Detached houses: $591,097
Here: $591,097 State: $374,382 Mobile homes: $67,907
Here: $67,907 State: $101,421
Total population: 1,396 (Urban population: 1,081 (all inside urban clusters), Rural population: 194 (all nonfarm))
Houses: 792 (624 occupied: 460 owner occupied, 182 renter occupied)
| % of renters here: | 28% |
| State: | 33% |
Housing density: 427 houses/condos per square mile
Median price asked for vacant for-sale houses and condos in 2022: $4,306,186.
Median contract rent in 2022: $619 (lower quartile is $358, upper quartile is $736)
Median rent asked for vacant for-rent units in 2022: $379
Median gross rent in Baxter, TN in 2022: $824
Housing units in Baxter with a mortgage: 272 (9 second mortgage, 0 home equity loan, 3 both second mortgage and home equity loan)
Houses without a mortgage: 0
Median household income for houses/condos with a mortgage: $85,874
Median household income for apartments without a mortgage: $63,134
Median monthly housing costs: $851
Compare current foreclosures near Baxter, TN:
| Photo | Address | Area | Beds / Baths | Price | Details |
|---|---|---|---|---|---|

|
#1
Buffalo Valley Rd
Baxter, TN 38544
|
1,530 sq. feet
|
2 baths - beds |
show details | |

|
#2
Cookeville Boatdock Rd
Baxter, TN 38544
|
1,000 sq. feet
|
1 baths - beds |
show details | |

|
#3
1st Ave N
Baxter, TN 38544
|
1,590 sq. feet
|
1 baths - beds |
show details | |

|
#4
Bethany Rd
Baxter, TN 38544
|
1,204 sq. feet
|
1 baths - beds |
show details | |

|
#5
Water Plant Rd
Baxter, TN 38544
|
1,260 sq. feet
|
1 baths - beds |
show details | |

|
#6
Hickey Ridge Rd
Baxter, TN 38544
|
980 sq. feet
|
- baths - beds |
show details | |

|
#7
Chaffin Rd
Baxter, TN 38544
|
- sq. feet
|
- baths - beds |
show details | |

|
#8
Henley Rd
Baxter, TN 38544
|
- sq. feet
|
- baths - beds |
show details | |

|
#9
3rd Ave N
Baxter, TN 38544
|
- sq. feet
|
- baths - beds |
show details | |

|
#10
Bryant Ridge Rd
Baxter, TN 38544
|
- sq. feet
|
- baths - beds |
show details |
| Photo | Address | Area | Beds / Baths | Price | Details |
|---|---|---|---|---|---|

|
#11
6th Ave S
Baxter, TN 38544
|
- sq. feet
|
- baths - beds |
show details | |

|
#12
Parwood Dr
Baxter, TN 38544
|
- sq. feet
|
- baths - beds |
show details | |

|
#13
Paran Rd
Cookeville, TN 38506
|
1,500 sq. feet
|
2 baths - beds |
show details | |

|
#14
Dry Valley Rd
Cookeville, TN 38506
|
1,968 sq. feet
|
2 baths - beds |
show details | |

|
#15
Horner Rd
Cookeville, TN 38501
|
1,400 sq. feet
|
1 baths - beds |
show details | |

|
#16
N Salem Rd
Cookeville, TN 38506
|
1,403 sq. feet
|
2 baths - beds |
show details | |

|
#17
Fairview Ave
Gordonsville, TN 38563
|
1,612 sq. feet
|
1 baths - beds |
show details | |

|
#18
Spring Creek Rd
Cookeville, TN 38506
|
1,305 sq. feet
|
2 baths - beds |
show details | |

|
#19
Rocky Point Rd
Cookeville, TN 38506
|
2,297 sq. feet
|
3 baths - beds |
show details | |

|
#20
Rockwell Dr
Cookeville, TN 38506
|
1,392 sq. feet
|
2 baths - beds |
show details |
| Photo | Address | Area | Beds / Baths | Price | Details |
|---|---|---|---|---|---|

|
#21
Rockwell Dr
Cookeville, TN 38506
|
1,406 sq. feet
|
2 baths - beds |
show details | |

|
#22
Carthon Jones Ln
Gainesboro, TN 38562
|
1,520 sq. feet
|
2 baths - beds |
show details | |

|
#23
Wildcat Rd
Sparta, TN 38583
|
1,962 sq. feet
|
2 baths - beds |
show details | |

|
#24
Wildcat Rd
Sparta, TN 38583
|
1,400 sq. feet
|
2 baths - beds |
show details | |

|
#25
Ridgewood Rd
Cookeville, TN 38501
|
1,288 sq. feet
|
2 baths - beds |
show details | |

|
#26
Linda Ave
Cookeville, TN 38506
|
1,008 sq. feet
|
1 baths - beds |
show details | |

|
#27
Ensor Hollow Rd
Buffalo Valley, TN 38548
|
2,096 sq. feet
|
1 baths - beds |
show details | |

|
#28
Shannon Dr
Cookeville, TN 38506
|
1,200 sq. feet
|
1 baths - beds |
show details | |

|
#29
Bay View Dr
Cookeville, TN 38506
|
2,128 sq. feet
|
2 baths - beds |
show details | |

|
#30
Edgewood Dr
Cookeville, TN 38501
|
1,431 sq. feet
|
1 baths - beds |
show details |
| Photo | Address | Area | Beds / Baths | Price | Details |
|---|---|---|---|---|---|

|
#31
Garrison Rd
Cookeville, TN 38501
|
1,184 sq. feet
|
1 baths - beds |
show details | |

|
#32
Johnnie Bud Ln
Cookeville, TN 38501
|
1,344 sq. feet
|
2 baths - beds |
show details | |

|
#33
Post Oak Bridge Rd
Cookeville, TN 38506
|
1,120 sq. feet
|
1 baths - beds |
show details | |

|
#34
Woodwinds Dr
Cookeville, TN 38501
|
1,749 sq. feet
|
2 baths - beds |
show details | |

|
#35
N Pine Hill Rd
Cookeville, TN 38501
|
936 sq. feet
|
1 baths - beds |
show details | |

|
#36
Bunker Hill Rd
Cookeville, TN 38506
|
520 sq. feet
|
1 baths - beds |
show details | |

|
#37
Highland Ave
Cookeville, TN 38501
|
1,242 sq. feet
|
1 baths - beds |
show details | |

|
#38
E Stevens St
Cookeville, TN 38501
|
1,152 sq. feet
|
1 baths - beds |
show details | |

|
#39
S Walnut Ave
Cookeville, TN 38501
|
986 sq. feet
|
1 baths - beds |
show details | |

|
#40
Lake Valley Dr
Cookeville, TN 38506
|
1,868 sq. feet
|
3 baths - beds |
show details |
| Photo | Address | Area | Beds / Baths | Price | Details |
|---|---|---|---|---|---|

|
#41
Hawthorne Rd
Sparta, TN 38583
|
1,284 sq. feet
|
2 baths - beds |
show details | |

|
#42
Middleford Dr
Cookeville, TN 38506
|
1,334 sq. feet
|
2 baths - beds |
show details | |

|
#43
Ballard Ln
Sparta, TN 38583
|
1,533 sq. feet
|
1 baths - beds |
show details | |

|
#44
Temperance Hall Hwy
Hickman, TN 38567
|
1,820 sq. feet
|
2 baths - beds |
show details | |

|
#45
Monterey Hwy
Sparta, TN 38583
|
1,980 sq. feet
|
1 baths - beds |
show details | |

|
#46
Holmes Creek Rd
Smithville, TN 37166
|
1,856 sq. feet
|
2 baths - beds |
show details | |

|
#47
Maple St
Gordonsville, TN 38563
|
1,133 sq. feet
|
2 baths - beds |
show details | |

|
#48
Rocky Point Rd
Cookeville, TN 38506
|
784 sq. feet
|
1 baths - beds |
show details | |

|
#49
Horseshoe Bend Ln
Elmwood, TN 38560
|
1,380 sq. feet
|
1 baths - beds |
show details | |

|
Check over 1 million property listings on Foreclosure.com!
|
browse all offers | |||

Latest news about housing in Baxter, TN collected exclusively by city-data.com from local newspapers, TV, and radio stations

 | New residential construction - upscale homes (9 replies) |
| 2023 a record year for new housing in Putnam County (2 replies) |
| "More jobs may be coming to Baxter" (2 replies) |
| Baxter vs Cookeville in Tn (32 replies) |
| 2021 UC real estate market information (17 replies) |
| Interracial couple looking for new home (7 replies) |

Median year apartment built: 1982
Household type by relationship:
Households: 1,517- Male householders: 252 (86 living alone), Female householders: 371 (66 living alone)
288 spouses (288 opposite-sex spouses), 90 unmarried partners, (43 opposite-sex unmarried partners), 429 children (367 natural, 6 adopted, 55 stepchildren), 39 grandchildren, 0 brothers or sisters, 5 parents, 9 foster children, 5 other relatives, 26 non-relatives
Size of family households: 172 2-persons, 146 3-persons, 55 4-persons, 45 5-persons, 3 6-persons.
Size of nonfamily households: 158 1-person, 27 2-persons, 6 3-persons.
155 married couples with children.
168 single-parent households (64 men, 104 women).
95.6% of residents of Baxter speak English at home.
2.5% of residents speak Spanish at home (100% speak English very well).
1.1% of residents speak other Indo-European language at home (100% speak English well).
0.3% of residents speak Asian or Pacific Island language at home (100% speak English very well).
Foreign born population: 34 (2.2%)
(41.2% of them are naturalized citizens)
| Here: | 5.6 |
| State: | 6.5 |
| Here: | 4.9 |
| State: | 4.4 |

- Bedrooms in owner-occupied houses and condos in Baxter, Tennessee
- 29no bedroom
- 61 bedroom
- 582 bedrooms
- 3233 bedrooms
- 414 bedrooms
- 35+ bedrooms

- Bedrooms in renter-occupied apartments in Baxter, Tennessee
- 0no bedroom
- 251 bedroom
- 822 bedrooms
- 643 bedrooms
- 54 bedrooms
- 65+ bedrooms

- Cars and other vehicles available in Baxter in owner-occupied houses/condos
- 3no vehicle
- 1191 vehicle
- 2342 vehicles
- 613 vehicles
- 304 vehicles
- 145+ vehicles

- Cars and other vehicles available in Baxter in renter-occupied apartments
- 21no vehicle
- 941 vehicle
- 672 vehicles
- 03 vehicles
- 04 vehicles
- 05+ vehicles

- Rooms in owner-occupied houses in Baxter, Tennessee
- 291 room
- 02 rooms
- 03 rooms
- 924 rooms
- 1085 rooms
- 1126 rooms
- 547 rooms
- 308 rooms
- 369+ rooms

- Rooms in renter-occupied apartments in Baxter, Tennessee
- 01 room
- 82 rooms
- 293 rooms
- 504 rooms
- 205 rooms
- 376 rooms
- 267 rooms
- 128 rooms
- 09+ rooms


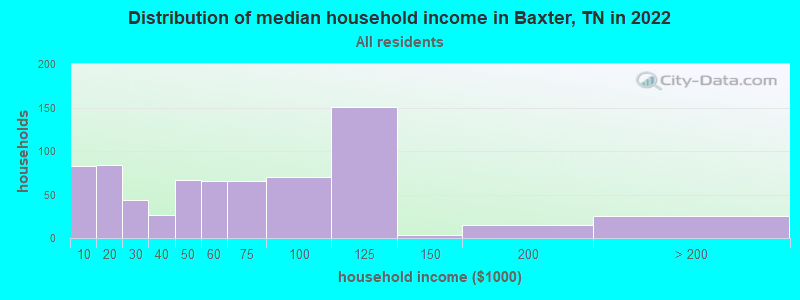
Baxter, TN household income distribution

- 83Less than $10,000
- 84$10,000 to $19,999
- 44$20,000 to $29,999
- 27$30,000 to $39,999
- 67$40,000 to $49,999
- 66$50,000 to $59,999
- 65$60,000 to $74,999
- 70$75,000 to $99,999
- 151$100,000 to $124,999
- 3$125,000 to $149,999
- 15$150,000 to $199,999
- 25$200,000 or more
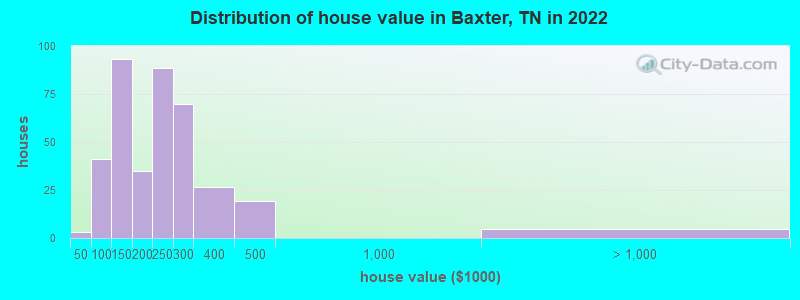
Home value of owner - occupied houses in 2022 in Baxter, TN
-
- 3Less than $10,000
- 5$50,000 to $59,999
- 7$60,000 to $69,999
- 6$70,000 to $79,999
- 21$90,000 to $99,999
- 56$100,000 to $124,999
- 37$125,000 to $149,999
- 17$150,000 to $174,999
- 17$175,000 to $199,999
- 88$200,000 to $249,999
- 69$250,000 to $299,999
- 26$300,000 to $399,999
- 19$400,000 to $499,999
- 4$1,500,000 to $1,999,999
Rent paid by renters in 2022 in Baxter, TN
-
- 4Less than $100
- 7$100 to $149
- 11$150 to $199
- 7$250 to $299
- 11$350 to $399
- 3$450 to $499
- 8$500 to $549
- 17$550 to $599
- 17$600 to $649
- 5$650 to $699
- 7$700 to $749
- 16$750 to $799
- 16$800 to $899
- 2$900 to $999
- 5$1,000 to $1,249
- 3$1,250 to $1,499
- 33No cash rent


Percentage of workers working in this county: 90.6%
Number of people working at home: 103 (15.7% of all workers)
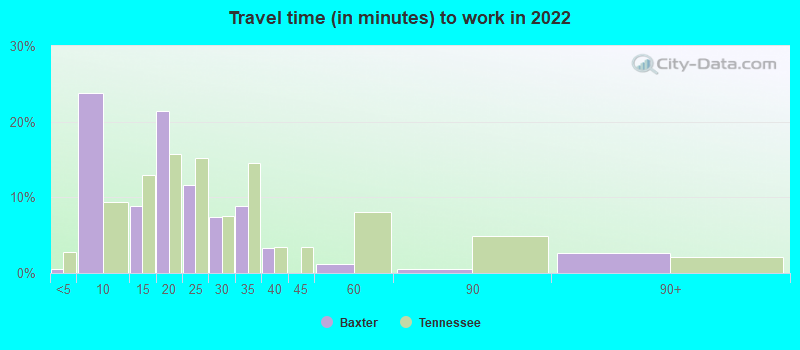
Travel time to work (commute)
- Less than 5 minutes: 5
- 5 to 9 minutes: 23
- 10 to 14 minutes: 101
- 15 to 19 minutes: 147
- 20 to 24 minutes: 147
- 25 to 29 minutes: 26
- 30 to 34 minutes: 120
- 35 to 39 minutes: 2
- 40 to 44 minutes: 0
- 45 to 59 minutes: 0
- 60 to 89 minutes: 12
- 90 or more minutes: 0
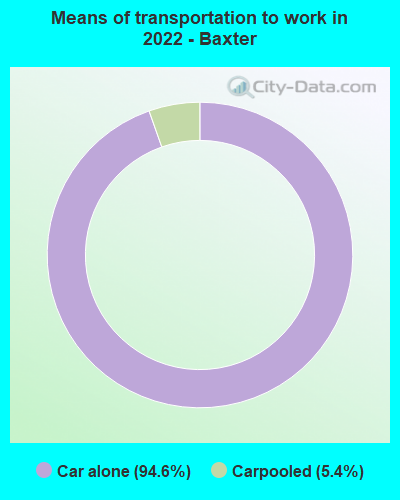
Means of transportation to work:
- Drove a car alone: 799 (83.0%)
- Carpooled: 48 (5.0%)
- Worked at home: 103 (10.7%)

- Unemployment by race in 2022
- Unemployment rate for White non-Hispanic residents
- 2.0%Males

- Year of entry for the foreign-born population in Baxter, Tennessee
- 12010 or later
- 162000 to 2009
- 21990 to 1999
- 41980 to 1989
- 01970 to 1979
- 2Before 1970

First ancestries reported:
- American: 454 (53.9%)
- English: 106 (12.6%)
- German: 77 (9.1%)
- Irish: 40 (4.7%)
- Scottish: 40 (4.7%)
- Danish: 12 (1.4%)
- Italian: 10 (1.2%)
- French: 8 (0.9%)
- Dutch: 7 (0.8%)
- British: 5 (0.6%)
- European: 3 (0.4%)
- Polish: 2 (0.2%)
- Scotch-Irish: 2 (0.2%)
Most common places of birth for foreign-born residents (%):
| Baxter: | 58.3% (14) |
| Tennessee: | 23.0% (86,435) |
| Baxter: | 20.8% (5) |
| Tennessee: | 2.2% (8,261) |
| Baxter: | 4.2% (1) |
| Tennessee: | 2.3% (8,490) |
Place of birth for U.S.-born residents:
- This state: 1,012
- Other state: 430
- Northeast: 30
- Midwest: 91
- South: 255
- West: 52
81.7% of Baxter residents lived in the same house 1 years ago.
Out of people who lived in different houses, 31.8% lived in this county.
Out of people who lived in different counties, 5.2% lived in Tennessee.
| Baxter: | 81.7% |
| State average: | 87.0% |
Education attainment for males 25 years and older:
- No schooling: 3
- Nursery to 4th grade: 0
- 5th and 6th grade: 0
- 7th and 8th grade: 3
- 9th grade: 8
- 10th grade: 1
- 11th grade: 12
- 12th grade, no diploma: 7
- High school graduate (or equivalency): 270
- Less than 1 year of college: 39
- Some college more than 1 year, no degree: 88
- Associate degree: 22
- Bachelor's degree: 22
- Master's degree: 17
- Professional school degree: 0
- Doctorate degree: 8

Education attainment for females 25 years and older:
- No schooling: 0
- Nursery to 4th grade: 0
- 5th and 6th grade: 3
- 7th and 8th grade: 6
- 9th grade: 7
- 10th grade: 0
- 11th grade: 11
- 12th grade, no diploma: 1
- High school graduate (or equivalency): 230
- Less than 1 year of college: 58
- Some college more than 1 year, no degree: 140
- Associate degree: 18
- Bachelor's degree: 67
- Master's degree: 5
- Professional school degree: 0
- Doctorate degree: 5


Housing units in structures:
- One, detached: 553
- One, attached: 11
- Two: 36
- 3 or 4: 12
- 5 to 9: 46
- 10 to 19: 11
- Mobile homes: 121
Median worth of mobile homes: $71,498
Housing units lacking complete kitchen facilities in 2022: 1.2%
House/condo owner moved in on average 6 years ago
Renter moved in on average 4 years ago

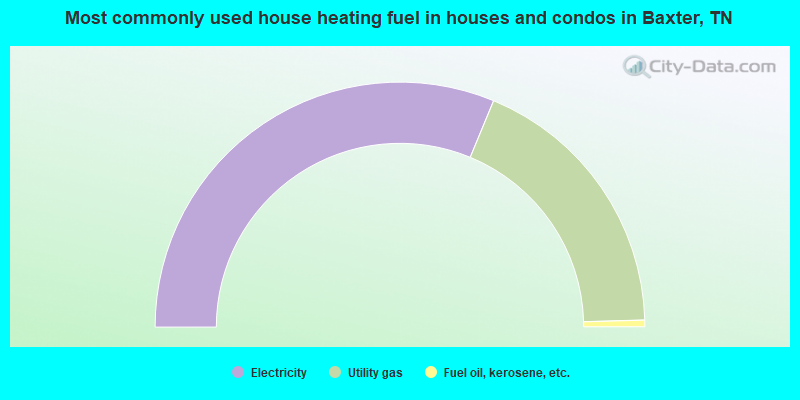
- 62.5%Electricity
- 36.6%Utility gas
- 0.9%Fuel oil, kerosene, etc.
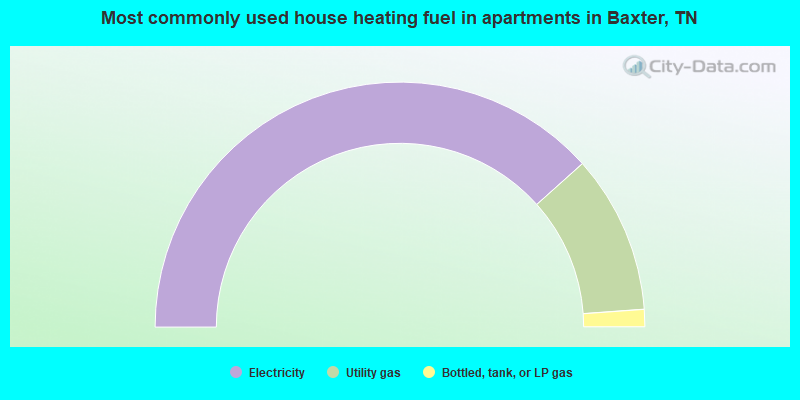
- 76.7%Electricity
- 20.9%Utility gas
- 2.3%Bottled, tank, or LP gas
Private vs. public school enrollment:
| Here: | 1.4% |
| Tennessee: | 15.0% |
| Here: | 0.0% |
| Tennessee: | 16.2% |
| Here: | 72.7% |
| Tennessee: | 23.5% |


