Branson, MO (Missouri) Houses and Residents
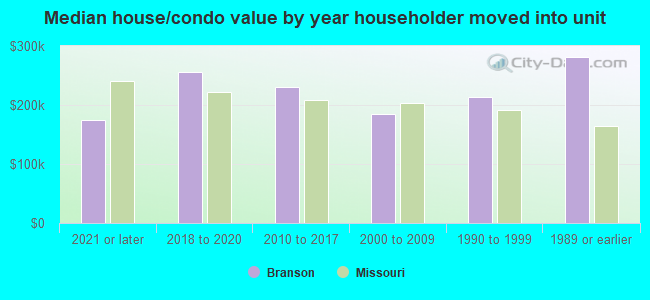
| Branson: | $223,973 |
| Missouri: | $221,200 |
Total population: 11,340 (Urban population: 5,343 (all inside urban clusters), Rural population: 862 (all nonfarm))
Houses: 8,877 (5,655 occupied: 2,586 owner occupied, 3,151 renter occupied)
| % of renters here: | 55% |
| State: | 32% |
Housing density: 549 houses/condos per square mile
Median price asked for vacant for-sale houses and condos in 2022: $1,504,732.
Median contract rent in 2022: $836 (lower quartile is $715, upper quartile is $945)
Median rent asked for vacant for-rent units in 2022: $684
Median gross rent in Branson, MO in 2022: $913
Housing units in Branson with a mortgage: 1,487 (34 second mortgage, 0 home equity loan, 16 both second mortgage and home equity loan)
Houses without a mortgage: 16
Median household income for houses/condos with a mortgage: $75,613
Median household income for apartments without a mortgage: $54,169
Median monthly housing costs: $892
Compare current foreclosures near Branson, MO:
| Photo | Address | Area | Beds / Baths | Price | Details |
|---|---|---|---|---|---|

|
#1
Deer Run Rd
Branson, MO 65616
|
1,650 sq. feet
|
2 baths 3 beds |
show details | |

|
#2
Windridge St
Branson, MO 65616
|
1,658 sq. feet
|
- baths - beds |
show details | |

|
#3
Keeter St # 4125
Branson, MO 65616
|
- sq. feet
|
- baths - beds |
show details | |

|
#4
Berry Dr Apt A10
Branson, MO 65616
|
- sq. feet
|
- baths - beds |
show details | |

|
#5
Arlene Dr Apt A201
Branson, MO 65616
|
- sq. feet
|
- baths - beds |
show details | |

|
#6
Westlake Ct
Branson, MO 65616
|
- sq. feet
|
- baths - beds |
show details | |

|
#7
Turtle Creek Dr
Branson, MO 65616
|
- sq. feet
|
- baths - beds |
show details | |

|
#8
Bird Rd Apt 308
Branson, MO 65616
|
- sq. feet
|
- baths - beds |
show details | |

|
#9
Shepherd Of The Hills Expy # 107
Branson, MO 65616
|
- sq. feet
|
- baths - beds |
show details | |

|
#10
Falls Pkwy # 302
Branson, MO 65616
|
- sq. feet
|
- baths - beds |
show details |
| Photo | Address | Area | Beds / Baths | Price | Details |
|---|---|---|---|---|---|

|
#11
Candle Dr
Branson, MO 65616
|
- sq. feet
|
- baths - beds |
show details | |

|
#12
Buzz St Unit 22
Branson, MO 65616
|
- sq. feet
|
- baths - beds |
show details | |

|
#13
Sandhills Ct
Branson, MO 65616
|
- sq. feet
|
- baths - beds |
show details | |

|
#14
Aberdeen Ln, Apt 4
Branson, MO 65616
|
- sq. feet
|
- baths - beds |
show details | |

|
#15
Bumblebee St # 22
Branson, MO 65616
|
- sq. feet
|
- baths - beds |
show details | |

|
#16
Rock Ridge Rd
Branson, MO 65616
|
- sq. feet
|
- baths - beds |
show details | |

|
#17
Clay St
Branson, MO 65616
|
- sq. feet
|
- baths - beds |
show details | |

|
#18
Colleen St Apt 2107
Branson, MO 65616
|
- sq. feet
|
- baths - beds |
show details | |

|
#19
S Wildwood Dr Apt 12-3
Branson, MO 65616
|
- sq. feet
|
- baths - beds |
show details | |

|
#20
Golfshores Dr # 4
Branson, MO 65616
|
- sq. feet
|
- baths - beds |
show details |
| Photo | Address | Area | Beds / Baths | Price | Details |
|---|---|---|---|---|---|

|
#21
Main St
Reeds Spring, MO 65737
|
1,890 sq. feet
|
2 baths 3 beds |
$79,900
|
show details |

|
#22
State Highway Vv
Powersite, MO 65731
|
1,144 sq. feet
|
2 baths 3 beds |
$135,000
|
show details |

|
#23
Mark Twain Dr
Reeds Spring, MO 65737
|
5,540 sq. feet
|
5 baths 5 beds |
$625,000
|
show details |

|
#24
Deer Run Rd
Branson, MO 65616
|
- sq. feet
|
- baths - beds |
show details | |

|
#25
Pershing Dr
Branson, MO 65616
|
- sq. feet
|
- baths - beds |
show details | |

|
#26
River Valley Rd
Branson, MO 65616
|
- sq. feet
|
- baths - beds |
show details | |

|
#27
Treasure Lake Dr
Branson, MO 65616
|
- sq. feet
|
- baths - beds |
show details | |

|
#28
Deckard Ln
Kimberling City, MO 65686
|
- sq. feet
|
2 baths 5 beds |
$74,500
|
show details |

|
#29
Bluejay Rd
Blue Eye, MO 65611
|
- sq. feet
|
2 baths 4 beds |
$109,200
|
show details |

|
#30
Montague Ln
Kimberling City, MO 65686
|
1,712 sq. feet
|
2 baths 3 beds |
show details |
| Photo | Address | Area | Beds / Baths | Price | Details |
|---|---|---|---|---|---|

|
#31
Highway 103 N
Green Forest, AR 72638
|
1,368 sq. feet
|
2 baths - beds |
show details | |

|
#32
Fritts Way
Reeds Spring, MO 65737
|
1,252 sq. feet
|
- baths - beds |
show details | |

|
#33
College Rd
Omaha, AR 72662
|
1,920 sq. feet
|
4 baths - beds |
show details | |

|
#34
Pine St
Omaha, AR 72662
|
1,728 sq. feet
|
2 baths - beds |
show details | |

|
#35
Acacia Club Rd
Hollister, MO 65672
|
1,663 sq. feet
|
- baths - beds |
show details | |

|
#36
County Road 614
Green Forest, AR 72638
|
- sq. feet
|
- baths - beds |
show details | |

|
#37
Charles St
Taneyville, MO 65759
|
- sq. feet
|
- baths - beds |
show details | |

|
#38
Highway 21 N
Oak Grove, AR 72660
|
- sq. feet
|
- baths - beds |
show details | |

|
#39
Davidson Run
Kissee Mills, MO 65680
|
- sq. feet
|
- baths - beds |
show details | |

|
#40
Starfish Ln # B
Kimberling City, MO 65686
|
- sq. feet
|
- baths - beds |
show details |
| Photo | Address | Area | Beds / Baths | Price | Details |
|---|---|---|---|---|---|

|
#41
Grant St
Forsyth, MO 65653
|
- sq. feet
|
- baths - beds |
show details | |

|
#42
Cactus Ln
Reeds Spring, MO 65737
|
- sq. feet
|
- baths - beds |
show details | |

|
#43
S Main St
Galena, MO 65656
|
- sq. feet
|
- baths - beds |
show details | |

|
#44
Eagle Crst
Hollister, MO 65672
|
- sq. feet
|
- baths - beds |
show details | |

|
#45
Fritts Way
Reeds Spring, MO 65737
|
- sq. feet
|
- baths - beds |
show details | |

|
#46
Boo Boo Blvd # 347
Hollister, MO 65672
|
- sq. feet
|
- baths - beds |
show details | |

|
#47
River Point Rd Unit 5
Hollister, MO 65672
|
- sq. feet
|
- baths - beds |
show details | |

|
#48
Ns-18-7.0-36-003-007-040.000
Hollister, MO 65672
|
- sq. feet
|
- baths - beds |
show details | |

|
#49
Church St
Hollister, MO 65672
|
- sq. feet
|
- baths - beds |
show details | |

|
Check over 1 million property listings on Foreclosure.com!
|
browse all offers | |||

Latest news about housing in Branson, MO collected exclusively by city-data.com from local newspapers, TV, and radio stations


Median year apartment built: 1994
Household type by relationship:
Households: 12,699- Male householders: 2,293 (576 living alone), Female householders: 3,320 (1,638 living alone)
2,554 spouses (2,554 opposite-sex spouses), 312 unmarried partners, (306 opposite-sex unmarried partners), 2,570 children (2,355 natural, 36 adopted, 178 stepchildren), 284 grandchildren, 175 brothers or sisters, 220 parents, 44 foster children, 30 other relatives, 672 non-relatives
- In group quarters: 219
Size of family households: 1,834 2-persons, 544 3-persons, 459 4-persons, 37 5-persons, 115 6-persons, 11 7-or-more-persons.
Size of nonfamily households: 2,291 1-person, 411 2-persons, 46 3-persons.
1,768 married couples with children.
295 single-parent households (104 men, 191 women).
92.3% of residents of Branson speak English at home.
2.5% of residents speak Spanish at home (59% speak English very well, 18% speak English well, 23% speak English not well).
3.4% of residents speak other Indo-European language at home (46% speak English very well, 14% speak English well, 39% speak English not well).
2.3% of residents speak Asian or Pacific Island language at home (42% speak English very well, 49% speak English well, 10% speak English not well).
Foreign born population: 671 (5.3%)
(49.9% of them are naturalized citizens)
| Here: | 5.8 |
| State: | 6.4 |
| Here: | 4.0 |
| State: | 4.4 |
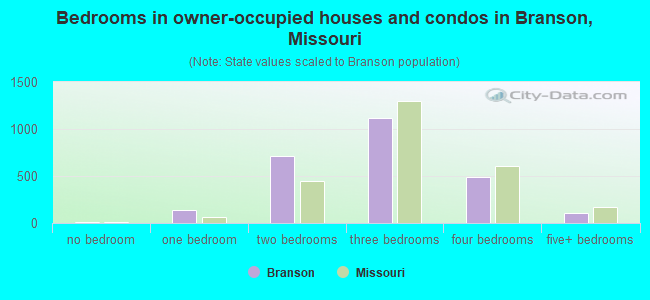
- Bedrooms in owner-occupied houses and condos in Branson, Missouri
- 14no bedroom
- 1431 bedroom
- 7142 bedrooms
- 1,1223 bedrooms
- 4904 bedrooms
- 1035+ bedrooms
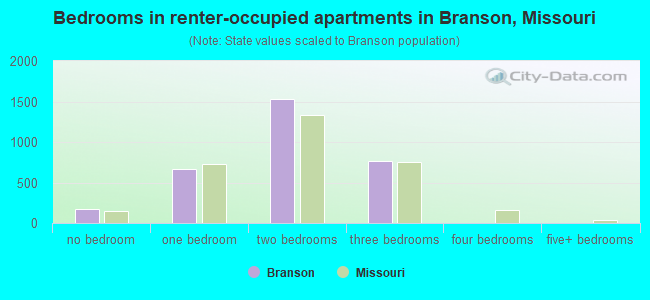
- Bedrooms in renter-occupied apartments in Branson, Missouri
- 178no bedroom
- 6641 bedroom
- 1,5372 bedrooms
- 7713 bedrooms
- 14 bedrooms
- 05+ bedrooms
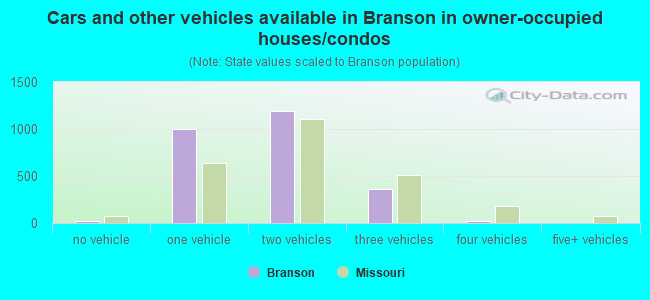
- Cars and other vehicles available in Branson in owner-occupied houses/condos
- 24no vehicle
- 9951 vehicle
- 1,1872 vehicles
- 3593 vehicles
- 224 vehicles
- 05+ vehicles
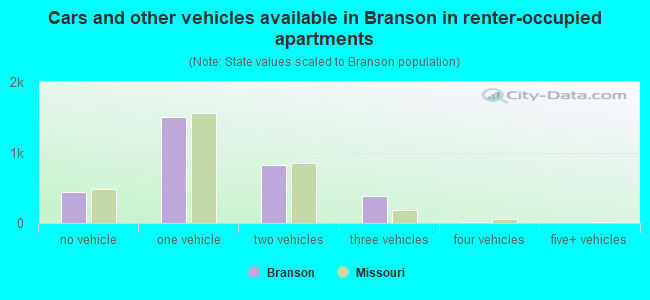
- Cars and other vehicles available in Branson in renter-occupied apartments
- 435no vehicle
- 1,5021 vehicle
- 8262 vehicles
- 3803 vehicles
- 94 vehicles
- 05+ vehicles
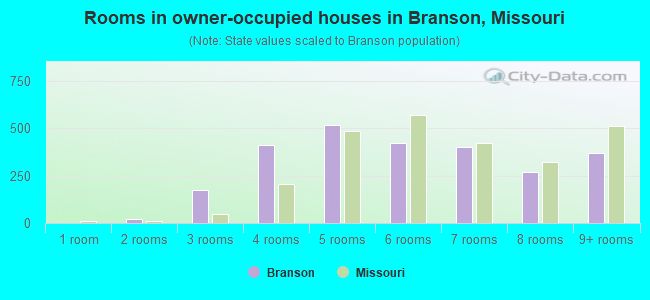
- Rooms in owner-occupied houses in Branson, Missouri
- 01 room
- 232 rooms
- 1763 rooms
- 4094 rooms
- 5175 rooms
- 4226 rooms
- 4027 rooms
- 2698 rooms
- 3689+ rooms
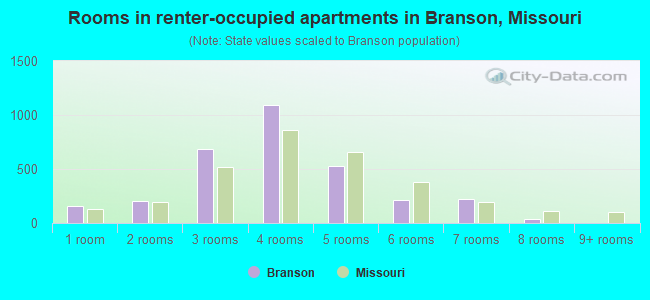
- Rooms in renter-occupied apartments in Branson, Missouri
- 1601 room
- 2062 rooms
- 6823 rooms
- 1,0964 rooms
- 5295 rooms
- 2176 rooms
- 2267 rooms
- 358 rooms
- 09+ rooms
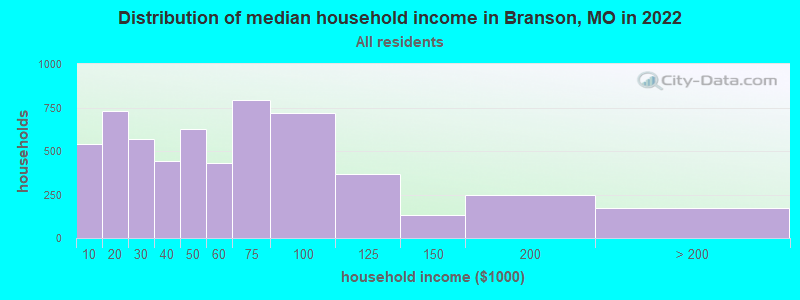
Branson, MO household income distribution

- 543Less than $10,000
- 732$10,000 to $19,999
- 567$20,000 to $29,999
- 442$30,000 to $39,999
- 626$40,000 to $49,999
- 432$50,000 to $59,999
- 793$60,000 to $74,999
- 718$75,000 to $99,999
- 365$100,000 to $124,999
- 132$125,000 to $149,999
- 246$150,000 to $199,999
- 172$200,000 or more
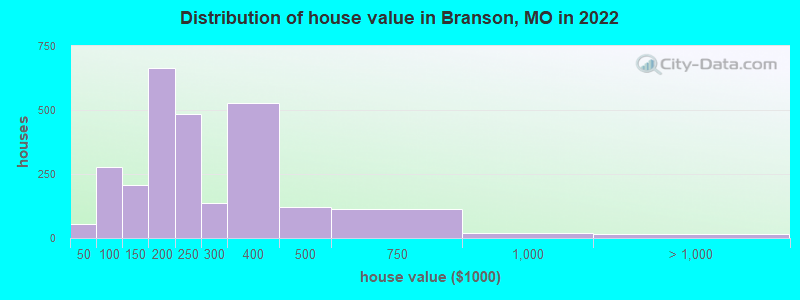
Home value of owner - occupied houses in 2022 in Branson, MO
-
- 56$40,000 to $49,999
- 64$60,000 to $69,999
- 47$70,000 to $79,999
- 64$80,000 to $89,999
- 43$90,000 to $99,999
- 77$100,000 to $124,999
- 128$125,000 to $149,999
- 367$150,000 to $174,999
- 295$175,000 to $199,999
- 482$200,000 to $249,999
- 136$250,000 to $299,999
- 527$300,000 to $399,999
- 122$400,000 to $499,999
- 114$500,000 to $749,999
- 20$750,000 to $999,999
- 6$1,500,000 to $1,999,999
- 6$2,000,000 or more
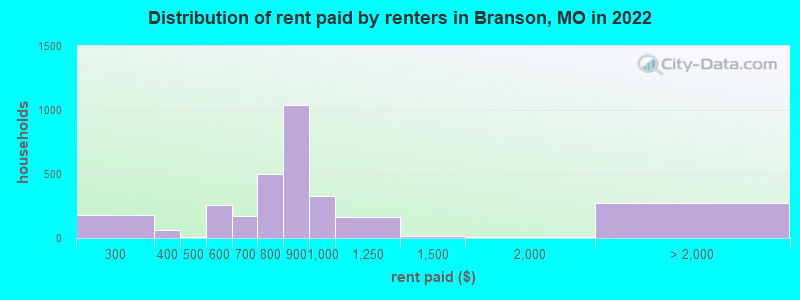
Rent paid by renters in 2022 in Branson, MO
-
- 147$200 to $249
- 27$250 to $299
- 15$300 to $349
- 46$350 to $399
- 7$450 to $499
- 142$500 to $549
- 115$550 to $599
- 132$600 to $649
- 39$650 to $699
- 214$700 to $749
- 289$750 to $799
- 1,041$800 to $899
- 327$900 to $999
- 166$1,000 to $1,249
- 17$1,250 to $1,499
- 5$1,500 to $1,999
- 165$2,000 to $2,499
- 106No cash rent
Percentage of workers working in this county: 92.4%
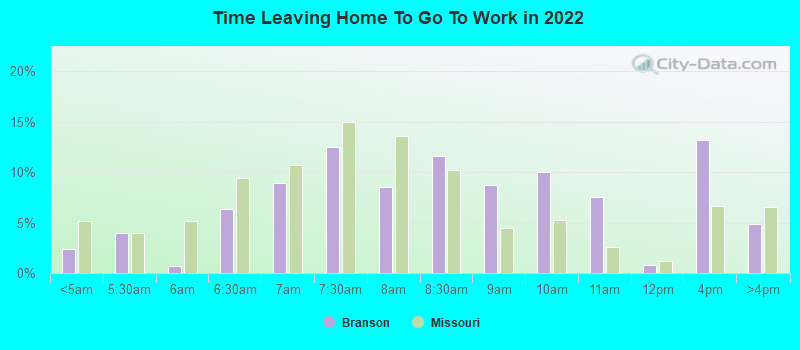
Number of people working at home: 988 (17.2% of all workers)
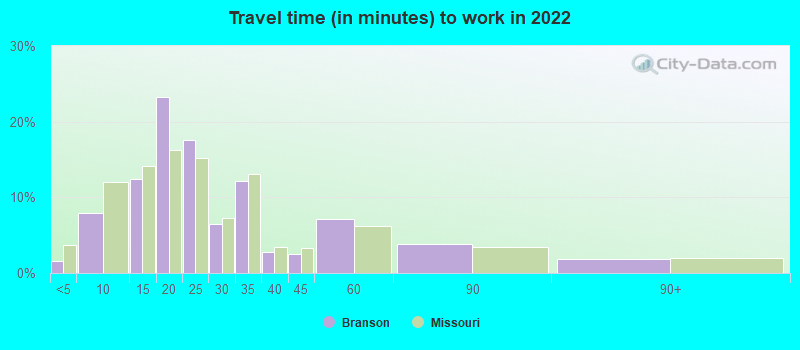
Travel time to work (commute)
- Less than 5 minutes: 193
- 5 to 9 minutes: 741
- 10 to 14 minutes: 1,171
- 15 to 19 minutes: 1,226
- 20 to 24 minutes: 800
- 25 to 29 minutes: 127
- 30 to 34 minutes: 287
- 35 to 39 minutes: 48
- 40 to 44 minutes: 27
- 45 to 59 minutes: 114
- 60 to 89 minutes: 66
- 90 or more minutes: 16
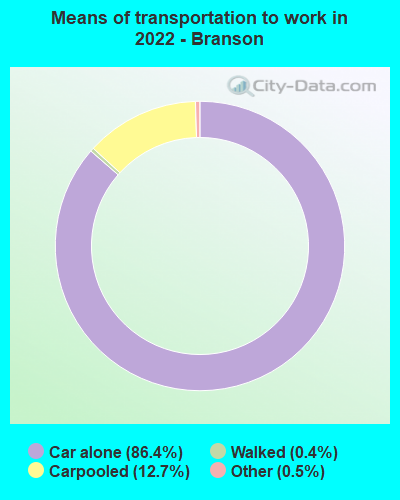
Means of transportation to work:
- Drove a car alone: 13,890 (80.0%)
- Carpooled: 2,065 (11.9%)
- Bus: 5 (0.0%)
- Taxi: 83 (0.5%)
- Walked: 62 (0.4%)
- Worked at home: 988 (5.7%)
- Unemployment by race in 2022
- Unemployment rate for White non-Hispanic residents
- 3.2%Males
- 1.7%Females
- Unemployment rate for Asian residents
- 33.9%Males
- Unemployment rate for other race residents
- 40.5%Males
- 3.2%Females
- Unemployment rate for two or more race residents
- 7.5%Males
- Unemployment rate for Hispanic or Latino residents
- 2.7%Males
- 1.0%Females
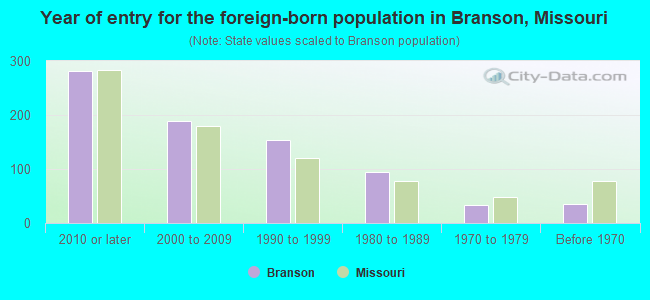
- Year of entry for the foreign-born population in Branson, Missouri
- 2812010 or later
- 1892000 to 2009
- 1541990 to 1999
- 941980 to 1989
- 341970 to 1979
- 36Before 1970
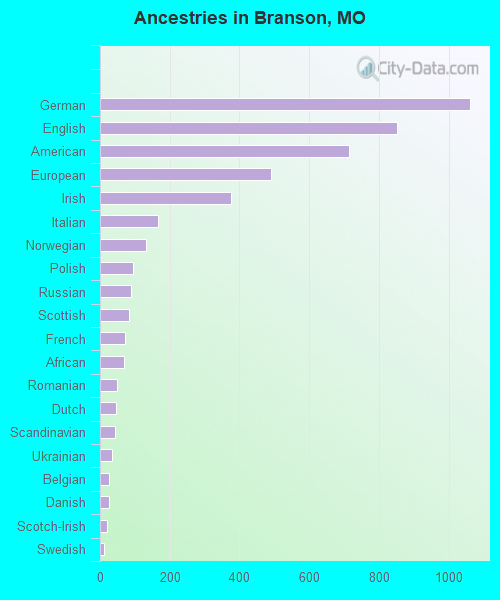
First ancestries reported:
- German: 1,063 (18.4%)
- English: 853 (14.8%)
- American: 715 (12.4%)
- European: 491 (8.5%)
- Irish: 375 (6.5%)
- Italian: 165 (2.9%)
- Norwegian: 131 (2.3%)
- Polish: 94 (1.6%)
- Russian: 88 (1.5%)
- Scottish: 82 (1.4%)
- French: 73 (1.3%)
- African: 68 (1.2%)
- Romanian: 49 (0.8%)
- Dutch: 47 (0.8%)
- Scandinavian: 42 (0.7%)
- Ukrainian: 34 (0.6%)
- Belgian: 26 (0.5%)
- Danish: 26 (0.5%)
- Scotch-Irish: 19 (0.3%)
- Swedish: 12 (0.2%)
- Welsh: 5 (0.09%)
- Iranian: 1 (0.02%)
Most common places of birth for foreign-born residents (%):
| Branson: | 20.7% (139) |
| Missouri: | 0.2% (463) |
| Branson: | 12.5% (84) |
| Missouri: | 1.5% (3,767) |
| Branson: | 10.3% (69) |
| Missouri: | 4.2% (10,873) |
| Branson: | 10.0% (67) |
| Missouri: | 8.9% (22,932) |
| Branson: | 8.6% (58) |
| Missouri: | 1.0% (2,597) |
| Branson: | 5.8% (39) |
| Missouri: | 6.6% (17,002) |
| Branson: | 5.8% (39) |
| Missouri: | 0.1% (247) |
| Branson: | 4.5% (30) |
| Missouri: | 1.1% (2,895) |
| Branson: | 3.6% (24) |
| Missouri: | 0.5% (1,253) |
| Branson: | 3.6% (24) |
| Missouri: | 14.9% (38,568) |
| Branson: | 3.4% (23) |
| Missouri: | 0.6% (1,481) |
Place of birth for U.S.-born residents:
- This state: 5,997
- Other state: 5,905
- Northeast: 195
- Midwest: 2,284
- South: 1,800
- West: 1,647
79.0% of Branson residents lived in the same house 1 years ago.
Out of people who lived in different houses, 35.5% lived in this county.
Out of people who lived in different counties, 46.6% lived in Missouri.
| Branson: | 79.0% |
| State average: | 87.1% |
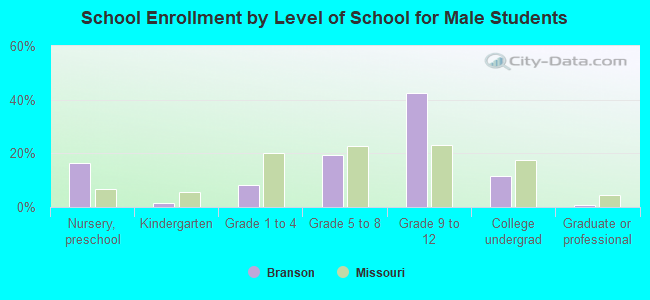
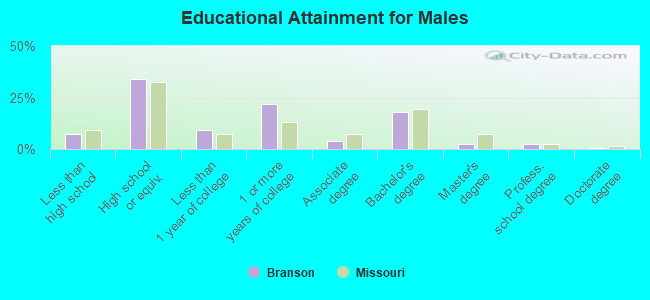
Education attainment for males 25 years and older:
- No schooling: 0
- Nursery to 4th grade: 17
- 5th and 6th grade: 0
- 7th and 8th grade: 2
- 9th grade: 111
- 10th grade: 0
- 11th grade: 14
- 12th grade, no diploma: 140
- High school graduate (or equivalency): 1,307
- Less than 1 year of college: 364
- Some college more than 1 year, no degree: 836
- Associate degree: 156
- Bachelor's degree: 699
- Master's degree: 96
- Professional school degree: 98
- Doctorate degree: 28
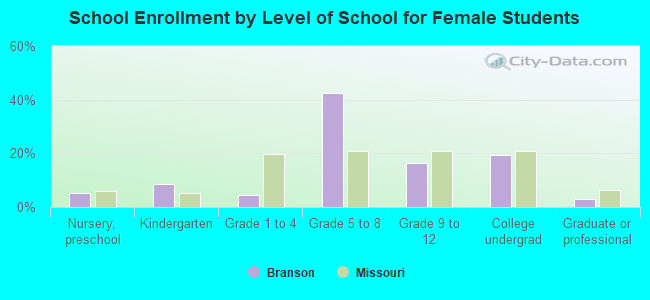
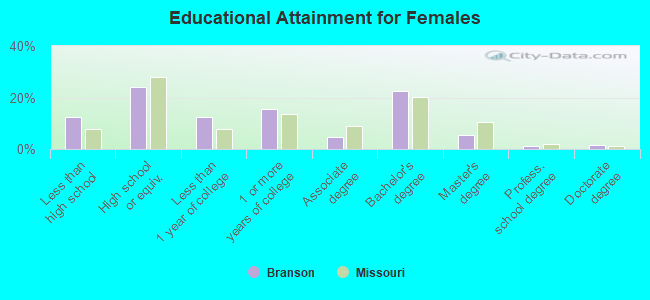
Education attainment for females 25 years and older:
- No schooling: 30
- Nursery to 4th grade: 43
- 5th and 6th grade: 2
- 7th and 8th grade: 90
- 9th grade: 175
- 10th grade: 0
- 11th grade: 93
- 12th grade, no diploma: 227
- High school graduate (or equivalency): 1,260
- Less than 1 year of college: 660
- Some college more than 1 year, no degree: 807
- Associate degree: 254
- Bachelor's degree: 1,194
- Master's degree: 289
- Professional school degree: 60
- Doctorate degree: 76


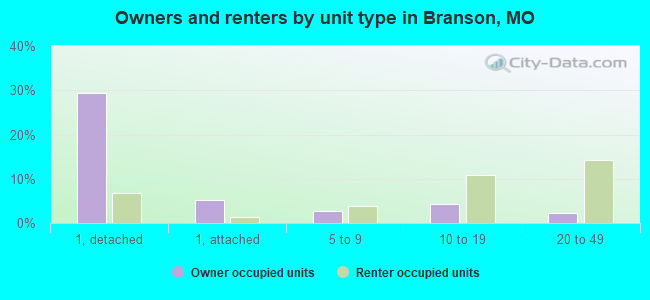
Housing units in structures:
- One, detached: 2,358
- One, attached: 647
- Two: 250
- 3 or 4: 834
- 5 to 9: 973
- 10 to 19: 1,515
- 20 to 49: 1,622
- 50 or more: 431
- Mobile homes: 242
Housing units lacking complete kitchen facilities in 2022: 1.3%
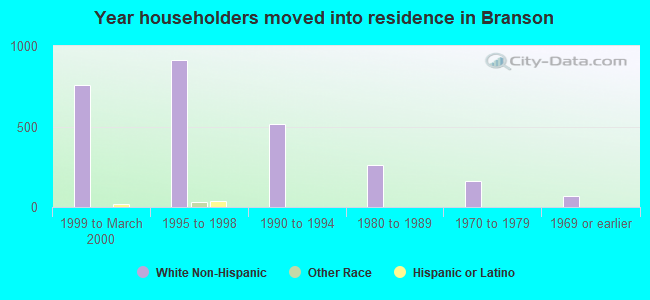
House/condo owner moved in on average 4 years ago
Renter moved in on average 2 years ago
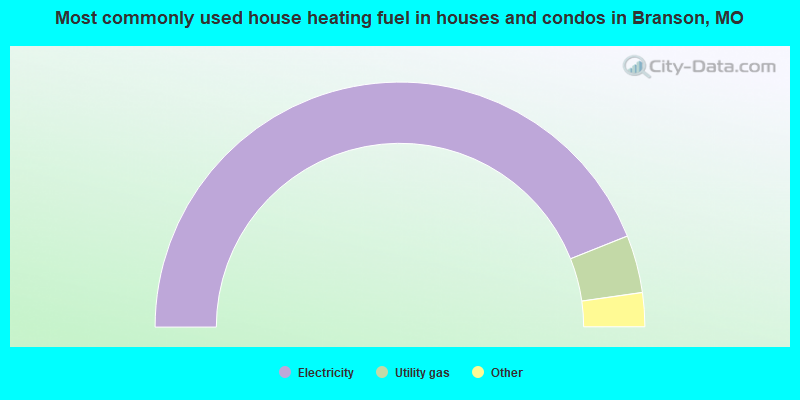
- 88.0%Electricity
- 7.6%Utility gas
- 2.5%Bottled, tank, or LP gas
- 1.2%Wood
- 0.7%No fuel used
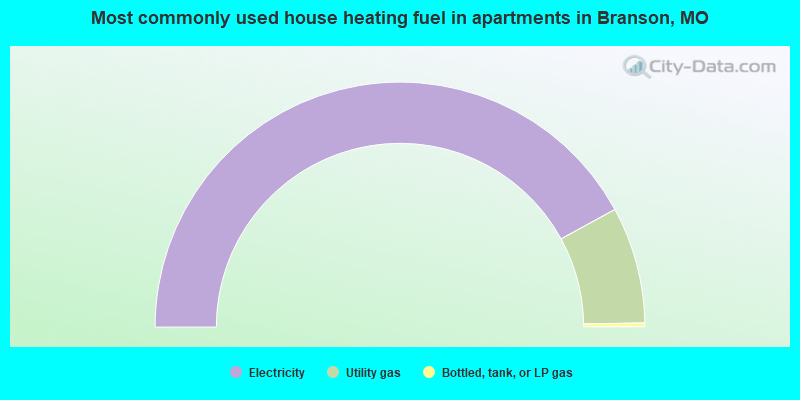
- 84.1%Electricity
- 15.4%Utility gas
- 0.5%Bottled, tank, or LP gas
Private vs. public school enrollment:
| Here: | 9.7% |
| Missouri: | 15.4% |
| Here: | 0.2% |
| Missouri: | 13.9% |
| Here: | 27.2% |
| Missouri: | 22.6% |