Brunswick, MD (Maryland) Houses and Residents
| Brunswick: | $325,239 |
| Maryland: | $398,100 |
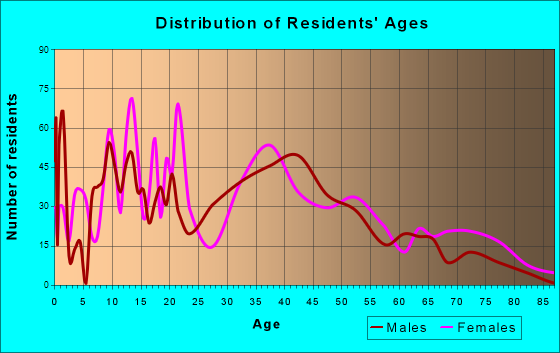
Total population: 6,102 (Urban population: 4,741 (all inside urban clusters), Rural population: 95 (all nonfarm))
Houses: 3,274 (3,156 occupied: 2,628 owner occupied, 540 renter occupied)
| % of renters here: | 17% |
| State: | 32% |
Housing density: 1,555 houses/condos per square mile
Median price asked for vacant for-sale houses and condos in 2022 in this county: $402,870.
Median contract rent in 2022: $909 (lower quartile is $739, upper quartile is $1,148)
Median rent asked for vacant for-rent units in 2022: $1,164
Median gross rent in Brunswick, MD in 2022: $1,084
Housing units in Brunswick with a mortgage: 2,361 (200 second mortgage, 0 home equity loan, 138 both second mortgage and home equity loan)
Houses without a mortgage: 27
Median household income for houses/condos with a mortgage: $119,454
Median household income for apartments without a mortgage: $63,941
Median monthly housing costs: $1,673
Compare current foreclosures near Brunswick, MD:
| Photo | Address | Area | Beds / Baths | Price | Details |
|---|---|---|---|---|---|

|
#1
E G St
Brunswick, MD 21716
|
1,344 sq. feet
|
1 baths 3 beds |
show details | |

|
#2
Greenwood St
Brunswick, MD 21716
|
1,124 sq. feet
|
1 baths - beds |
show details | |

|
#3
9th Ave
Brunswick, MD 21716
|
1,846 sq. feet
|
3 baths - beds |
show details | |

|
#4
Jefferson Pike
Brunswick, MD 21716
|
- sq. feet
|
- baths - beds |
show details | |

|
#5
Long Farm Cir
Brunswick, MD 21716
|
- sq. feet
|
- baths - beds |
show details | |

|
#6
Monocacy Crossing Pkwy
Brunswick, MD 21716
|
- sq. feet
|
- baths - beds |
show details | |

|
#7
Roundhouse Dr
Brunswick, MD 21716
|
- sq. feet
|
- baths - beds |
show details | |

|
#8
E Potomac St
Brunswick, MD 21716
|
- sq. feet
|
- baths - beds |
show details | |

|
#9
Cambria Ter NE
Leesburg, VA 20176
|
1,984 sq. feet
|
2 baths 3 beds |
show details | |

|
#10
Dockside Ct
Frederick, MD 21701
|
1,360 sq. feet
|
1 baths 2 beds |
show details |
| Photo | Address | Area | Beds / Baths | Price | Details |
|---|---|---|---|---|---|

|
#11
Cecily Way
Ranson, WV 25438
|
- sq. feet
|
2 baths 3 beds |
show details | |

|
#12
S Mildred St
Charles Town, WV 25414
|
1,822 sq. feet
|
2 baths 3 beds |
show details | |

|
#13
Colonial Way
Frederick, MD 21702
|
- sq. feet
|
2 baths 4 beds |
show details | |

|
#14
Brookshire Run
Point Of Rocks, MD 21777
|
844 sq. feet
|
2 baths 3 beds |
show details | |

|
#15
Cooper Run St
Lovettsville, VA 20180
|
3,000 sq. feet
|
2 baths 4 beds |
show details | |

|
#16
Harpers Ferry Rd
Sharpsburg, MD 21782
|
1,365 sq. feet
|
1 baths 3 beds |
show details | |

|
#17
Cemetery Cir
Knoxville, MD 21758
|
1,368 sq. feet
|
1 baths 4 beds |
show details | |

|
#18
Carriage Hill Dr
Frederick, MD 21704
|
4,723 sq. feet
|
3 baths - beds |
show details | |

|
#19
Elia Ct SE
Leesburg, VA 20175
|
3,445 sq. feet
|
3 baths 5 beds |
show details | |

|
#20
Kidwell Rd
Purcellville, VA 20132
|
2,500 sq. feet
|
4 baths 3 beds |
show details |
| Photo | Address | Area | Beds / Baths | Price | Details |
|---|---|---|---|---|---|

|
#21
Leesburg Pike
Round Hill, VA 20141
|
2,668 sq. feet
|
2 baths 3 beds |
show details | |

|
#22
Eagle Point Sq
Leesburg, VA 20176
|
3,982 sq. feet
|
3 baths 3 beds |
show details | |

|
#23
Eagle Point Sq
Leesburg, VA 20176
|
3,982 sq. feet
|
3 baths 3 beds |
show details | |

|
#24
Riverpoint Dr
Leesburg, VA 20176
|
5,691 sq. feet
|
4 baths 4 beds |
show details | |

|
#25
Glen Echo Rd
Frederick, MD 21703
|
2,056 sq. feet
|
2 baths - beds |
show details | |

|
#26
Riverpoint Dr
Leesburg, VA 20176
|
6,648 sq. feet
|
5 baths 5 beds |
show details | |

|
#27
Hillcrest Dr
Frederick, MD 21703
|
1,432 sq. feet
|
2 baths - beds |
show details | |

|
#28
Maitland Ter
Frederick, MD 21703
|
3,147 sq. feet
|
2 baths - beds |
show details | |

|
#29
Comstock Dr
Shepherdstown, WV 25443
|
1,096 sq. feet
|
2 baths 3 beds |
show details | |

|
#30
Rocky Ln
Lovettsville, VA 20180
|
3,520 sq. feet
|
4 baths - beds |
show details |
| Photo | Address | Area | Beds / Baths | Price | Details |
|---|---|---|---|---|---|

|
#31
Hunton Pl NE
Leesburg, VA 20176
|
2,553 sq. feet
|
2 baths - beds |
show details | |

|
#32
Silcott Springs Rd
Purcellville, VA 20132
|
2,800 sq. feet
|
3 baths - beds |
show details | |

|
#33
E 9th St
Frederick, MD 21701
|
1,024 sq. feet
|
1 baths - beds |
show details | |

|
#34
Newington Pl NE
Leesburg, VA 20176
|
3,587 sq. feet
|
2 baths - beds |
show details | |

|
#35
Rocky Fountain Ct
Myersville, MD 21773
|
3,328 sq. feet
|
2 baths - beds |
show details | |

|
#36
Buttonwood Ter NE
Leesburg, VA 20176
|
2,356 sq. feet
|
3 baths - beds |
show details | |

|
#37
Rockford Sq NE
Leesburg, VA 20176
|
2,678 sq. feet
|
3 baths - beds |
show details | |

|
#38
Queen St NE
Leesburg, VA 20176
|
1,837 sq. feet
|
2 baths - beds |
show details | |

|
#39
James Monroe Hwy
Leesburg, VA 20176
|
4,899 sq. feet
|
4 baths - beds |
show details | |

|
#40
Alfalfa Ct
Hamilton, VA 20158
|
5,375 sq. feet
|
4 baths - beds |
show details |
| Photo | Address | Area | Beds / Baths | Price | Details |
|---|---|---|---|---|---|

|
#41
Shawnee Dr
Frederick, MD 21701
|
1,630 sq. feet
|
1 baths - beds |
show details | |

|
#42
Misty Hollow Rd
Point Of Rocks, MD 21777
|
3,720 sq. feet
|
2 baths - beds |
show details | |

|
#43
Reels Mill Rd
Frederick, MD 21704
|
1,080 sq. feet
|
1 baths - beds |
show details | |

|
#44
Sprigg St S
Frederick, MD 21704
|
2,160 sq. feet
|
3 baths - beds |
show details | |

|
#45
April Cir
Lovettsville, VA 20180
|
4,727 sq. feet
|
4 baths - beds |
show details | |

|
#46
Sprigg St N
Frederick, MD 21704
|
2,718 sq. feet
|
2 baths - beds |
show details | |

|
#47
Dockside Dr
Frederick, MD 21701
|
1,896 sq. feet
|
3 baths - beds |
show details | |

|
#48
Mobley Ct
Frederick, MD 21701
|
1,360 sq. feet
|
2 baths - beds |
show details | |

|
#49
Smartts Ln NE
Leesburg, VA 20176
|
1,882 sq. feet
|
2 baths - beds |
show details | |

|
Check over 1 million property listings on Foreclosure.com!
|
browse all offers | |||

Latest news about housing in Brunswick, MD collected exclusively by city-data.com from local newspapers, TV, and radio stations

 | Brunswick Crossing, thoughts and cost (8 replies) |
| Downtown Brunswick (3 replies) |
| Young Married Couple Looking To Rent In Brunswick (6 replies) |
| Best places in/around Frederick for buying a house (7 replies) |
| MA to Frederick MD possible relocation (10 replies) |
| thinking of living in Brunswick Crossing... (14 replies) |
Median year apartment built: 1967
Household type by relationship:
Households: 8,157- Male householders: 1,456 (402 living alone), Female householders: 1,707 (474 living alone)
1,617 spouses (1,576 opposite-sex spouses), 279 unmarried partners, (279 opposite-sex unmarried partners), 2,586 children (2,302 natural, 94 adopted, 189 stepchildren), 118 grandchildren, 57 brothers or sisters, 122 parents, 0 foster children, 68 other relatives, 142 non-relatives
Size of family households: 763 2-persons, 458 3-persons, 499 4-persons, 293 5-persons, 75 6-persons, 7 7-or-more-persons.
Size of nonfamily households: 832 1-person, 211 2-persons, 10 4-persons.
1,720 married couples with children.
328 single-parent households (94 men, 234 women).
87.6% of residents of Brunswick speak English at home.
6.5% of residents speak Spanish at home (67% speak English very well, 25% speak English well, 8% speak English not well).
3.1% of residents speak other Indo-European language at home (100% speak English very well).
1.3% of residents speak Asian or Pacific Island language at home (63% speak English very well, 32% speak English well, 5% don't speak English at all).
Foreign born population: 875 (10.7%)
(58.1% of them are naturalized citizens)
| Here: | 6.9 |
| State: | 7.3 |
| Here: | 5.3 |
| State: | 4.2 |

- Bedrooms in owner-occupied houses and condos in Brunswick, Maryland
- 0no bedroom
- 01 bedroom
- 2492 bedrooms
- 1,3453 bedrooms
- 8584 bedrooms
- 1765+ bedrooms

- Bedrooms in renter-occupied apartments in Brunswick, Maryland
- 19no bedroom
- 1001 bedroom
- 1052 bedrooms
- 2523 bedrooms
- 574 bedrooms
- 85+ bedrooms

- Cars and other vehicles available in Brunswick in owner-occupied houses/condos
- 18no vehicle
- 8481 vehicle
- 9982 vehicles
- 4833 vehicles
- 2004 vehicles
- 835+ vehicles

- Cars and other vehicles available in Brunswick in renter-occupied apartments
- 95no vehicle
- 2571 vehicle
- 1612 vehicles
- 03 vehicles
- 284 vehicles
- 05+ vehicles

- Rooms in owner-occupied houses in Brunswick, Maryland
- 01 room
- 02 rooms
- 03 rooms
- 1424 rooms
- 2505 rooms
- 6456 rooms
- 6437 rooms
- 3718 rooms
- 5799+ rooms

- Rooms in renter-occupied apartments in Brunswick, Maryland
- 191 room
- 142 rooms
- 613 rooms
- 784 rooms
- 1245 rooms
- 996 rooms
- 987 rooms
- 248 rooms
- 259+ rooms


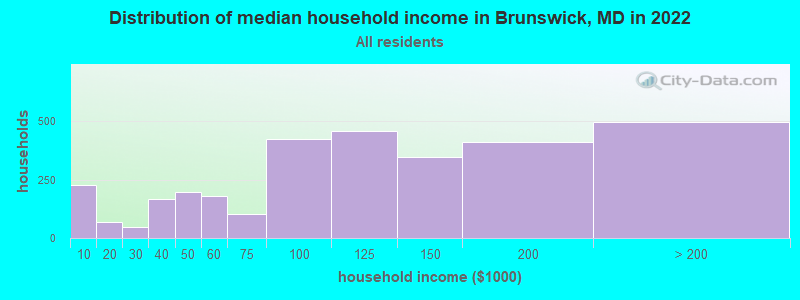
Brunswick, MD household income distribution

- 229Less than $10,000
- 68$10,000 to $19,999
- 48$20,000 to $29,999
- 167$30,000 to $39,999
- 197$40,000 to $49,999
- 182$50,000 to $59,999
- 101$60,000 to $74,999
- 424$75,000 to $99,999
- 459$100,000 to $124,999
- 349$125,000 to $149,999
- 410$150,000 to $199,999
- 497$200,000 or more
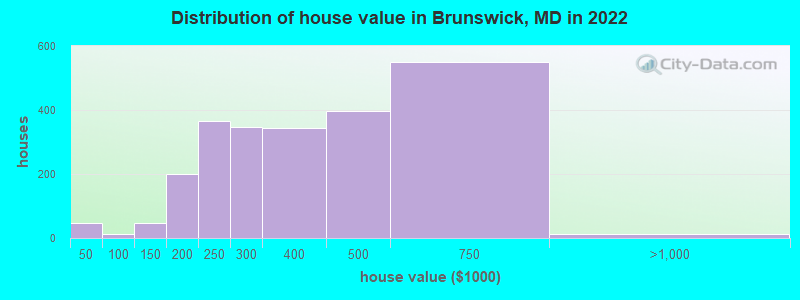
Home value of owner - occupied houses in 2022 in Brunswick, MD
-
- 25Less than $10,000
- 19$25,000 to $29,999
- 7$50,000 to $59,999
- 6$80,000 to $89,999
- 17$100,000 to $124,999
- 30$125,000 to $149,999
- 36$150,000 to $174,999
- 162$175,000 to $199,999
- 366$200,000 to $249,999
- 347$250,000 to $299,999
- 344$300,000 to $399,999
- 395$400,000 to $499,999
- 549$500,000 to $749,999
- 12$750,000 to $999,999
Rent paid by renters in 2022 in Brunswick, MD
-
- 7$200 to $249
- 14$250 to $299
- 10$350 to $399
- 15$400 to $449
- 14$450 to $499
- 8$650 to $699
- 125$700 to $749
- 36$750 to $799
- 102$800 to $899
- 60$900 to $999
- 18$1,000 to $1,249
- 43$1,250 to $1,499
- 64$1,500 to $1,999
- 9No cash rent


Percentage of workers working in this county: 53.5%
Number of people working at home: 927 (20.3% of all workers)
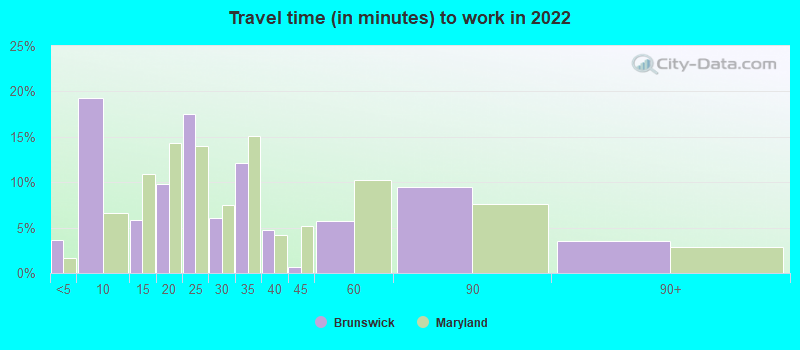
Travel time to work (commute)
- Less than 5 minutes: 66
- 5 to 9 minutes: 226
- 10 to 14 minutes: 153
- 15 to 19 minutes: 177
- 20 to 24 minutes: 466
- 25 to 29 minutes: 144
- 30 to 34 minutes: 675
- 35 to 39 minutes: 95
- 40 to 44 minutes: 50
- 45 to 59 minutes: 438
- 60 to 89 minutes: 878
- 90 or more minutes: 162
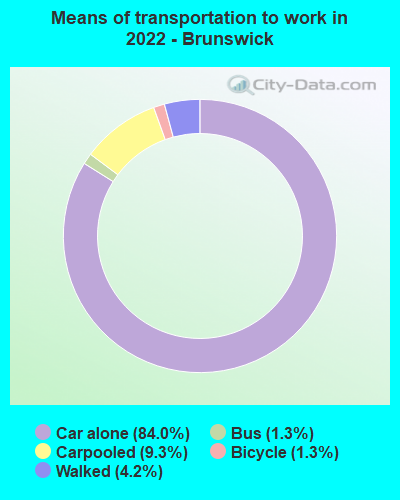
Means of transportation to work:
- Drove a car alone: 919 (48.8%)
- Carpooled: 111 (5.9%)
- Bus: 6 (0.3%)
- Bicycle: 28 (1.5%)
- Walked: 35 (1.9%)
- Worked at home: 927 (49.2%)

- Unemployment by race in 2022
- Unemployment rate for White non-Hispanic residents
- 0.7%Males
- 5.7%Females
- Unemployment rate for Black residents
- 5.1%Males
- 23.6%Females
- Unemployment rate for two or more race residents
- 6.6%Males
- 6.9%Females
- Unemployment rate for Hispanic or Latino residents
- 24.4%Females

- Year of entry for the foreign-born population in Brunswick, Maryland
- 2312010 or later
- 3632000 to 2009
- 2151990 to 1999
- 251980 to 1989
- 101970 to 1979
- 22Before 1970

First ancestries reported:
- German: 597 (16.6%)
- English: 511 (14.2%)
- American: 372 (10.3%)
- Irish: 288 (8.0%)
- Polish: 105 (2.9%)
- Italian: 93 (2.6%)
- European: 56 (1.6%)
- African: 54 (1.5%)
- Scotch-Irish: 41 (1.1%)
- Romanian: 34 (0.9%)
- French: 33 (0.9%)
- Scottish: 30 (0.8%)
- Russian: 24 (0.7%)
- Eastern European: 19 (0.5%)
- Dutch: 18 (0.5%)
- Czech: 13 (0.4%)
- Armenian: 12 (0.3%)
- French Canadian: 12 (0.3%)
- Swiss: 11 (0.3%)
- Haitian: 11 (0.3%)
- Greek: 10 (0.3%)
Most common places of birth for foreign-born residents (%):
| Brunswick: | 18.6% (142) |
| Maryland: | 12.0% (115,412) |
| Brunswick: | 8.8% (67) |
| Maryland: | 0.2% (2,108) |
| Brunswick: | 8.8% (67) |
| Maryland: | 1.8% (17,161) |
| Brunswick: | 6.5% (50) |
| Maryland: | 2.5% (23,969) |
| Brunswick: | 6.4% (49) |
| Maryland: | 4.4% (42,350) |
| Brunswick: | 5.9% (45) |
| Maryland: | 3.4% (32,635) |
| Brunswick: | 5.5% (42) |
| Maryland: | 0.1% (494) |
| Brunswick: | 4.1% (31) |
| Maryland: | 1.2% (11,481) |
| Brunswick: | 3.4% (26) |
| Maryland: | 0.3% (3,199) |
| Brunswick: | 2.6% (20) |
| Maryland: | 0.9% (9,100) |
| Brunswick: | 2.4% (18) |
| Maryland: | 0.7% (6,724) |
| Brunswick: | 2.2% (17) |
| Maryland: | 0.2% (1,581) |
| Brunswick: | 2.2% (17) |
| Maryland: | 6.4% (61,725) |
| Brunswick: | 2.0% (15) |
| Maryland: | 4.6% (44,742) |
| Brunswick: | 1.8% (14) |
| Maryland: | 1.2% (11,265) |
| Brunswick: | 1.8% (14) |
| Maryland: | 0.3% (3,203) |
| Brunswick: | 1.7% (13) |
| Maryland: | 1.9% (18,716) |
| Brunswick: | 1.7% (13) |
| Maryland: | 0.2% (1,463) |
Place of birth for U.S.-born residents:
- This state: 3,748
- Other state: 3,347
- Northeast: 902
- Midwest: 311
- South: 1,794
- West: 326
90.0% of Brunswick residents lived in the same house 1 years ago.
Out of people who lived in different houses, 19.1% lived in this county.
Out of people who lived in different counties, 41.9% lived in Maryland.
| Brunswick: | 90.0% |
| State average: | 88.5% |
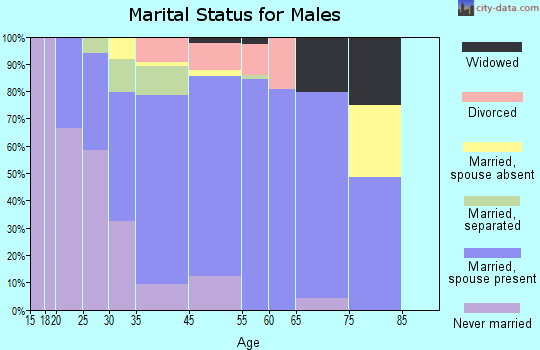
Education attainment for males 25 years and older:
- No schooling: 8
- Nursery to 4th grade: 0
- 5th and 6th grade: 0
- 7th and 8th grade: 17
- 9th grade: 19
- 10th grade: 13
- 11th grade: 63
- 12th grade, no diploma: 70
- High school graduate (or equivalency): 738
- Less than 1 year of college: 160
- Some college more than 1 year, no degree: 375
- Associate degree: 268
- Bachelor's degree: 563
- Master's degree: 253
- Professional school degree: 14
- Doctorate degree: 89

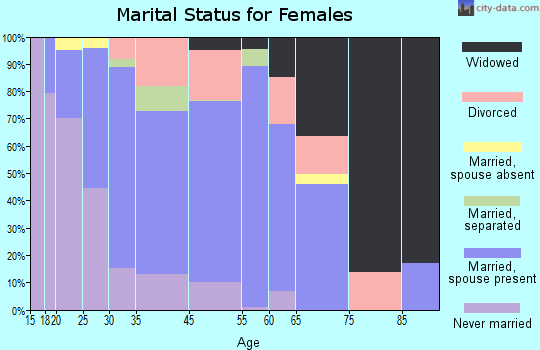
Education attainment for females 25 years and older:
- No schooling: 25
- Nursery to 4th grade: 0
- 5th and 6th grade: 12
- 7th and 8th grade: 4
- 9th grade: 51
- 10th grade: 25
- 11th grade: 61
- 12th grade, no diploma: 6
- High school graduate (or equivalency): 787
- Less than 1 year of college: 165
- Some college more than 1 year, no degree: 336
- Associate degree: 176
- Bachelor's degree: 617
- Master's degree: 377
- Professional school degree: 70
- Doctorate degree: 11

Housing units in structures:
- One, detached: 2,192
- One, attached: 736
- Two: 26
- 3 or 4: 140
- 5 to 9: 93
- 20 to 49: 36
- 50 or more: 39
- Mobile homes: 10
House/condo owner moved in on average 6 years ago
Renter moved in on average 4 years ago

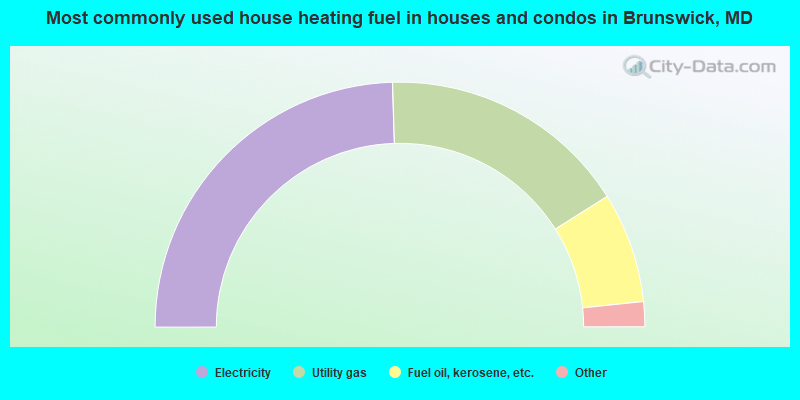
- 49.1%Electricity
- 33.1%Utility gas
- 14.6%Fuel oil, kerosene, etc.
- 2.2%Bottled, tank, or LP gas
- 0.7%Wood
- 0.3%Coal or coke
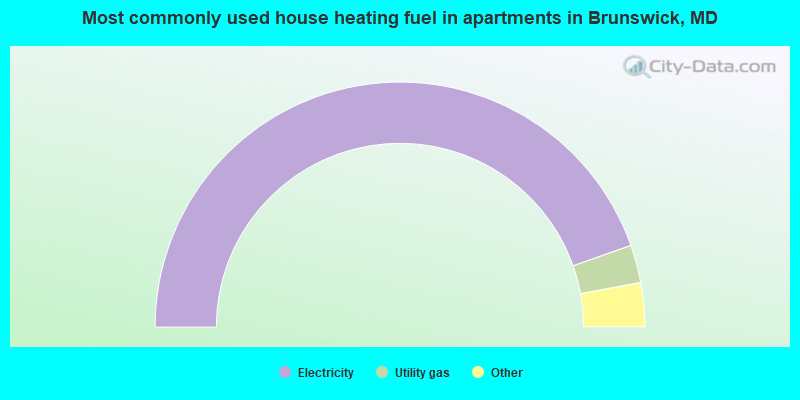
- 89.3%Electricity
- 5.0%Utility gas
- 3.7%Fuel oil, kerosene, etc.
- 1.9%No fuel used
Private vs. public school enrollment:
| Here: | 14.9% |
| Maryland: | 15.2% |
| Here: | 16.6% |
| Maryland: | 14.4% |
| Here: | 26.0% |
| Maryland: | 20.2% |


