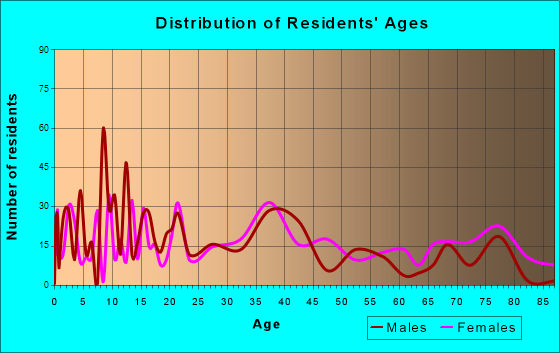
Buffalo, MO (Missouri) Houses and Residents
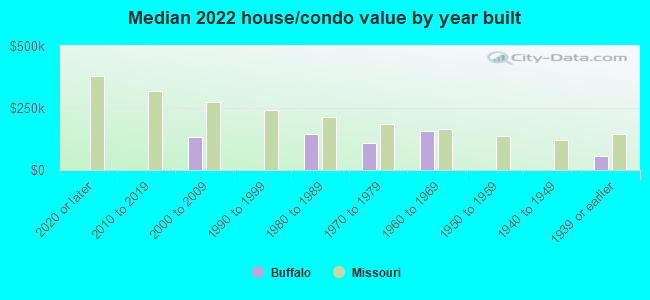
| Buffalo: | $108,270 |
| Missouri: | $221,200 |
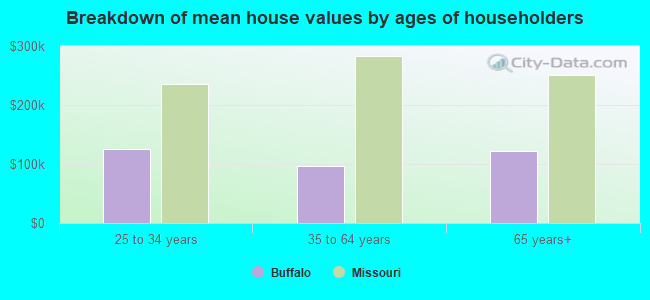
Mean price in 2022:
Detached houses: $150,994
Here: $150,994 State: $278,068
Total population: 3,039 (Urban population: 2,592 (all inside urban clusters), Rural population: 142 (all nonfarm))
Houses: 1,675 (1,455 occupied: 571 owner occupied, 904 renter occupied)
| % of renters here: | 61% |
| State: | 32% |
Housing density: 762 houses/condos per square mile
Median price asked for vacant for-sale houses and condos in 2022 in this county: $263,295.
Median contract rent in 2022: $427 (lower quartile is $361, upper quartile is $515)
Median rent asked for vacant for-rent units in 2022: $1,186
Median gross rent in Buffalo, MO in 2022: $585
Housing units in Buffalo with a mortgage: 305 (8 second mortgage, 0 home equity loan, 8 both second mortgage and home equity loan)
Houses without a mortgage: 0
Median household income for houses/condos with a mortgage: $55,364
Median household income for apartments without a mortgage: $28,909
Median monthly housing costs: $590
Compare current foreclosures near Buffalo, MO:
| Photo | Address | Area | Beds / Baths | Price | Details |
|---|---|---|---|---|---|

|
#1
State Hwy 32
Buffalo, MO 65622
|
- sq. feet
|
2 baths 3 beds |
$69,900
|
show details |

|
#2
Imperial Dr
Buffalo, MO 65622
|
640 sq. feet
|
1 baths 1 beds |
show details | |

|
#3
W Mill St
Buffalo, MO 65622
|
944 sq. feet
|
1 baths - beds |
show details | |

|
#4
E Main St
Buffalo, MO 65622
|
- sq. feet
|
- baths - beds |
show details | |

|
#5
W Commercial St
Buffalo, MO 65622
|
- sq. feet
|
- baths - beds |
show details | |

|
#6
Dawn Dr
Buffalo, MO 65622
|
- sq. feet
|
- baths - beds |
show details | |

|
#7
Round Prairie Rd
Louisburg, MO 65685
|
1,680 sq. feet
|
2 baths 3 beds |
$347,750
|
show details |

|
#8
Oak Ridge Rd
Buffalo, MO 65622
|
- sq. feet
|
- baths - beds |
show details | |

|
#9
W Stanley St
Buffalo, MO 65622
|
- sq. feet
|
- baths - beds |
show details | |

|
#10
S Oak St
Buffalo, MO 65622
|
- sq. feet
|
- baths - beds |
show details |
| Photo | Address | Area | Beds / Baths | Price | Details |
|---|---|---|---|---|---|

|
#11
Ridgeview Rd
Pleasant Hope, MO 65725
|
1,431 sq. feet
|
3 baths 3 beds |
show details | |

|
#12
Highway 32
Bolivar, MO 65613
|
- sq. feet
|
2 baths 3 beds |
show details | |

|
#13
S Gary Ave
Bolivar, MO 65613
|
1,883 sq. feet
|
2 baths 3 beds |
show details | |

|
#14
State Road K
Long Lane, MO 65590
|
- sq. feet
|
- baths - beds |
show details | |

|
#15
S 240th Rd
Half Way, MO 65663
|
- sq. feet
|
- baths - beds |
show details | |

|
#16
Elkland Rd
Elkland, MO 65644
|
- sq. feet
|
- baths - beds |
show details | |

|
#17
State Highway 38
Elkland, MO 65644
|
- sq. feet
|
- baths - beds |
show details | |

|
#18
Highway 64
Lebanon, MO 65536
|
- sq. feet
|
- baths - beds |
show details | |

|
#19
E 430th Rd
Bolivar, MO 65613
|
- sq. feet
|
- baths - beds |
show details | |

|
#20
Cheyenne Rd
Tunas, MO 65764
|
- sq. feet
|
- baths - beds |
show details |
| Photo | Address | Area | Beds / Baths | Price | Details |
|---|---|---|---|---|---|

|
#21
E 497th Rd
Bolivar, MO 65613
|
- sq. feet
|
- baths - beds |
show details | |

|
#22
Chicago Rd
Elkland, MO 65644
|
- sq. feet
|
- baths - beds |
show details | |

|
#23
S 188th Rd
Pleasant Hope, MO 65725
|
- sq. feet
|
- baths - beds |
show details | |

|
#24
Triple C Ln
Tunas, MO 65764
|
- sq. feet
|
- baths - beds |
show details | |

|
Check over 1 million property listings on Foreclosure.com!
|
browse all offers | |||

Latest news about housing in Buffalo, MO collected exclusively by city-data.com from local newspapers, TV, and radio stations

 | Internet Providers 65622 Buffalo Fair Grove Area (2 replies) |
| Rural areas around Springfield (16 replies) |
| What is living in SW MO like? (27 replies) |
| Young family considering a move to a town nearby (7 replies) |
| Moved to Buffalo, MO (8 replies) |
| No one warned me about the hills! (35 replies) |
Median year apartment built: 1971
Household type by relationship:
Households: 3,331- Male householders: 368 (153 living alone), Female householders: 1,076 (421 living alone)
412 spouses (412 opposite-sex spouses), 72 unmarried partners, (72 opposite-sex unmarried partners), 751 children (657 natural, 94 adopted, 0 stepchildren), 308 grandchildren, 44 brothers or sisters, 0 parents, 0 foster children, 95 other relatives, 0 non-relatives
- In group quarters: 202
Size of family households: 476 2-persons, 116 3-persons, 145 4-persons, 81 5-persons.
Size of nonfamily households: 595 1-person, 61 2-persons.
216 married couples with children.
201 single-parent households (18 men, 183 women).
96.6% of residents of Buffalo speak English at home.
2.4% of residents speak Spanish at home (100% speak English very well).
0.7% of residents speak other language at home (100% speak English very well).
Foreign born population: 114 (3.4%)
(100.9% of them are naturalized citizens)
| Here: | 5.2 |
| State: | 6.4 |
| Here: | 4.1 |
| State: | 4.4 |
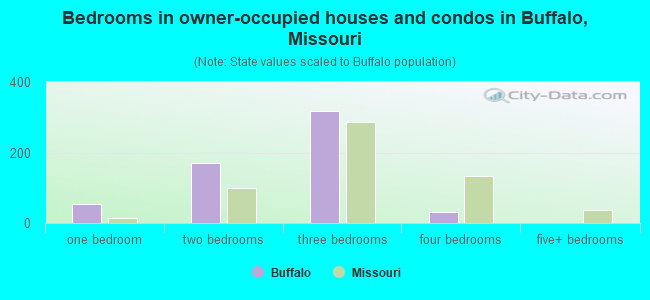
- Bedrooms in owner-occupied houses and condos in Buffalo, Missouri
- 0no bedroom
- 531 bedroom
- 1692 bedrooms
- 3183 bedrooms
- 314 bedrooms
- 05+ bedrooms
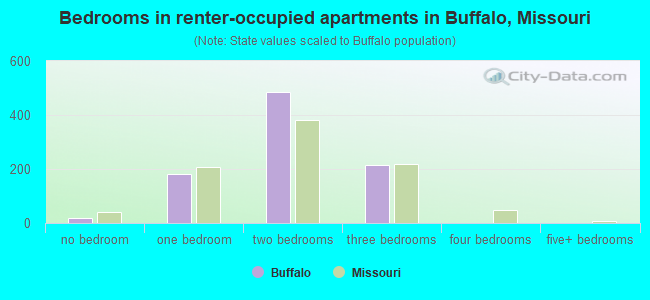
- Bedrooms in renter-occupied apartments in Buffalo, Missouri
- 19no bedroom
- 1831 bedroom
- 4862 bedrooms
- 2163 bedrooms
- 04 bedrooms
- 05+ bedrooms
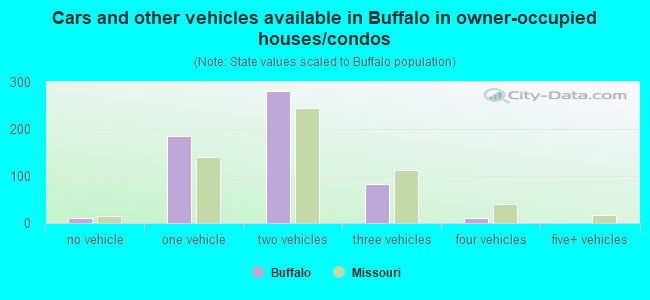
- Cars and other vehicles available in Buffalo in owner-occupied houses/condos
- 10no vehicle
- 1861 vehicle
- 2812 vehicles
- 843 vehicles
- 104 vehicles
- 05+ vehicles
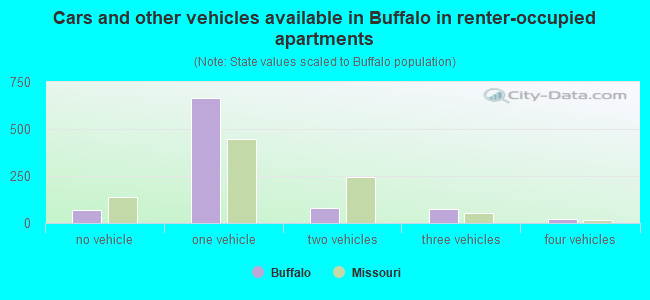
- Cars and other vehicles available in Buffalo in renter-occupied apartments
- 70no vehicle
- 6641 vehicle
- 782 vehicles
- 733 vehicles
- 214 vehicles
- 05+ vehicles
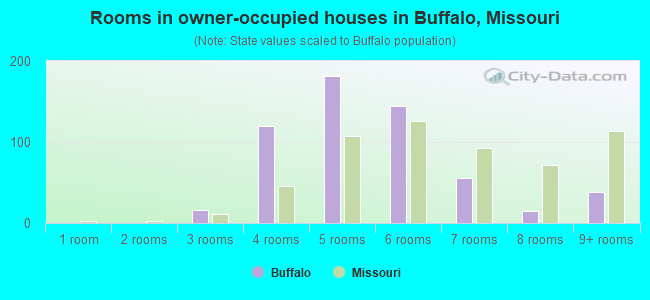
- Rooms in owner-occupied houses in Buffalo, Missouri
- 01 room
- 02 rooms
- 163 rooms
- 1204 rooms
- 1815 rooms
- 1456 rooms
- 567 rooms
- 158 rooms
- 389+ rooms
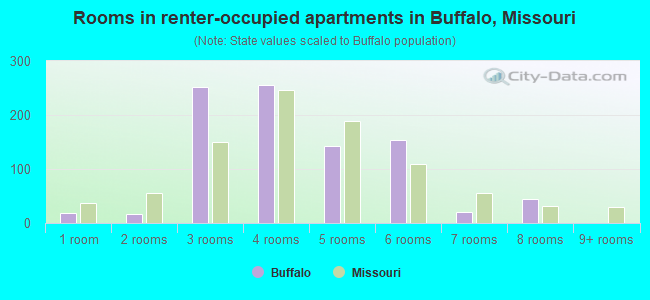
- Rooms in renter-occupied apartments in Buffalo, Missouri
- 191 room
- 162 rooms
- 2523 rooms
- 2564 rooms
- 1435 rooms
- 1536 rooms
- 217 rooms
- 448 rooms
- 09+ rooms
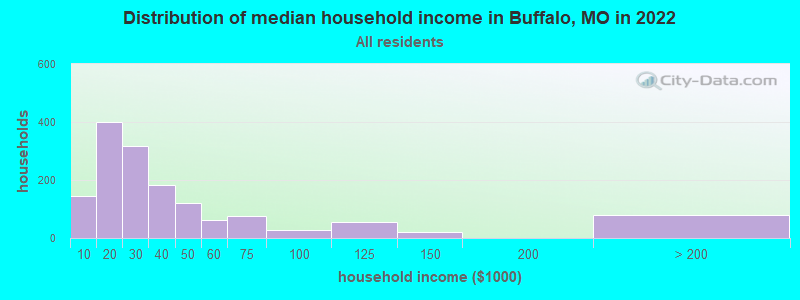
Buffalo, MO household income distribution

- 145Less than $10,000
- 401$10,000 to $19,999
- 318$20,000 to $29,999
- 184$30,000 to $39,999
- 119$40,000 to $49,999
- 61$50,000 to $59,999
- 75$60,000 to $74,999
- 27$75,000 to $99,999
- 55$100,000 to $124,999
- 22$125,000 to $149,999
- 78$200,000 or more
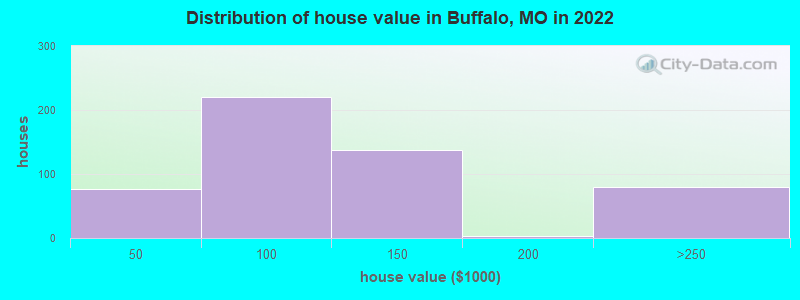
Home value of owner - occupied houses in 2022 in Buffalo, MO
-
- 14Less than $10,000
- 20$15,000 to $19,999
- 13$30,000 to $34,999
- 27$40,000 to $49,999
- 27$50,000 to $59,999
- 91$60,000 to $69,999
- 10$80,000 to $89,999
- 63$90,000 to $99,999
- 26$100,000 to $124,999
- 111$125,000 to $149,999
- 2$175,000 to $199,999
- 78$200,000 to $249,999
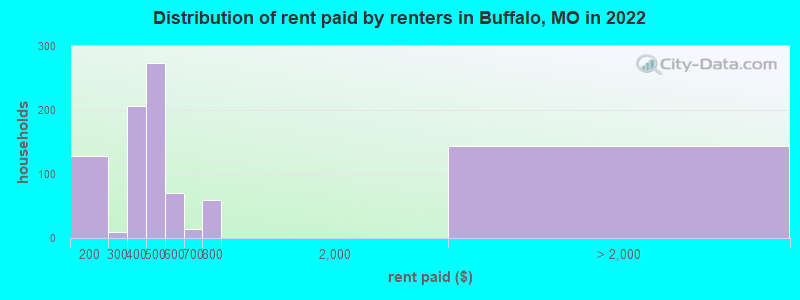
Rent paid by renters in 2022 in Buffalo, MO
-
- 128$100 to $149
- 9$200 to $249
- 206$350 to $399
- 163$400 to $449
- 109$450 to $499
- 18$500 to $549
- 52$550 to $599
- 13$650 to $699
- 40$700 to $749
- 19$750 to $799
- 143No cash rent
Percentage of workers working in this county: 45.1%
Number of people working at home: 114 (10.2% of all workers)
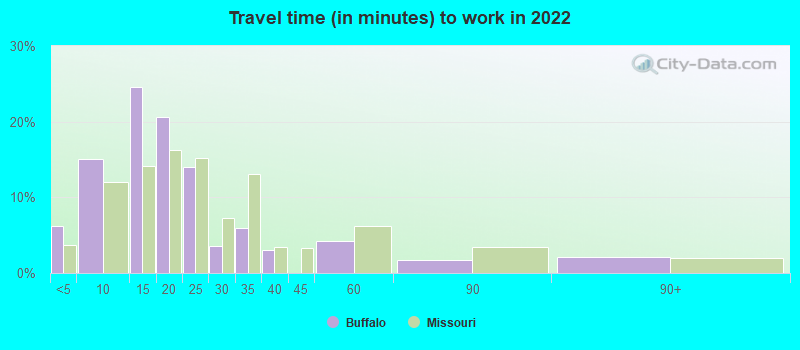
Travel time to work (commute)
- Less than 5 minutes: 101
- 5 to 9 minutes: 133
- 10 to 14 minutes: 67
- 15 to 19 minutes: 104
- 20 to 24 minutes: 57
- 25 to 29 minutes: 0
- 30 to 34 minutes: 184
- 35 to 39 minutes: 112
- 40 to 44 minutes: 91
- 45 to 59 minutes: 48
- 60 to 89 minutes: 59
- 90 or more minutes: 32
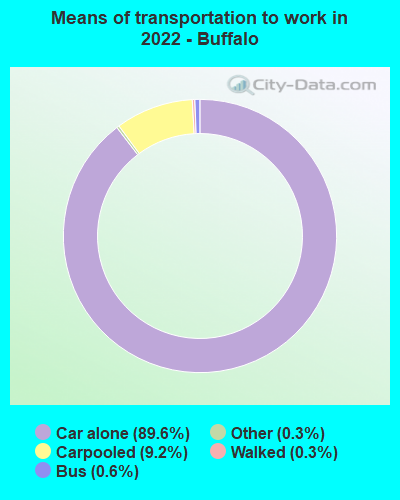
Means of transportation to work:
- Drove a car alone: 1,620 (82.8%)
- Carpooled: 168 (8.6%)
- Bus: 9 (0.5%)
- Taxi: 5 (0.3%)
- Walked: 5 (0.3%)
- Worked at home: 114 (5.8%)
- Unemployment by race in 2022
- Unemployment rate for White non-Hispanic residents
- 6.6%Males
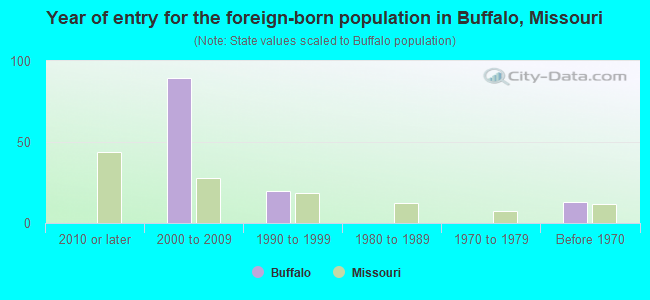
- Year of entry for the foreign-born population in Buffalo, Missouri
- 02010 or later
- 902000 to 2009
- 201990 to 1999
- 01980 to 1989
- 01970 to 1979
- 13Before 1970
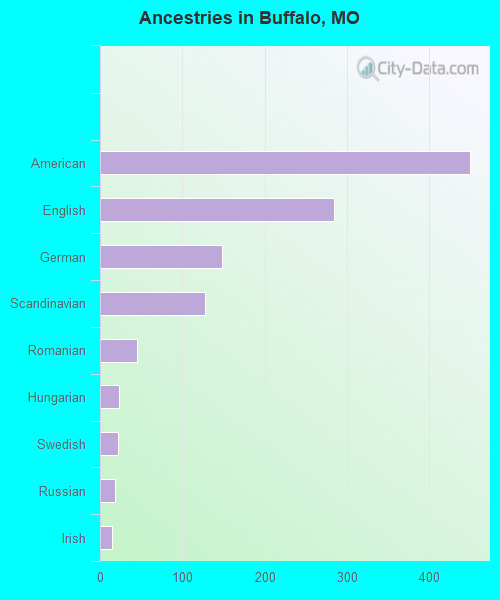
First ancestries reported:
- American: 450 (24.8%)
- English: 284 (15.7%)
- German: 148 (8.2%)
- Scandinavian: 127 (7.0%)
- Romanian: 45 (2.5%)
- Hungarian: 23 (1.3%)
- Swedish: 22 (1.2%)
- Russian: 18 (1.0%)
- Irish: 15 (0.8%)
- Serbian: 4 (0.2%)
Most common places of birth for foreign-born residents (%):
| Buffalo: | 58.8% (67) |
| Missouri: | 0.6% (1,481) |
| Buffalo: | 32.5% (37) |
| Missouri: | 1.5% (3,767) |
| Buffalo: | 18.4% (21) |
| Missouri: | 0.2% (472) |
Place of birth for U.S.-born residents:
- This state: 2,122
- Other state: 1,079
- Northeast: 19
- Midwest: 330
- South: 244
- West: 497
93.5% of Buffalo residents lived in the same house 1 years ago.
Out of people who lived in different houses, 23.0% lived in this county.
Out of people who lived in different counties, 85.4% lived in Missouri.
| Buffalo: | 93.5% |
| State average: | 87.1% |
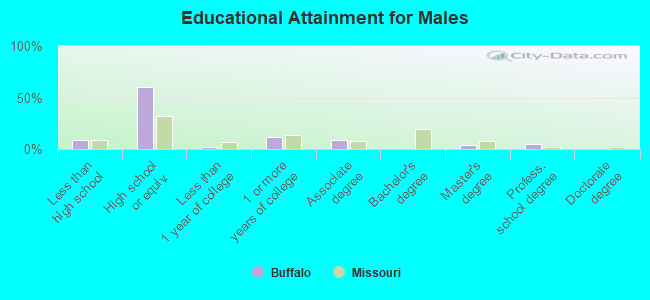
Education attainment for males 25 years and older:
- No schooling: 0
- Nursery to 4th grade: 0
- 5th and 6th grade: 0
- 7th and 8th grade: 30
- 9th grade: 26
- 10th grade: 10
- 11th grade: 0
- 12th grade, no diploma: 0
- High school graduate (or equivalency): 474
- Less than 1 year of college: 12
- Some college more than 1 year, no degree: 94
- Associate degree: 68
- Bachelor's degree: 0
- Master's degree: 27
- Professional school degree: 41
- Doctorate degree: 0
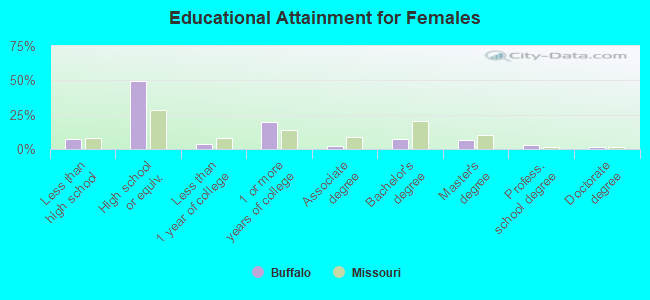
Education attainment for females 25 years and older:
- No schooling: 18
- Nursery to 4th grade: 0
- 5th and 6th grade: 7
- 7th and 8th grade: 51
- 9th grade: 18
- 10th grade: 5
- 11th grade: 0
- 12th grade, no diploma: 12
- High school graduate (or equivalency): 753
- Less than 1 year of college: 60
- Some college more than 1 year, no degree: 301
- Associate degree: 31
- Bachelor's degree: 106
- Master's degree: 98
- Professional school degree: 47
- Doctorate degree: 21
Housing units in structures:
- One, detached: 1,149
- One, attached: 16
- Two: 148
- 3 or 4: 208
- 5 to 9: 77
- 10 to 19: 19
- Mobile homes: 55
Housing units lacking complete kitchen facilities in 2022: 6.3%
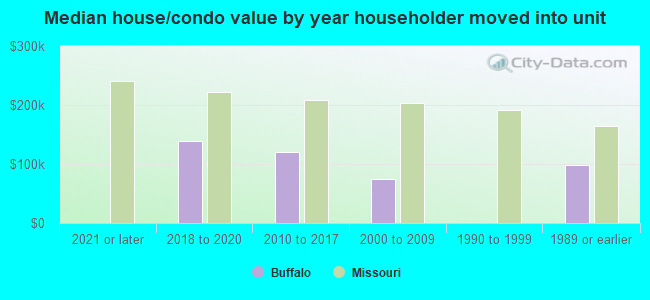
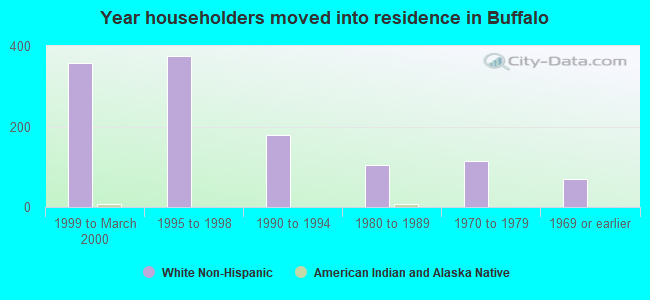
House/condo owner moved in on average 13 years ago
Renter moved in on average 6 years ago
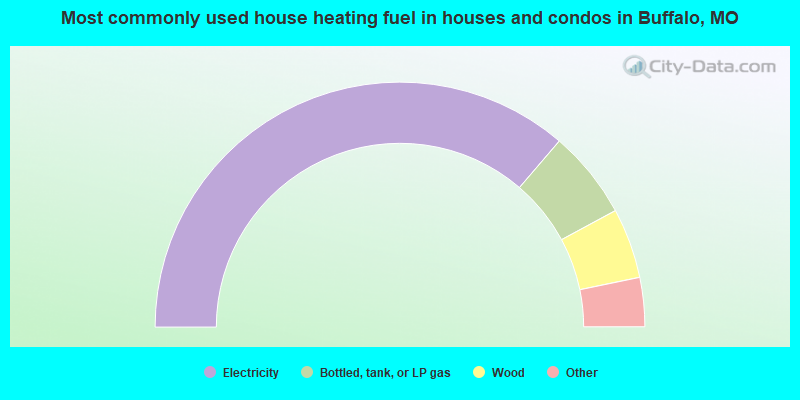
- 72.7%Electricity
- 11.7%Bottled, tank, or LP gas
- 9.3%Wood
- 3.4%Utility gas
- 2.9%Other fuel
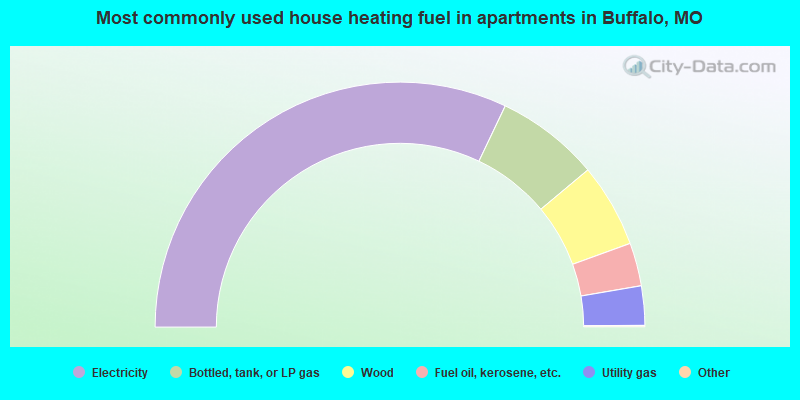
- 64.3%Electricity
- 13.7%Bottled, tank, or LP gas
- 11.1%Wood
- 5.7%Fuel oil, kerosene, etc.
- 5.2%Utility gas
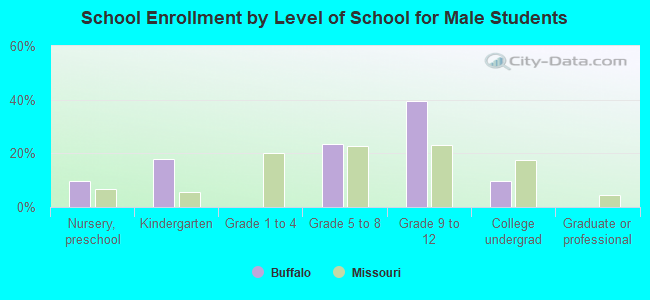
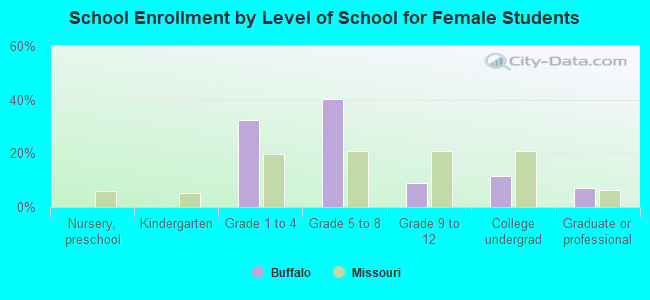
Private vs. public school enrollment:
| Here: | 0.0% |
| Missouri: | 15.4% |
| Here: | 0.0% |
| Missouri: | 13.9% |
| Here: | 50.8% |
| Missouri: | 22.6% |