Cabool, MO (Missouri) Houses and Residents
| Cabool: | $108,270 |
| Missouri: | $221,200 |
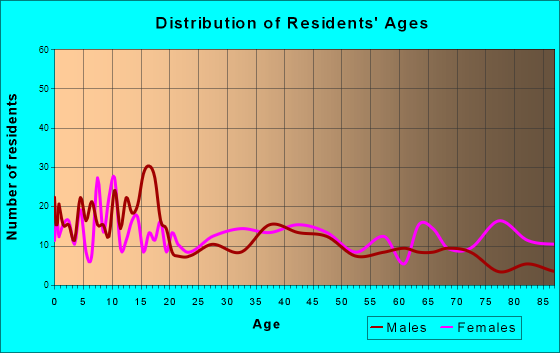
Total population: 2,126 (Urban population: 0, Rural population: 2,190 (19 farm, 2,171 nonfarm))
Houses: 1,061 (995 occupied: 600 owner occupied, 409 renter occupied)
| % of renters here: | 41% |
| State: | 32% |
Housing density: 286 houses/condos per square mile
Median price asked for vacant for-sale houses and condos in 2022 in this county: $156,334.
Median contract rent in 2022: $381 (lower quartile is $275, upper quartile is $557)
Median rent asked for vacant for-rent units in 2022: $1,928
Median gross rent in Cabool, MO in 2022: $605
Housing units in Cabool with a mortgage: 289 (14 second mortgage, 0 home equity loan, 0 both second mortgage and home equity loan)
Houses without a mortgage: 0
Median household income for houses/condos with a mortgage: $69,234
Median household income for apartments without a mortgage: $34,087
Median monthly housing costs: $560
Compare current foreclosures near Cabool, MO:
| Photo | Address | Area | Beds / Baths | Price | Details |
|---|---|---|---|---|---|

|
#1
Parkway Dr # B
Cabool, MO 65689
|
- sq. feet
|
- baths - beds |
show details | |

|
#2
Stave Mill Rd
Cabool, MO 65689
|
- sq. feet
|
- baths - beds |
show details | |

|
#3
State Route Am
Cabool, MO 65689
|
- sq. feet
|
- baths - beds |
show details | |

|
#4
Pleasant Rd
Cabool, MO 65689
|
- sq. feet
|
- baths - beds |
show details | |

|
#5
Cleveland Rd
Houston, MO 65483
|
1,112 sq. feet
|
2 baths 3 beds |
show details | |

|
#6
W Scott St
Mountain Grove, MO 65711
|
1 sq. feet
|
2 baths 3 beds |
show details | |

|
#7
N Maple Ave
Mountain Grove, MO 65711
|
- sq. feet
|
- baths - beds |
show details | |

|
#8
Little Creek Rd
Mountain Grove, MO 65711
|
- sq. feet
|
- baths - beds |
show details | |

|
#9
Timberline Rd
Willow Springs, MO 65793
|
- sq. feet
|
- baths - beds |
show details | |

|
#10
County Road 3780
Willow Springs, MO 65793
|
- sq. feet
|
- baths - beds |
show details |
| Photo | Address | Area | Beds / Baths | Price | Details |
|---|---|---|---|---|---|

|
#11
1 151d
Willow Springs, MO 65793
|
- sq. feet
|
- baths - beds |
show details | |

|
#12
Park St
Willow Springs, MO 65793
|
- sq. feet
|
- baths - beds |
show details | |

|
#13
Sunshine Dr
Mountain Grove, MO 65711
|
- sq. feet
|
- baths - beds |
show details | |

|
#14
S Elm St
Mountain Grove, MO 65711
|
- sq. feet
|
- baths - beds |
show details | |

|
#15
S Lake St
Mountain Grove, MO 65711
|
- sq. feet
|
- baths - beds |
show details | |

|
#16
S High St
Mountain Grove, MO 65711
|
- sq. feet
|
- baths - beds |
show details | |

|
#17
Us Highway 60
Willow Springs, MO 65793
|
- sq. feet
|
- baths - beds |
show details | |

|
#18
Lone Pine Rd
Houston, MO 65483
|
- sq. feet
|
- baths - beds |
show details | |

|
Check over 1 million property listings on Foreclosure.com!
|
browse all offers | |||

Latest news about housing in Cabool, MO collected exclusively by city-data.com from local newspapers, TV, and radio stations

 | ISP in rural areas near Mansfield, Cabool, Mt. Grove (5 replies) |
| Moving to Springfield, MO and now I'm getting scared! (150 replies) |
| Missouri Outlaw History (3407 replies) |
| Interesting Missouri facts. (1186 replies) |
| would we fit in Springfield, MO??? (35 replies) |
| Rate these cities in missouri from MOST southern feeling to least southern feeling (116 replies) |
Median year apartment built: 1978
Household type by relationship:
Households: 2,552- Male householders: 383 (103 living alone), Female householders: 604 (237 living alone)
448 spouses (448 opposite-sex spouses), 59 unmarried partners, (55 opposite-sex unmarried partners), 785 children (699 natural, 18 adopted, 68 stepchildren), 57 grandchildren, 4 brothers or sisters, 19 parents, 0 foster children, 46 other relatives, 39 non-relatives
- In group quarters: 105
Size of family households: 283 2-persons, 168 3-persons, 98 4-persons, 26 5-persons, 45 6-persons.
Size of nonfamily households: 353 1-person, 34 2-persons.
411 married couples with children.
230 single-parent households (59 men, 171 women).
95.5% of residents of Cabool speak English at home.
4.3% of residents speak Spanish at home (100% speak English very well).
0.3% of residents speak Asian or Pacific Island language at home (67% speak English well, 33% speak English not well).
Foreign born population: 92 (3.6%)
(101.1% of them are naturalized citizens)
| Here: | 6.8 |
| State: | 6.4 |
| Here: | 4.5 |
| State: | 4.4 |

- Bedrooms in owner-occupied houses and condos in Cabool, Missouri
- 0no bedroom
- 61 bedroom
- 1322 bedrooms
- 3043 bedrooms
- 1504 bedrooms
- 85+ bedrooms

- Bedrooms in renter-occupied apartments in Cabool, Missouri
- 32no bedroom
- 1251 bedroom
- 1492 bedrooms
- 933 bedrooms
- 104 bedrooms
- 05+ bedrooms

- Cars and other vehicles available in Cabool in owner-occupied houses/condos
- 77no vehicle
- 1321 vehicle
- 2472 vehicles
- 1073 vehicles
- 374 vehicles
- 05+ vehicles

- Cars and other vehicles available in Cabool in renter-occupied apartments
- 83no vehicle
- 1601 vehicle
- 1122 vehicles
- 453 vehicles
- 94 vehicles
- 05+ vehicles

- Rooms in owner-occupied houses in Cabool, Missouri
- 01 room
- 02 rooms
- 93 rooms
- 644 rooms
- 885 rooms
- 1166 rooms
- 627 rooms
- 1588 rooms
- 1049+ rooms

- Rooms in renter-occupied apartments in Cabool, Missouri
- 321 room
- 442 rooms
- 863 rooms
- 434 rooms
- 665 rooms
- 566 rooms
- 697 rooms
- 138 rooms
- 09+ rooms


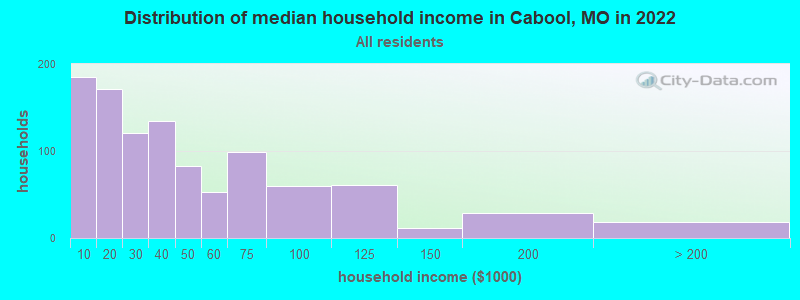
Cabool, MO household income distribution

- 185Less than $10,000
- 171$10,000 to $19,999
- 121$20,000 to $29,999
- 135$30,000 to $39,999
- 83$40,000 to $49,999
- 53$50,000 to $59,999
- 99$60,000 to $74,999
- 60$75,000 to $99,999
- 61$100,000 to $124,999
- 11$125,000 to $149,999
- 29$150,000 to $199,999
- 18$200,000 or more
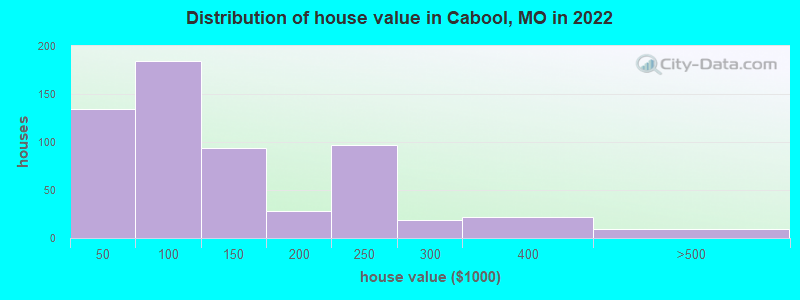
Home value of owner - occupied houses in 2022 in Cabool, MO
-
- 45Less than $10,000
- 34$10,000 to $14,999
- 5$20,000 to $24,999
- 8$30,000 to $34,999
- 40$40,000 to $49,999
- 53$50,000 to $59,999
- 34$60,000 to $69,999
- 13$70,000 to $79,999
- 5$80,000 to $89,999
- 36$90,000 to $99,999
- 81$100,000 to $124,999
- 12$125,000 to $149,999
- 28$175,000 to $199,999
- 97$200,000 to $249,999
- 18$250,000 to $299,999
- 22$300,000 to $399,999
- 8$400,000 to $499,999
Rent paid by renters in 2022 in Cabool, MO
-
- 23Less than $100
- 6$100 to $149
- 29$150 to $199
- 26$200 to $249
- 24$250 to $299
- 73$300 to $349
- 33$350 to $399
- 27$400 to $449
- 37$450 to $499
- 21$500 to $549
- 30$550 to $599
- 15$600 to $649
- 3$650 to $699
- 4$750 to $799
- 27$900 to $999
- 17No cash rent


Percentage of workers working in this county: 67.9%
Number of people working at home: 28 (3.1% of all workers)
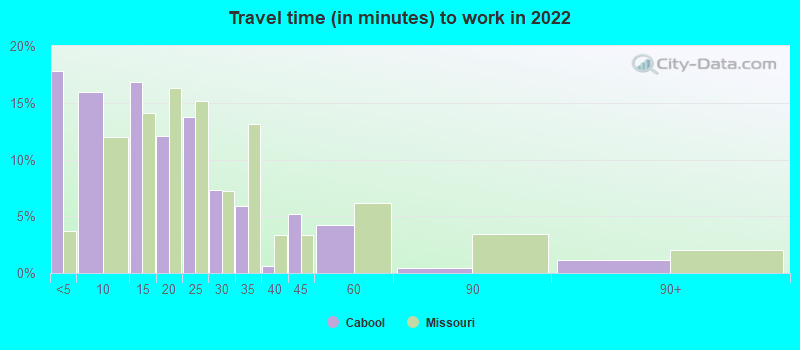
Travel time to work (commute)
- Less than 5 minutes: 309
- 5 to 9 minutes: 173
- 10 to 14 minutes: 65
- 15 to 19 minutes: 126
- 20 to 24 minutes: 61
- 25 to 29 minutes: 8
- 30 to 34 minutes: 35
- 35 to 39 minutes: 0
- 40 to 44 minutes: 0
- 45 to 59 minutes: 57
- 60 to 89 minutes: 19
- 90 or more minutes: 14
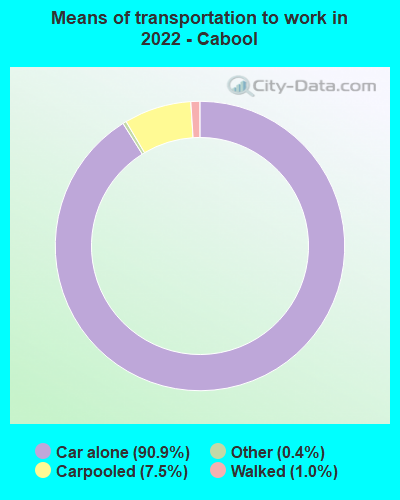
Means of transportation to work:
- Drove a car alone: 1,280 (86.7%)
- Carpooled: 107 (7.2%)
- Taxi: 6 (0.4%)
- Walked: 13 (0.9%)
- Worked at home: 28 (1.9%)

- Unemployment by race in 2022
- Unemployment rate for White non-Hispanic residents
- 1.3%Males
- 2.1%Females
- Unemployment rate for Asian residents
- 53.3%Females
- Unemployment rate for two or more race residents
- 6.5%Females

- Year of entry for the foreign-born population in Cabool, Missouri
- 02010 or later
- 232000 to 2009
- 131990 to 1999
- 51980 to 1989
- 01970 to 1979
- 10Before 1970

First ancestries reported:
- American: 388 (41.2%)
- English: 101 (10.7%)
- Irish: 87 (9.2%)
- German: 63 (6.7%)
- Swedish: 52 (5.5%)
- European: 46 (4.9%)
- Italian: 21 (2.2%)
- Norwegian: 20 (2.1%)
- British: 12 (1.3%)
- Scotch-Irish: 5 (0.5%)
- French: 4 (0.4%)
- Swiss: 4 (0.4%)
- Northern European: 3 (0.3%)
Most common places of birth for foreign-born residents (%):
| Cabool: | 87.0% (80) |
| Missouri: | 2.8% (7,146) |
| Cabool: | 19.6% (18) |
| Missouri: | 0.1% (186) |
| Cabool: | 10.9% (10) |
| Missouri: | 3.0% (7,803) |
| Cabool: | 3.3% (3) |
| Missouri: | 4.2% (10,873) |
| Cabool: | 2.2% (2) |
| Missouri: | 4.1% (10,700) |
Place of birth for U.S.-born residents:
- This state: 1,588
- Other state: 873
- Northeast: 21
- Midwest: 254
- South: 226
- West: 380
88.3% of Cabool residents lived in the same house 1 years ago.
Out of people who lived in different houses, 26.4% lived in this county.
Out of people who lived in different counties, 71.1% lived in Missouri.
| Cabool: | 88.3% |
| State average: | 87.1% |
Education attainment for males 25 years and older:
- No schooling: 9
- Nursery to 4th grade: 0
- 5th and 6th grade: 1
- 7th and 8th grade: 26
- 9th grade: 19
- 10th grade: 0
- 11th grade: 62
- 12th grade, no diploma: 6
- High school graduate (or equivalency): 291
- Less than 1 year of college: 71
- Some college more than 1 year, no degree: 107
- Associate degree: 8
- Bachelor's degree: 12
- Master's degree: 85
- Professional school degree: 5
- Doctorate degree: 17

Education attainment for females 25 years and older:
- No schooling: 35
- Nursery to 4th grade: 28
- 5th and 6th grade: 1
- 7th and 8th grade: 24
- 9th grade: 2
- 10th grade: 31
- 11th grade: 49
- 12th grade, no diploma: 33
- High school graduate (or equivalency): 241
- Less than 1 year of college: 90
- Some college more than 1 year, no degree: 97
- Associate degree: 59
- Bachelor's degree: 94
- Master's degree: 92
- Professional school degree: 7
- Doctorate degree: 0

Housing units in structures:
- One, detached: 749
- One, attached: 44
- Two: 82
- 3 or 4: 80
- 5 to 9: 16
- 20 to 49: 30
- 50 or more: 30
- Mobile homes: 27
Housing units lacking complete kitchen facilities in 2022: 6.2%
House/condo owner moved in on average 8 years ago
Renter moved in on average 2 years ago

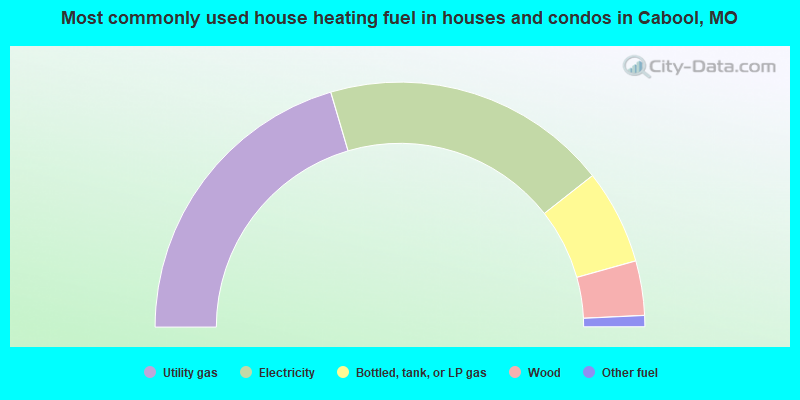
- 40.9%Utility gas
- 37.9%Electricity
- 12.5%Bottled, tank, or LP gas
- 7.2%Wood
- 1.5%Other fuel
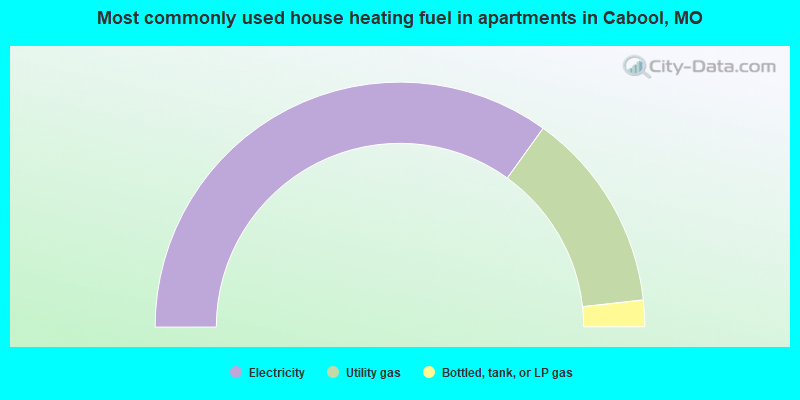
- 69.9%Electricity
- 26.6%Utility gas
- 3.5%Bottled, tank, or LP gas
Private vs. public school enrollment:
| Here: | 7.6% |
| Missouri: | 15.4% |
| Here: | 34.2% |
| Missouri: | 13.9% |
| Here: | 16.3% |
| Missouri: | 22.6% |


