Catonsville, MD (Maryland) Houses and Residents
Estimated median house or condo value in 2022: $404,046 (it was $138,900 in 2000 )
Catonsville:
$404,046Maryland:
$398,100
Lower value quartile - upper value quartile: $296,112 - $513,656Mean price in 2022: Detached houses: $572,474 Here:
$572,474State:
$526,819
Townhouses or other attached units: $382,619 Here:
$382,619State:
$328,305
In 2-unit structures: $395,584 Here:
$395,584State:
$346,599
In 3-to-4-unit structures: $964,494 Here:
$964,494State:
$295,378
In 5-or-more-unit structures: $508,440 Here:
$508,440State:
$350,378
Total population: 41,567 (Urban population: 39,753, Rural population: 0)
Houses: 16,836 (16,191 occupied: 11,697 owner occupied, 4,855 renter occupied )
% of renters here:
29%State:
32%
Housing density: 1,202 houses/condos per square mile
Median price asked for vacant for-sale houses and condos in 2022: $273,822.
Median contract rent in 2022: $1,445 (lower quartile is $1,133, upper quartile is over $2,000)
Median rent asked for vacant for-rent units in 2022: $1,236
Median gross rent in Catonsville, MD in 2022: $1,600
Housing units in Catonsville with a mortgage: 8,161 (958 second mortgage, 0 home equity loan, 924 both second mortgage and home equity loan )Houses without a mortgage: 373
Median household income for houses/condos with a mortgage: $136,756
Median household income for apartments without a mortgage: $82,794
Median monthly housing costs: $1,584
Data:
Median house or condo value ($)
Median house or condo value ($ change since 2000)
Median house or condo value ($) - White
Median house or condo value ($) - Black or African American
Median house or condo value ($) - Asian
Median house or condo value ($) - Hispanic or Latino
Median house or condo value ($) - American Indian and Alaska Native
Median house or condo value ($) - Multirace
Median house or condo value ($) - Other Race
Median price asked for mobile homes ($)
Household density (households per square mile)
Mean house or condo value by units in structure - 1, detached ($)
Mean house or condo value by units in structure - 1, attached ($)
Mean house or condo value by units in structure - 2 ($)
Mean house or condo value by units in structure by units in structure - 3 or 4 ($)
Mean house or condo value by units in structure - 5 or more ($)
Mean house or condo value by units in structure - Boat, RV, van, etc. ($)
Mean house or condo value by units in structure - Mobile home ($)
Median contract rent ($)
Median contract rent - Lower quartile ($)
Median contract rent - Upper quartile ($)
Median gross rent ($)
Urban houses (%)
Rural houses (%)
Houses occupied (%)
Houses occupied (% change since 2000)
Houses owner occupied (%)
Houses owner occupied (% change since 2000)
Houses renter occupied (%)
Houses renter occupied (% change since 2000)
Vacant housing units - For rent (%)
Vacant housing units - For rent (% change since 2000)
Vacant housing units - For sale only (%)
Vacant housing units - For sale only (% change since 2000)
Vacant housing units - Rented or sold, not occupied (%)
Vacant housing units - Rented or sold, not occupied (% change since 2000)
Vacant housing units - For seasonal, recreational, or occasional use (%)
Vacant housing units - For seasonal, recreational, or occasional use (% change since 2000)
Vacant housing units - For migrant workers (%)
Vacant housing units - For migrant workers (% change since 2000)
Vacant housing units - Other vacant (%)
Vacant housing units - Other vacant (% change since 2000)
Median monthly housing costs ($)
Median household income for houses/condos with a mortgage ($)
Median household income for houses/condos without a mortgage ($)
Median household income ($)
Median household income ($) - White
Median household income ($) - Black or African American
Median household income ($) - Asian
Median household income ($) - Hispanic or Latino
Median household income ($) - American Indian and Alaska Native
Median household income ($) - Multirace
Median household income ($) - Other Race
Mortgage status - with mortgage (%)
Mortgage status - with second mortgage (%)
Mortgage status - with home equity loan (%)
Mortgage status - with both second mortgage and home equity loan (%)
Mortgage status - without a mortgage (%)
Median year house/condo built
Median year apartment built
Household type by relationship - Male householder living alone (%)
Household type by relationship - Male householder not living alone (%)
Household type by relationship - Female householder living alone (%)
Household type by relationship - Female householder not living alone (%)
Household type by relationship - Opposite-Sex spouse (%)
Household type by relationship - Same-Sex spouse (%)
Household type by relationship - Opposite-Sex unmarried partner (%)
Household type by relationship - Same-Sex unmarried partner (%)
Household type by relationship - In group quarters (%)
Size of family households - 2-person household (%)
Size of family households - 3-person household (%)
Size of family households - 4-person household (%)
Size of family households - 5-person household (%)
Size of family households - 6-person household (%)
Size of family households - 7-or-more-person household (%)
Size of nonfamily households - 1-person household (%)
Size of nonfamily households - 2-person household (%)
Size of nonfamily households - 3-person household (%)
Size of nonfamily households - 4-person household (%)
Size of nonfamily households - 5-person household (%)
Size of nonfamily households - 6-person household (%)
Size of nonfamily households - 7-or-moreperson household (%)
Year house built - Built 2010 or later (%)
Year house built - Built 2000 to 2009 (%)
Year house built - Built 1990 to 1999 (%)
Year house built - Built 1980 to 1989 (%)
Year house built - Built 1970 to 1979 (%)
Year house built - Built 1960 to 1969 (%)
Year house built - Built 1950 to 1959 (%)
Year house built - Built 1940 to 1949 (%)
Year house built - Built 1939 or earlier (%)
Median number of rooms in houses and condos
Median number of rooms in apartments
Median number of bedrooms in owner occupied houses
Mean number of bedrooms in owner occupied houses
Median number of bedrooms in renter occupied houses
Mean number of bedrooms in renter occupied houses
Median number of vehichles in owner occupied houses
Mean number of vehichles in owner occupied houses
Median number of vehichles in renter occupied houses
Mean number of vehichles in renter occupied houses
Rooms in owner-occupied houses - 1 room (%)
Rooms in owner-occupied houses - 2 rooms (%)
Rooms in owner-occupied houses - 3 rooms (%)
Rooms in owner-occupied houses - 4 rooms (%)
Rooms in owner-occupied houses - 5 rooms (%)
Rooms in owner-occupied houses - 6 rooms (%)
Rooms in owner-occupied houses - 7 rooms (%)
Rooms in owner-occupied houses - 8 rooms (%)
Rooms in owner-occupied houses - 9+ rooms (%)
Rooms in renter-occupied houses - 1 room (%)
Rooms in renter-occupied houses - 2 rooms (%)
Rooms in renter-occupied houses - 3 rooms (%)
Rooms in renter-occupied houses - 4 rooms (%)
Rooms in renter-occupied houses - 5 rooms (%)
Rooms in renter-occupied houses - 6 rooms (%)
Rooms in renter-occupied houses - 7 rooms (%)
Rooms in renter-occupied houses - 8 rooms (%)
Rooms in renter-occupied houses - 9+ rooms (%)
Bedrooms in owner-occupied houses - no bedrooms (%)
Bedrooms in owner-occupied houses - 1 bedroom (%)
Bedrooms in owner-occupied houses - 2 bedrooms (%)
Bedrooms in owner-occupied houses - 3 bedrooms (%)
Bedrooms in owner-occupied houses - 4 bedrooms (%)
Bedrooms in owner-occupied houses - 5+ bedrooms (%)
Bedrooms in renter-occupied houses - no bedrooms (%)
Bedrooms in renter-occupied houses - 1 bedroom (%)
Bedrooms in renter-occupied houses - 2 bedrooms (%)
Bedrooms in renter-occupied houses - 3 bedrooms (%)
Bedrooms in renter-occupied houses - 4 bedrooms (%)
Bedrooms in renter-occupied houses - 5+ bedrooms (%)
Vehicles available in owner-occupied houses - no vehicle available (%)
Vehicles available in owner-occupied houses - 1 vehicle available(%)
Vehicles available in owner-occupied houses - 2 Vehicles available (%)
Vehicles available in owner-occupied houses - 3 Vehicles available (%)
Vehicles available in owner-occupied houses - 4 Vehicles available (%)
Vehicles available in owner-occupied houses - 5+ Vehicles available (%)
Vehicles available in renter-occupied houses - no vehicle available (%)
Vehicles available in renter-occupied houses - 1 vehicle available (%)
Vehicles available in renter-occupied houses - 2 Vehicles available (%)
Vehicles available in renter-occupied houses - 3 Vehicles available (%)
Vehicles available in renter-occupied houses - 4 Vehicles available (%)
Vehicles available in renter-occupied houses - 5+ Vehicles available (%)
Housing units in structures - 1, detached (%)
Housing units in structures - 1, attached (%)
Housing units in structures - 2 (%)
Housing units in structures - 3 or 4 (%)
Housing units in structures - 5 to 9 (%)
Housing units in structures - 10 to 19 (%)
Housing units in structures - 20 to 49 (%)
Housing units in structures - 50 or more (%)
Housing units in structures - Mobile home (%)
Housing units in structures - Boat, RV, van, etc. (%)
Housing units in structures - Owners - 1, detached (%)
Housing units in structures - Owners - 1, attached (%)
Housing units in structures - Owners - 2 (%)
Housing units in structures - Owners - 3 or 4 (%)
Housing units in structures - Owners - 5 to 9 (%)
Housing units in structures - Owners - 10 to 19 (%)
Housing units in structures - Owners - 20 to 49 (%)
Housing units in structures - Owners - 50 or more (%)
Housing units in structures - Owners - Mobile home (%)
Housing units in structures - Owners - Boat, RV, van, etc. (%)
Housing units in structures - Renters - 1, detached (%)
Housing units in structures - Renters - 1, attached (%)
Housing units in structures - Renters - 2 (%)
Housing units in structures - Renters - 3 or 4 (%)
Housing units in structures - Renters - 5 to 9 (%)
Housing units in structures - Renters - 10 to 19 (%)
Housing units in structures - Renters - 20 to 49 (%)
Housing units in structures - Renters - 50 or more (%)
Housing units in structures - Renters - Mobile home (%)
Housing units in structures - Renters - Boat, RV, van, etc. (%)
House/condo owner moved in on average (years ago)
Renter moved in on average (years ago)
Year householder moved into unit - Moved in 1999 to March 2000 (%)
Year householder moved into unit - Moved in 1999 to March 2000 (%) - White
Year householder moved into unit - Moved in 1999 to March 2000 (%) - Black or African American
Year householder moved into unit - Moved in 1999 to March 2000 (%) - Asian
Year householder moved into unit - Moved in 1999 to March 2000 (%) - Hispanic or Latino
Year householder moved into unit - Moved in 1999 to March 2000 (%) - American Indian and Alaska Native
Year householder moved into unit - Moved in 1999 to March 2000 (%) - Multirace
Year householder moved into unit - Moved in 1999 to March 2000 (%) - Other Race
Year householder moved into unit - Moved in 1995 to 1998 (%)
Year householder moved into unit - Moved in 1995 to 1998 (%) - White
Year householder moved into unit - Moved in 1995 to 1998 (%) - Black or African American
Year householder moved into unit - Moved in 1995 to 1998 (%) - Asian
Year householder moved into unit - Moved in 1995 to 1998 (%) - Hispanic or Latino
Year householder moved into unit - Moved in 1995 to 1998 (%) - American Indian and Alaska Native
Year householder moved into unit - Moved in 1995 to 1998 (%) - Multirace
Year householder moved into unit - Moved in 1995 to 1998 (%) - Other Race
Year householder moved into unit - Moved in 1990 to 1994 (%)
Year householder moved into unit - Moved in 1990 to 1994 (%) - White
Year householder moved into unit - Moved in 1990 to 1994 (%) - Black or African American
Year householder moved into unit - Moved in 1990 to 1994 (%) - Asian
Year householder moved into unit - Moved in 1990 to 1994 (%) - Hispanic or Latino
Year householder moved into unit - Moved in 1990 to 1994 (%) - American Indian and Alaska Native
Year householder moved into unit - Moved in 1990 to 1994 (%) - Multirace
Year householder moved into unit - Moved in 1990 to 1994 (%) - Other Race
Year householder moved into unit - Moved in 1980 to 1989 (%)
Year householder moved into unit - Moved in 1980 to 1989 (%) - White
Year householder moved into unit - Moved in 1980 to 1989 (%) - Black or African American
Year householder moved into unit - Moved in 1980 to 1989 (%) - Asian
Year householder moved into unit - Moved in 1980 to 1989 (%) - Hispanic or Latino
Year householder moved into unit - Moved in 1980 to 1989 (%) - American Indian and Alaska Native
Year householder moved into unit - Moved in 1980 to 1989 (%) - Multirace
Year householder moved into unit - Moved in 1980 to 1989 (%) - Other Race
Year householder moved into unit - Moved in 1970 to 1979 (%)
Year householder moved into unit - Moved in 1970 to 1979 (%) - White
Year householder moved into unit - Moved in 1970 to 1979 (%) - Black or African American
Year householder moved into unit - Moved in 1970 to 1979 (%) - Asian
Year householder moved into unit - Moved in 1970 to 1979 (%) - Hispanic or Latino
Year householder moved into unit - Moved in 1970 to 1979 (%) - American Indian and Alaska Native
Year householder moved into unit - Moved in 1970 to 1979 (%) - Multirace
Year householder moved into unit - Moved in 1970 to 1979 (%) - Other Race
Year householder moved into unit - Moved in 1969 or earlier (%)
Year householder moved into unit - Moved in 1969 or earlier (%) - White
Year householder moved into unit - Moved in 1969 or earlier (%) - Black or African American
Year householder moved into unit - Moved in 1969 or earlier (%) - Asian
Year householder moved into unit - Moved in 1969 or earlier (%) - Hispanic or Latino
Year householder moved into unit - Moved in 1969 or earlier (%) - American Indian and Alaska Native
Year householder moved into unit - Moved in 1969 or earlier (%) - Multirace
Year householder moved into unit - Moved in 1969 or earlier (%) - Other Race
Housing units lacking complete plumbing facilities (%)
Housing units lacking complete kitchen facilities (%)
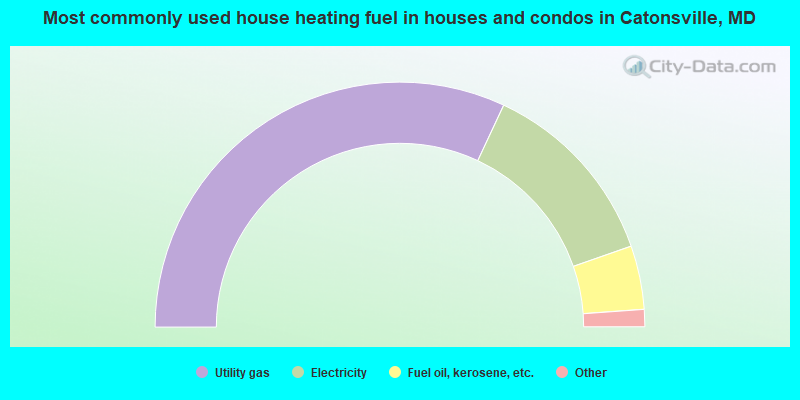
House heating fuel used in houses and condos - Utility gas (%)
House heating fuel used in houses and condos - Bottled, tank, or LP gas (%)
House heating fuel used in houses and condos - Electricity (%)
House heating fuel used in houses and condos - Fuel oil, kerosene, etc. (%)
House heating fuel used in houses and condos - Coal or coke (%)
House heating fuel used in houses and condos - Wood (%)
House heating fuel used in houses and condos - Solar energy (%)
House heating fuel used in houses and condos - Other fuel (%)
House heating fuel used in houses and condos - No fuel used (%)
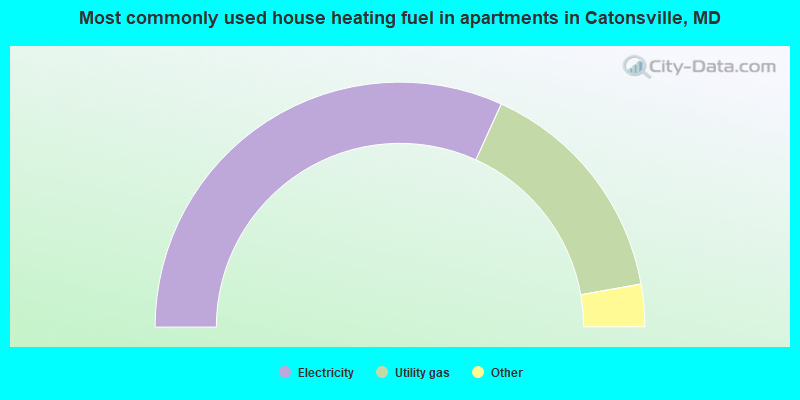
House heating fuel used in apartments - Utility gas (%)
House heating fuel used in apartments - Bottled, tank, or LP gas (%)
House heating fuel used in apartments - Electricity (%)
House heating fuel used in apartments - Fuel oil, kerosene, etc. (%)
House heating fuel used in apartments - Coal or coke (%)
House heating fuel used in apartments - Wood (%)
House heating fuel used in apartments - Solar energy (%)
House heating fuel used in apartments - Other fuel (%)
House heating fuel used in apartments - No fuel used (%)
Latest news about housing in Catonsville, MD collected exclusively by city-data.com from local newspapers, TV, and radio stations
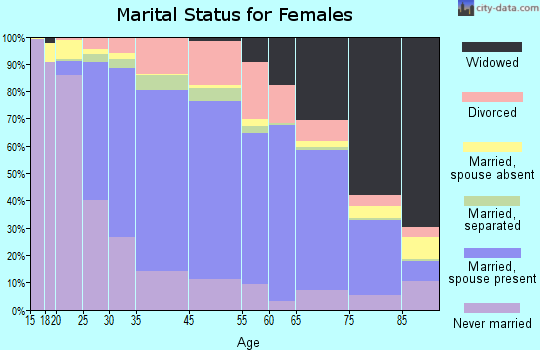
Median year house/condo built: 1958Median year apartment built: 1981Household type by relationship:
Households: 42,536
Male householders: 7,222 (1,983 living alone ), Female householders: 8,805 (3,770 living alone )7,143 spouses (7,108 opposite-sex spouses ), 873 unmarried partners , (763 opposite-sex unmarried partners ), 11,278 children (10,340 natural , 498 adopted , 439 stepchildren ), 564 grandchildren , 215 brothers or sisters , 468 parents , 5 foster children , 400 other relatives , 1,076 non-relatives In group quarters: 4,481
Size of family households: 4,354 2-persons , 1,949 3-persons , 2,073 4-persons , 735 5-persons , 334 6-persons , 91 7-or-more-persons .
Size of nonfamily households: 5,992 1-person , 828 2-persons , 139 3-persons , 15 5-persons .
5,864 married couples with children. single-parent households (486 men , 1,421 women ).
86.6% of residents of Catonsville speak English at home. of residents speak Spanish at home (68% speak English very well , 16% speak English well , 14% speak English not well , 2% don't speak English at all ).of residents speak other Indo-European language at home (66% speak English very well , 20% speak English well , 12% speak English not well , 3% don't speak English at all ).of residents speak Asian or Pacific Island language at home (55% speak English very well , 30% speak English well , 12% speak English not well , 4% don't speak English at all ).of residents speak other language at home (76% speak English very well , 21% speak English well , 2% speak English not well ).
Foreign born population: 5,391 (12.7%)of them are naturalized citizens )
Median number of rooms in houses and condos:
Median number of rooms in apartments
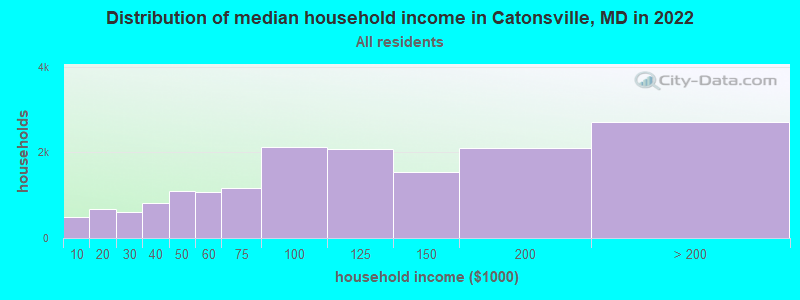
Catonsville, MD household income distribution 495 Less than $10,000670 $10,000 to $19,999599 $20,000 to $29,999813 $30,000 to $39,9991,093 $40,000 to $49,9991,075 $50,000 to $59,9991,163 $60,000 to $74,9992,128 $75,000 to $99,9992,077 $100,000 to $124,9991,539 $125,000 to $149,9992,094 $150,000 to $199,9992,709 $200,000 or more
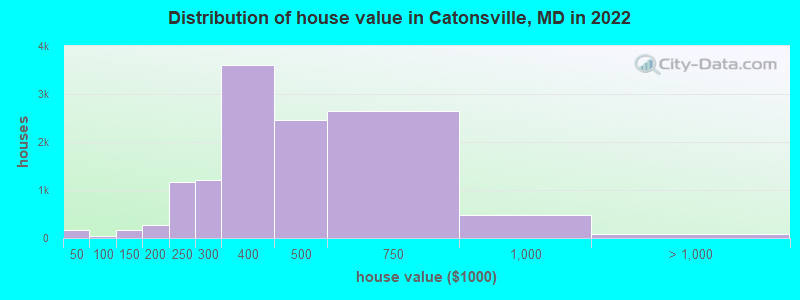
Home value of owner - occupied houses in 2022 in Catonsville, MD 64 Less than $10,0006 $10,000 to $14,99934 $15,000 to $19,9995 $20,000 to $24,99925 $25,000 to $29,99930 $35,000 to $39,9993 $40,000 to $49,9998 $50,000 to $59,99911 $80,000 to $89,99913 $90,000 to $99,99959 $100,000 to $124,99999 $125,000 to $149,99986 $150,000 to $174,999182 $175,000 to $199,9991,170 $200,000 to $249,9991,213 $250,000 to $299,9993,612 $300,000 to $399,9992,465 $400,000 to $499,9992,640 $500,000 to $749,999479 $750,000 to $999,99942 $1,000,000 to $1,499,99934 $2,000,000 or moreRent paid by renters in 2022 in Catonsville, MD 7 Less than $10012 $100 to $14936 $150 to $19914 $200 to $2497 $550 to $5998 $600 to $64914 $650 to $6995 $700 to $749124 $750 to $799372 $800 to $899128 $900 to $999811 $1,000 to $1,2491,101 $1,250 to $1,499790 $1,500 to $1,999680 $2,000 to $2,499137 $2,500 to $2,99959 $3,000 to $3,499352 $3,500 or more108 No cash rent
Percentage of workers working in this county: 52.2%Number of people working at home: 4,858 (23.2% of all workers )
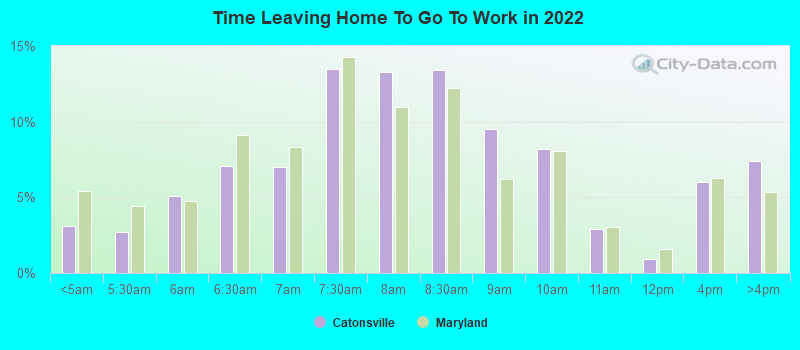
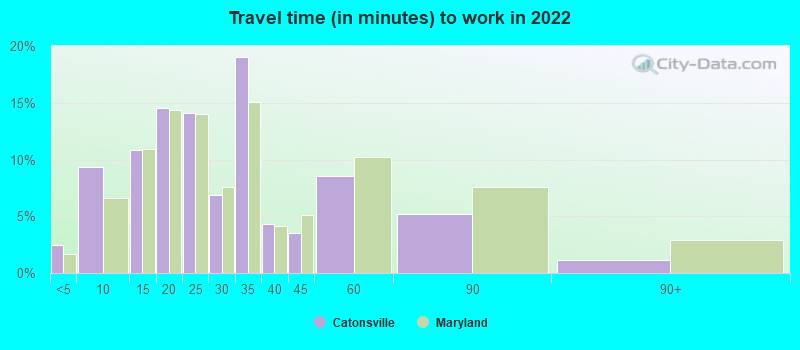
Travel time to work (commute)
Less than 5 minutes: 3665 to 9 minutes: 1,26710 to 14 minutes: 1,53815 to 19 minutes: 3,18920 to 24 minutes: 2,97325 to 29 minutes: 1,49930 to 34 minutes: 2,68935 to 39 minutes: 46940 to 44 minutes: 73445 to 59 minutes: 98560 to 89 minutes: 75790 or more minutes: 266
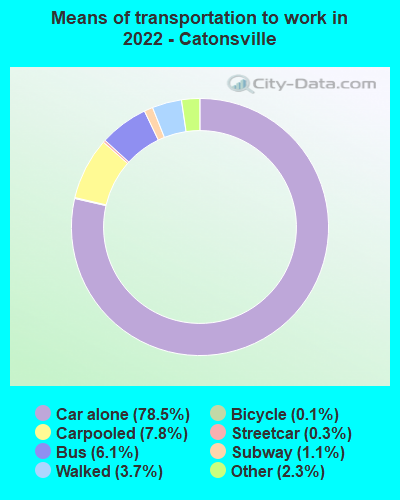
Means of transportation to work:
Drove a car alone: 12,600 (60.7%)Carpooled: 1,436 (6.9%)Bus : 602 (2.9%)Subway or elevated rail : 51 (0.2%)Long-distance train or commuter rail : 416 (2.0%)Taxi: 442 (2.1%)Bicycle: 19 (0.1%)Walked: 661 (3.2%)Worked at home: 4,858 (23.4%)
Unemployment by race in 2022
Unemployment rate for White non-Hispanic residents 2.3% Males2.4% FemalesUnemployment rate for Black residents 5.0% Males1.4% FemalesUnemployment rate for Asian residents 11.8% MalesUnemployment rate for other race residents 9.6% FemalesUnemployment rate for two or more race residents 4.0% Males3.1% FemalesUnemployment rate for Hispanic or Latino residents 0.8% Males4.4% Females
Year of entry for the foreign-born population in Catonsville, Maryland
2,575 2010 or later 1,210 2000 to 2009 755 1990 to 1999 658 1980 to 1989 310 1970 to 1979 462 Before 1970
First ancestries reported:
German: 1,720 (8.5%)
Irish: 1,474 (7.3%)
English: 1,209 (6.0%)
European: 911 (4.5%)
American: 833 (4.1%)
Italian: 756 (3.7%)
African: 495 (2.4%)
Polish: 366 (1.8%)
Afghan: 271 (1.3%)
Ethiopian: 268 (1.3%)
Nigerian: 254 (1.3%)
Ukrainian: 231 (1.1%)
Albanian: 202 (1.0%)
Russian: 158 (0.8%)
Scandinavian: 142 (0.7%)
Scottish: 124 (0.6%)
Norwegian: 119 (0.6%)
Ghanaian: 97 (0.5%)
British: 95 (0.5%)
Lithuanian: 88 (0.4%)
Welsh: 87 (0.4%)
Swiss: 81 (0.4%)
Greek: 80 (0.4%)
French Canadian: 66 (0.3%)
French: 62 (0.3%)
Eastern European: 54 (0.3%)
Haitian: 49 (0.2%)
Scotch-Irish: 47 (0.2%)
Swedish: 46 (0.2%)
Danish: 42 (0.2%)
Egyptian: 32 (0.2%)
Dutch: 31 (0.2%)
Romanian: 28 (0.1%)
Jamaican: 28 (0.1%)
Trinidadian and Tobagonian: 28 (0.1%)
Slovak: 26 (0.1%)
Austrian: 26 (0.1%)
Northern European: 25 (0.1%)
Czech: 24 (0.1%)
Portuguese: 20 (0.10%)
Finnish: 18 (0.09%)
Moroccan: 14 (0.07%)
Icelander: 14 (0.07%)
Iranian: 12 (0.06%)
Cajun: 11 (0.05%)
British West Indian: 11 (0.05%)
Jordanian: 10 (0.05%)
Canadian: 9 (0.04%)
Belgian: 9 (0.04%)
Yugoslavian: 8 (0.04%)
Serbian: 7 (0.03%)
Croatian: 4 (0.02%)
Most common places of birth for foreign-born residents (%): Burma (Myanmar) Catonsville:
7.5% (407)Maryland:
0.5% (4,888)
China, excluding Hong Kong and Taiwan Catonsville:
7.3% (395)Maryland:
4.6% (44,742)
India Catonsville:
6.9% (376)Maryland:
6.4% (61,725)
El Salvador Catonsville:
6.1% (330)Maryland:
12.0% (115,412)
Bangladesh Catonsville:
5.7% (308)Maryland:
0.7% (7,124)
Ethiopia Catonsville:
4.9% (264)Maryland:
3.2% (30,870)
Nigeria Catonsville:
4.5% (243)Maryland:
4.6% (44,825)
Eritrea Catonsville:
3.7% (202)Maryland:
0.3% (2,915)
Venezuela Catonsville:
3.5% (191)Maryland:
0.5% (4,901)
Democratic Republic of Congo (Zaire) Catonsville:
3.5% (188)Maryland:
0.2% (1,861)
Pakistan Catonsville:
3.4% (182)Maryland:
1.8% (17,037)
Other Eastern Europe Catonsville:
2.8% (152)Maryland:
0.3% (3,199)
Korea Catonsville:
2.7% (148)Maryland:
3.4% (32,635)
Russia Catonsville:
2.6% (139)Maryland:
1.0% (9,481)
Nepal Catonsville:
2.4% (129)Maryland:
1.1% (10,205)
Vietnam Catonsville:
2.1% (113)Maryland:
1.9% (18,716)
Afghanistan Catonsville:
2.0% (111)Maryland:
0.4% (3,905)
Germany Catonsville:
1.6% (87)Maryland:
1.2% (11,265)
Honduras Catonsville:
1.5% (84)Maryland:
2.5% (24,026)
Place of birth for U.S.-born residents:
This state: 25,535Other state: 11,013Northeast: 4,217Midwest: 1,925South: 3,987West: 893 87.1% of Catonsville residents lived in the same house 1 years ago.
Out of people who lived in different houses, 19.7% lived in this county.
Out of people who lived in different counties, 82.4% lived in Maryland.
Catonsville:
87.1%State average:
88.5%
Education attainment for males 25 years and older:
No schooling: 212Nursery to 4th grade: 645th and 6th grade: 397th and 8th grade: 649th grade: 5610th grade: 6311th grade: 3912th grade, no diploma: 248High school graduate (or equivalency): 2,046Less than 1 year of college: 645Some college more than 1 year, no degree: 1,435Associate degree: 983Bachelor's degree: 3,729Master's degree: 2,114Professional school degree: 570Doctorate degree: 470
Education attainment for females 25 years and older:
No schooling: 421Nursery to 4th grade: 895th and 6th grade: 327th and 8th grade: 2089th grade: 9610th grade: 5511th grade: 9112th grade, no diploma: 167High school graduate (or equivalency): 2,837Less than 1 year of college: 917Some college more than 1 year, no degree: 1,397Associate degree: 1,145Bachelor's degree: 4,157Master's degree: 2,915Professional school degree: 590Doctorate degree: 484
Housing units in structures:
One, detached: 8,367One, attached: 2,935Two: 6333 or 4: 4015 to 9: 93810 to 19: 1,52820 to 49: 24750 or more: 1,765Mobile homes: 18Housing units lacking complete plumbing facilities in 2022: 0.4%Housing units lacking complete kitchen facilities in 2022: 2.0%House/condo owner moved in on average 13 years ago
Renter moved in on average 3 years ago
Private vs. public school enrollment:
Students in private schools in grades 1 to 8 (elementary and middle school): 503 Students in private schools in grades 9 to 12 (high school): 272 Students in private undergraduate colleges: 894