Converse, TX (Texas) Houses and Residents
| Converse: | $251,971 |
| Texas: | $275,400 |
Mean price in 2022:
Detached houses: $241,271
Here: $241,271 State: $369,058 Townhouses or other attached units: $264,627
Here: $264,627 State: $327,631 Mobile homes: $177,242
Here: $177,242 State: $124,413
Total population: 21,054 (Urban population: 11,480, Rural population: 28 (all nonfarm))
Houses: 10,177 (9,988 occupied: 7,469 owner occupied, 2,507 renter occupied)
| % of renters here: | 25% |
| State: | 38% |
Housing density: 1,608 houses/condos per square mile
Median price asked for vacant for-sale houses and condos in 2022: $2,467,409.
Median contract rent in 2022: $1,316 (lower quartile is $1,000, upper quartile is $1,578)
Median rent asked for vacant for-rent units in 2022: $1,344
Median gross rent in Converse, TX in 2022: $1,451
Housing units in Converse with a mortgage: 5,245 (93 second mortgage, 0 home equity loan, 91 both second mortgage and home equity loan)
Houses without a mortgage: 74
Median household income for houses/condos with a mortgage: $100,201
Median household income for apartments without a mortgage: $71,303
Median monthly housing costs: $1,412
Compare current foreclosures in Converse, TX:
| Photo | Address | Area | Beds / Baths | Price | Details |
|---|---|---|---|---|---|

|
#1
Misty Mdw
Converse, TX 78109
|
1,064 sq. feet
|
1 baths 3 beds |
show details | |

|
#2
Via Sonoma Trl
Converse, TX 78109
|
1,774 sq. feet
|
3 baths 3 beds |
show details | |

|
#3
Cherry Glade
Converse, TX 78109
|
1,712 sq. feet
|
2 baths 3 beds |
show details | |

|
#4
Avenue A
Converse, TX 78109
|
- sq. feet
|
2 baths 3 beds |
show details | |

|
#5
Malakoff
Converse, TX 78109
|
1,211 sq. feet
|
2 baths 3 beds |
show details | |

|
#6
Arabian King
Converse, TX 78109
|
2,677 sq. feet
|
2 baths 4 beds |
show details | |

|
#7
Spruce Ridge Dr
Converse, TX 78109
|
1,784 sq. feet
|
2 baths 3 beds |
show details | |

|
#8
Shallow Xing
Converse, TX 78109
|
2,299 sq. feet
|
2 baths 4 beds |
show details | |

|
#9
Misty Ridge Dr
Converse, TX 78109
|
2,353 sq. feet
|
2 baths 4 beds |
show details | |

|
#10
Copper Mist
Converse, TX 78109
|
1,936 sq. feet
|
2 baths 3 beds |
show details |
| Photo | Address | Area | Beds / Baths | Price | Details |
|---|---|---|---|---|---|

|
#11
Seneca Crk
Converse, TX 78109
|
1,879 sq. feet
|
2 baths 3 beds |
show details | |

|
#12
Beech Trail Dr
Converse, TX 78109
|
1,520 sq. feet
|
2 baths 3 beds |
show details | |

|
#13
Gambels Quail
Converse, TX 78109
|
2,214 sq. feet
|
2 baths 3 beds |
show details | |

|
#14
Cherokee Rdg
Converse, TX 78109
|
2,413 sq. feet
|
2 baths 4 beds |
show details | |

|
#15
4th St W
Converse, TX 78109
|
1,113 sq. feet
|
2 baths 3 beds |
show details | |

|
#16
Renee Dr
Converse, TX 78109
|
1,389 sq. feet
|
2 baths 3 beds |
show details | |

|
#17
Autumn Arch
Converse, TX 78109
|
1,996 sq. feet
|
2 baths 4 beds |
show details | |

|
#18
Northallerton
Converse, TX 78109
|
2,105 sq. feet
|
2 baths 3 beds |
show details | |

|
#19
Bent Meadow Dr
Converse, TX 78109
|
2,958 sq. feet
|
2 baths 3 beds |
show details | |

|
#20
Meadow Way
Converse, TX 78109
|
1,113 sq. feet
|
2 baths 3 beds |
show details |
| Photo | Address | Area | Beds / Baths | Price | Details |
|---|---|---|---|---|---|

|
#21
Autumn Arbor
Converse, TX 78109
|
1,536 sq. feet
|
2 baths 3 beds |
show details | |

|
#22
Nature Trl
Converse, TX 78109
|
1,972 sq. feet
|
2 baths 3 beds |
show details | |

|
#23
Cylburn Park
Converse, TX 78109
|
1,318 sq. feet
|
2 baths 3 beds |
show details | |

|
#24
Pioneer Oak
Converse, TX 78109
|
1,290 sq. feet
|
2 baths 3 beds |
show details | |

|
#25
Mesquite Pass
Converse, TX 78109
|
2,372 sq. feet
|
2 baths 4 beds |
show details | |

|
#26
Echo Ridge Dr
Converse, TX 78109
|
2,692 sq. feet
|
2 baths 4 beds |
show details | |

|
#27
Sterling Mnr
Converse, TX 78109
|
1,983 sq. feet
|
- baths - beds |
show details | |

|
#28
Rock Cove Ln
Converse, TX 78109
|
1,747 sq. feet
|
2 baths 3 beds |
show details | |

|
#29
Meadow Dl
Converse, TX 78109
|
1,606 sq. feet
|
2 baths 3 beds |
show details | |

|
#30
Dakota Run
Converse, TX 78109
|
1,734 sq. feet
|
2 baths 3 beds |
show details |
| Photo | Address | Area | Beds / Baths | Price | Details |
|---|---|---|---|---|---|

|
#31
Texas Palm Dr
Converse, TX 78109
|
1,933 sq. feet
|
2 baths 3 beds |
show details | |

|
#32
Anderson Way
Converse, TX 78109
|
2,433 sq. feet
|
2 baths 4 beds |
show details | |

|
#33
Trona Mine
Converse, TX 78109
|
- sq. feet
|
3 baths 4 beds |
show details | |

|
#34
Flatstone Pass
Converse, TX 78109
|
2,042 sq. feet
|
2 baths 4 beds |
show details | |

|
#35
Copper Elm Dr
Converse, TX 78109
|
3,080 sq. feet
|
3 baths 4 beds |
show details | |

|
#36
Staghorn Ml
Converse, TX 78109
|
2,278 sq. feet
|
2 baths 4 beds |
show details | |

|
#37
Hays Parc Rd
Converse, TX 78109
|
2,565 sq. feet
|
2 baths 3 beds |
show details | |

|
#38
Chestnut Barr Dr
Converse, TX 78109
|
2,959 sq. feet
|
2 baths 3 beds |
show details | |

|
#39
Coral Meadow Dr
Converse, TX 78109
|
1,520 sq. feet
|
2 baths 3 beds |
show details | |

|
#40
Vaquillas Vw
Converse, TX 78109
|
- sq. feet
|
- baths - beds |
show details |
| Photo | Address | Area | Beds / Baths | Price | Details |
|---|---|---|---|---|---|

|
#41
Big Four
Converse, TX 78109
|
- sq. feet
|
- baths - beds |
show details | |

|
#42
Fisherman Prt
Converse, TX 78109
|
- sq. feet
|
- baths - beds |
show details | |

|
#43
Torchwood Dr
Converse, TX 78109
|
- sq. feet
|
- baths - beds |
show details | |

|
#44
Kitty Hawk Lot 107
Converse, TX 78109
|
1,368 sq. feet
|
- baths - beds |
show details | |

|
#45
Common Law
Converse, TX 78109
|
- sq. feet
|
- baths - beds |
show details | |

|
#46
Redstone Mnr
Converse, TX 78109
|
- sq. feet
|
- baths - beds |
show details | |

|
#47
Noble Crst
Converse, TX 78109
|
- sq. feet
|
- baths - beds |
show details | |

|
#48
Bogie Way
Converse, TX 78109
|
- sq. feet
|
- baths - beds |
show details | |

|
#49
Green Rd
Converse, TX 78109
|
- sq. feet
|
- baths - beds |
show details | |

|
Check over 1 million property listings on Foreclosure.com!
|
browse all offers | |||

Latest news about housing in Converse, TX collected exclusively by city-data.com from local newspapers, TV, and radio stations

 | Lennar homes in Converse Texas (2 replies) |
| Nice rental homes near Ft Sam Houston? (18 replies) |
| Housing @ Kirby for BAMC employees? (4 replies) |
| Bad news for those in market to buy a new home - San Antonio is most over valued market in nation (65 replies) |
| Vantage at Converse or Town Square Apartments? (0 replies) |
| Converse Info (8 replies) |

Median year apartment built: 2003
Household type by relationship:
Households: 28,685- Male householders: 4,970 (1,456 living alone), Female householders: 4,900 (995 living alone)
4,688 spouses (4,688 opposite-sex spouses), 284 unmarried partners, (275 opposite-sex unmarried partners), 10,323 children (9,286 natural, 210 adopted, 827 stepchildren), 1,223 grandchildren, 369 brothers or sisters, 446 parents, 0 foster children, 377 other relatives, 926 non-relatives
- In group quarters: 174
Size of family households: 2,531 2-persons, 2,318 3-persons, 1,194 4-persons, 634 5-persons, 231 6-persons, 210 7-or-more-persons.
Size of nonfamily households: 2,539 1-person, 289 2-persons, 6 3-persons, 8 4-persons, 17 5-persons.
3,787 married couples with children.
3,496 single-parent households (1,061 men, 2,435 women).
72.1% of residents of Converse speak English at home.
23.9% of residents speak Spanish at home (80% speak English very well, 13% speak English well, 5% speak English not well, 2% don't speak English at all).
1.0% of residents speak other Indo-European language at home (81% speak English very well, 12% speak English well, 7% speak English not well).
2.0% of residents speak Asian or Pacific Island language at home (34% speak English very well, 48% speak English well, 18% speak English not well).
1.4% of residents speak other language at home (56% speak English very well, 19% speak English well, 25% speak English not well).
Foreign born population: 2,434 (8.5%)
(59.1% of them are naturalized citizens)
| Here: | 6.4 |
| State: | 6.3 |
| Here: | 5.0 |
| State: | 4.0 |

- Bedrooms in owner-occupied houses and condos in Converse, Texas
- 0no bedroom
- 01 bedroom
- 2742 bedrooms
- 4,0653 bedrooms
- 2,8924 bedrooms
- 2395+ bedrooms

- Bedrooms in renter-occupied apartments in Converse, Texas
- 14no bedroom
- 2451 bedroom
- 5982 bedrooms
- 1,4373 bedrooms
- 2054 bedrooms
- 85+ bedrooms

- Cars and other vehicles available in Converse in owner-occupied houses/condos
- 114no vehicle
- 2,1301 vehicle
- 3,4402 vehicles
- 1,2033 vehicles
- 4564 vehicles
- 1275+ vehicles

- Cars and other vehicles available in Converse in renter-occupied apartments
- 149no vehicle
- 1,3831 vehicle
- 7392 vehicles
- 2093 vehicles
- 194 vehicles
- 95+ vehicles

- Rooms in owner-occupied houses in Converse, Texas
- 01 room
- 02 rooms
- 233 rooms
- 2384 rooms
- 1,5965 rooms
- 2,1636 rooms
- 1,3197 rooms
- 8848 rooms
- 1,2489+ rooms

- Rooms in renter-occupied apartments in Converse, Texas
- 141 room
- 652 rooms
- 3793 rooms
- 4264 rooms
- 7975 rooms
- 4036 rooms
- 2437 rooms
- 578 rooms
- 1239+ rooms


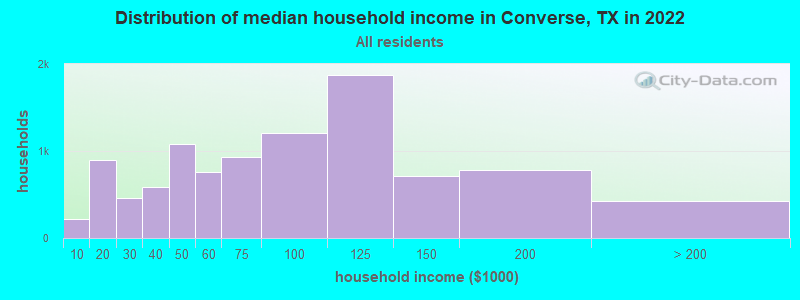
Converse, TX household income distribution

- 222Less than $10,000
- 891$10,000 to $19,999
- 457$20,000 to $29,999
- 590$30,000 to $39,999
- 1,083$40,000 to $49,999
- 754$50,000 to $59,999
- 930$60,000 to $74,999
- 1,211$75,000 to $99,999
- 1,878$100,000 to $124,999
- 711$125,000 to $149,999
- 785$150,000 to $199,999
- 429$200,000 or more
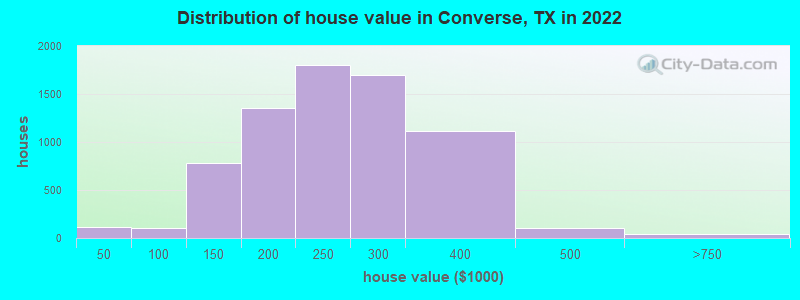
Home value of owner - occupied houses in 2022 in Converse, TX
-
- 15Less than $10,000
- 24$10,000 to $14,999
- 47$15,000 to $19,999
- 5$20,000 to $24,999
- 9$30,000 to $34,999
- 8$35,000 to $39,999
- 6$50,000 to $59,999
- 0$70,000 to $79,999
- 22$80,000 to $89,999
- 73$90,000 to $99,999
- 354$100,000 to $124,999
- 425$125,000 to $149,999
- 482$150,000 to $174,999
- 872$175,000 to $199,999
- 1,804$200,000 to $249,999
- 1,695$250,000 to $299,999
- 1,111$300,000 to $399,999
- 102$400,000 to $499,999
- 24$500,000 to $749,999
- 17$1,500,000 to $1,999,999
Rent paid by renters in 2022 in Converse, TX
-
- 18Less than $100
- 21$550 to $599
- 44$600 to $649
- 22$700 to $749
- 135$750 to $799
- 119$800 to $899
- 232$900 to $999
- 474$1,000 to $1,249
- 685$1,250 to $1,499
- 671$1,500 to $1,999
- 67$2,000 to $2,499
- 60No cash rent


Percentage of workers working in this county: 87.5%
Number of people working at home: 1,955 (14.5% of all workers)
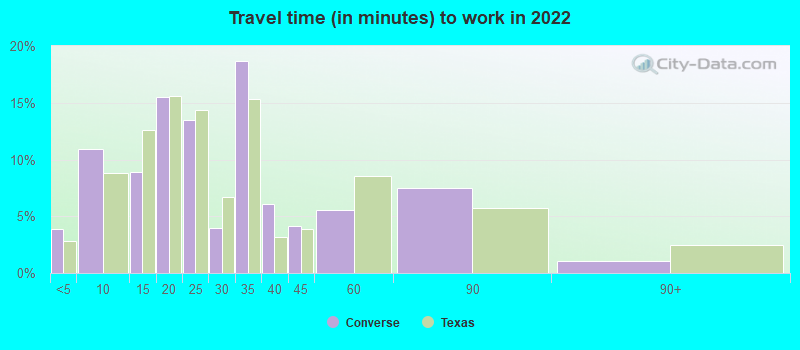
Travel time to work (commute)
- Less than 5 minutes: 212
- 5 to 9 minutes: 398
- 10 to 14 minutes: 934
- 15 to 19 minutes: 2,158
- 20 to 24 minutes: 1,650
- 25 to 29 minutes: 1,414
- 30 to 34 minutes: 2,335
- 35 to 39 minutes: 457
- 40 to 44 minutes: 547
- 45 to 59 minutes: 854
- 60 to 89 minutes: 357
- 90 or more minutes: 291
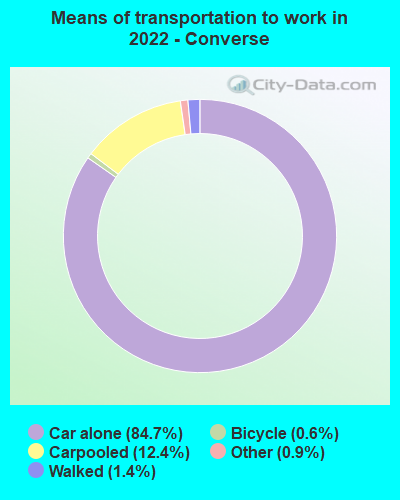
Means of transportation to work:
- Drove a car alone: 4,483 (63.2%)
- Carpooled: 741 (10.4%)
- Taxi: 52 (0.7%)
- Bicycle: 40 (0.6%)
- Walked: 88 (1.2%)
- Worked at home: 1,955 (27.6%)

- Unemployment by race in 2022
- Unemployment rate for White non-Hispanic residents
- 2.2%Males
- 3.9%Females
- Unemployment rate for Black residents
- 3.5%Males
- Unemployment rate for Asian residents
- 18.4%Males
- 10.5%Females
- Unemployment rate for other race residents
- 15.4%Males
- 1.3%Females
- Unemployment rate for two or more race residents
- 2.9%Males
- 1.1%Females
- Unemployment rate for Hispanic or Latino residents
- 5.1%Males
- 2.0%Females

- Year of entry for the foreign-born population in Converse, Texas
- 4942010 or later
- 4712000 to 2009
- 3701990 to 1999
- 1621980 to 1989
- 1951970 to 1979
- 178Before 1970

First ancestries reported:
- American: 767 (4.5%)
- German: 595 (3.5%)
- Irish: 417 (2.4%)
- English: 405 (2.4%)
- African: 324 (1.9%)
- Czech: 229 (1.3%)
- European: 154 (0.9%)
- Russian: 86 (0.5%)
- Polish: 81 (0.5%)
- Norwegian: 71 (0.4%)
- Afghan: 50 (0.3%)
- Belizean: 43 (0.3%)
- Scottish: 39 (0.2%)
- Romanian: 36 (0.2%)
- Dutch: 34 (0.2%)
- Celtic: 31 (0.2%)
- Latvian: 30 (0.2%)
- Scotch-Irish: 30 (0.2%)
- Italian: 25 (0.1%)
- French: 23 (0.1%)
- Moroccan: 17 (0.10%)
- British: 17 (0.10%)
- Austrian: 15 (0.09%)
- French Canadian: 13 (0.08%)
- West Indian: 12 (0.07%)
- Israeli: 9 (0.05%)
Most common places of birth for foreign-born residents (%):
| Converse: | 37.6% (942) |
| Texas: | 48.4% (2,411,723) |
| Converse: | 7.5% (187) |
| Texas: | 1.8% (87,382) |
| Converse: | 5.9% (147) |
| Texas: | 0.4% (18,642) |
| Converse: | 5.7% (144) |
| Texas: | 0.3% (15,368) |
| Converse: | 3.5% (89) |
| Texas: | 1.2% (60,172) |
| Converse: | 3.3% (83) |
| Texas: | 2.1% (103,148) |
| Converse: | 3.3% (83) |
| Texas: | 0.3% (13,763) |
| Converse: | 2.7% (68) |
| Texas: | 0.2% (9,838) |
| Converse: | 2.4% (61) |
| Texas: | 0.1% (6,336) |
| Converse: | 2.4% (60) |
| Texas: | 0.4% (17,796) |
| Converse: | 2.1% (53) |
| Texas: | 0.2% (7,897) |
| Converse: | 2.1% (52) |
| Texas: | 1.9% (96,110) |
| Converse: | 1.8% (46) |
| Texas: | 0.2% (12,456) |
| Converse: | 1.8% (46) |
| Texas: | 0.3% (13,197) |
| Converse: | 1.8% (45) |
| Texas: | 1.1% (55,371) |
| Converse: | 1.8% (44) |
| Texas: | 0.3% (16,984) |
| Converse: | 1.6% (39) |
| Texas: | 0.0% (996) |
Place of birth for U.S.-born residents:
- This state: 16,637
- Other state: 8,427
- Northeast: 1,316
- Midwest: 1,923
- South: 2,264
- West: 2,933
86.9% of Converse residents lived in the same house 1 years ago.
Out of people who lived in different houses, 32.3% lived in this county.
Out of people who lived in different counties, 35.5% lived in Texas.
| Converse: | 86.9% |
| State average: | 85.7% |
Education attainment for males 25 years and older:
- No schooling: 137
- Nursery to 4th grade: 0
- 5th and 6th grade: 33
- 7th and 8th grade: 114
- 9th grade: 64
- 10th grade: 44
- 11th grade: 25
- 12th grade, no diploma: 86
- High school graduate (or equivalency): 2,237
- Less than 1 year of college: 750
- Some college more than 1 year, no degree: 1,419
- Associate degree: 940
- Bachelor's degree: 1,841
- Master's degree: 804
- Professional school degree: 100
- Doctorate degree: 59

Education attainment for females 25 years and older:
- No schooling: 101
- Nursery to 4th grade: 38
- 5th and 6th grade: 45
- 7th and 8th grade: 39
- 9th grade: 54
- 10th grade: 124
- 11th grade: 160
- 12th grade, no diploma: 89
- High school graduate (or equivalency): 1,971
- Less than 1 year of college: 728
- Some college more than 1 year, no degree: 1,670
- Associate degree: 1,000
- Bachelor's degree: 1,915
- Master's degree: 983
- Professional school degree: 87
- Doctorate degree: 66


Housing units in structures:
- One, detached: 8,772
- One, attached: 73
- 3 or 4: 90
- 5 to 9: 224
- 10 to 19: 588
- 20 to 49: 162
- 50 or more: 185
- Mobile homes: 80
Housing units lacking complete kitchen facilities in 2022: 0.4%
House/condo owner moved in on average 7 years ago
Renter moved in on average 1 years ago

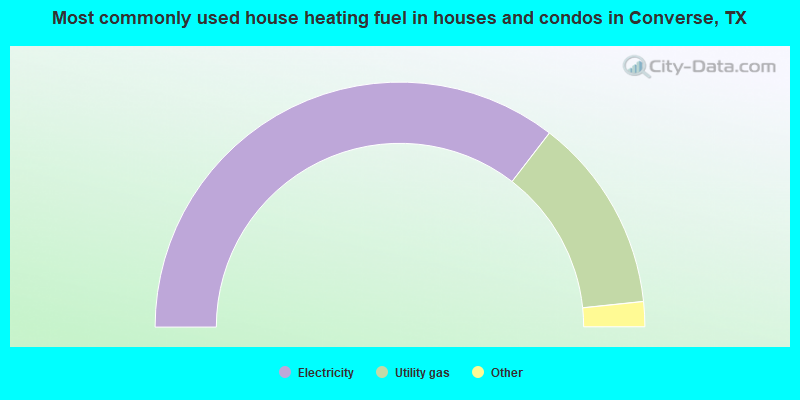
- 70.9%Electricity
- 25.8%Utility gas
- 1.7%Solar energy
- 0.9%No fuel used
- 0.6%Bottled, tank, or LP gas
- 0.2%Wood
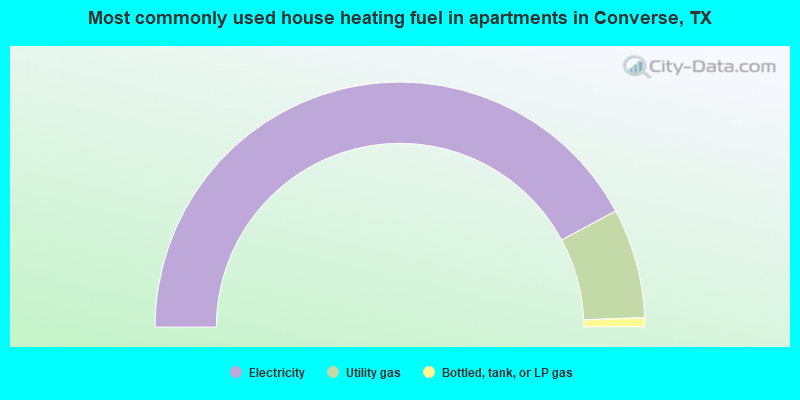
- 84.3%Electricity
- 14.5%Utility gas
- 1.2%Bottled, tank, or LP gas
Private vs. public school enrollment:
| Here: | 2.8% |
| Texas: | 8.8% |
| Here: | 4.7% |
| Texas: | 8.0% |
| Here: | 23.9% |
| Texas: | 16.2% |


