Median price asked for vacant for-sale houses and condos in 2022 in this county: $399,480.
Median contract rent in 2022: $1,020 (lower quartile is $726, upper quartile is $1,323)
Median rent asked for vacant for-rent units in 2022: $901
Median gross rent in Cornwall, CT in 2022: $1,248
Housing units in Cornwall with a mortgage: 187 (13 second mortgage, 25 home equity loan, 0 both second mortgage and home equity loan) Houses without a mortgage: 135
In family households: 156,490 (36,561 male householders, 14,969 female householders)
41,185 spouses, 52,814 children (49,404 natural, 1,325 adopted, 2,085 stepchildren), 2,365 grandchildren, 1,073 brothers or sisters, 1,650 parents, foster children, 1,216 other relatives, 3,500 non-relatives
In nonfamily households: 30,633 (11,692 male householders (9,019 living alone)), 13,418 female householders (11,384 living alone)), 5,523 nonrelatives
In group quarters: 2,804 (1,566 institutionalized population)
34,479 married couples with children.
7,472 single-parent households (1,895 men, 5,577 women).
93.3% of residents of Cornwall speak English at home.
1.6% of residents speak Spanish at home (86% speak English very well, 14% speak English not well).
4.3% of residents speak other Indo-European language at home (92% speak English very well, 8% speak English well).
0.2% of residents speak Asian or Pacific Island language at home (67% speak English very well, 33% speak English well).
0.5% of residents speak other language at home (100% speak English very well).
Foreign born population: 146 (8.4%)
(76.7% of them are naturalized citizens)
Year of entry for the foreign-born population in Cornwall, Connecticut
51995 to March 2000
91990 to 1994
81985 to 1989
131980 to 1984
61975 to 1979
71970 to 1974
51965 to 1969
35Before 1965
First ancestries reported:
English: 374 (20.7%)
Irish: 265 (14.7%)
German: 251 (13.9%)
Other: 210 (11.6%)
Italian: 102 (5.7%)
United States: 90 (5.0%)
Scottish: 84 (4.7%)
French: 79 (4.4%)
Russian: 67 (3.7%)
Swedish: 60 (3.3%)
Polish: 55 (3.0%)
Dutch: 31 (1.7%)
Scotch-Irish: 26 (1.4%)
Hungarian: 20 (1.1%)
Lithuanian: 18 (1.0%)
Welsh: 15 (0.8%)
French Canadian: 14 (0.8%)
Norwegian: 11 (0.6%)
Swiss: 8 (0.4%)
Arab: 6 (0.3%)
Czech: 6 (0.3%)
Greek: 4 (0.2%)
Danish: 2 (0.1%)
Slovak: 2 (0.1%)
Ukrainian: 2 (0.1%)
West Indian: 2 (0.1%)
Most common places of birth for foreign-born residents (%):
United Kingdom
Cornwall:
26.1% (23)
Connecticut:
4.4% (16,395)
France
Cornwall:
12.5% (11)
Connecticut:
0.7% (2,742)
Germany
Cornwall:
11.4% (10)
Connecticut:
3.1% (11,432)
Korea
Cornwall:
6.8% (6)
Connecticut:
1.5% (5,508)
Philippines
Cornwall:
6.8% (6)
Connecticut:
1.7% (6,247)
India
Cornwall:
4.5% (4)
Connecticut:
4.1% (15,108)
Brazil
Cornwall:
4.5% (4)
Connecticut:
2.8% (10,379)
Czechoslovakia (includes Czech Republic and Slovakia)
Cornwall:
3.4% (3)
Connecticut:
0.5% (1,693)
Hungary
Cornwall:
3.4% (3)
Connecticut:
0.7% (2,646)
Iran
Cornwall:
3.4% (3)
Connecticut:
0.4% (1,513)
Canada
Cornwall:
3.4% (3)
Connecticut:
5.2% (19,083)
Ireland
Cornwall:
2.3% (2)
Connecticut:
1.2% (4,344)
Russia
Cornwall:
2.3% (2)
Connecticut:
1.4% (5,021)
Other Northern Africa
Cornwall:
2.3% (2)
Connecticut:
0.3% (1,005)
Other Australian and New Zealand Subregion
Cornwall:
2.3% (2)
Connecticut:
0.1% (291)
Colombia
Cornwall:
2.3% (2)
Connecticut:
3.2% (12,009)
Other Northern America
Cornwall:
2.3% (2)
Connecticut:
0.0% (178)
Place of birth for U.S.-born residents:
This state: 702
Other state: 626
Northeast: 434
Midwest: 71
South: 73
West: 48
63% of Cornwall residents lived in the same house 5 years ago. Out of people who lived in different houses, 57% lived in this county. Out of people who lived in different counties, 30% lived in Connecticut.
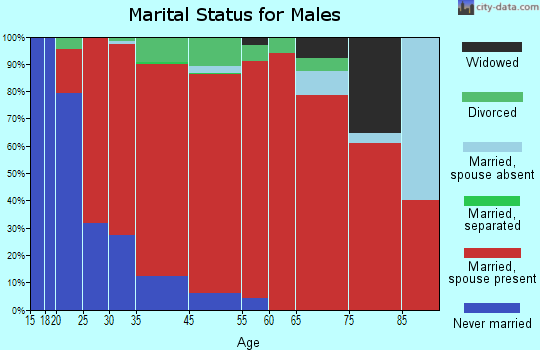
Education attainment for males 25 years and older:
No schooling: 2
Nursery to 4th grade: 0
5th and 6th grade: 4
7th and 8th grade: 3
9th grade: 1
10th grade: 3
11th grade: 2
12th grade, no diploma: 13
High school graduate (or equivalency): 99
Less than 1 year of college: 36
Some college more than 1 year, no degree: 69
Associate degree: 34
Bachelor's degree: 128
Master's degree: 62
Professional school degree: 26
Doctorate degree: 14
Education attainment for females 25 years and older:
No schooling: 5
Nursery to 4th grade: 0
5th and 6th grade: 0
7th and 8th grade: 0
9th grade: 7
10th grade: 0
11th grade: 6
12th grade, no diploma: 8
High school graduate (or equivalency): 118
Less than 1 year of college: 26
Some college more than 1 year, no degree: 78
Associate degree: 34
Bachelor's degree: 135
Master's degree: 96
Professional school degree: 23
Doctorate degree: 10
Housing units in structures:
One, detached: 815
One, attached: 16
Two: 25
3 or 4: 10
5 to 9: 2
50 or more: 3
Boats, RVs, vans, etc.: 2
Housing units lacking complete plumbing facilities: 1.4%
Housing units lacking complete kitchen facilities: 1.4%