East Haddam, CT (Connecticut) Houses and Residents
| East Haddam: | $368,603 |
| Connecticut: | $347,200 |
Total population: 9,126 (Urban population: 269 (all inside urban clusters), Rural population: 8,064 (19 farm, 8,045 nonfarm))
Houses: 4,015 (3,174 occupied: 2,680 owner occupied, 494 renter occupied)
| % of renters here: | 16% |
| State: | 34% |
Housing density: 74 houses/condos per square mile
Median price asked for vacant for-sale houses and condos in 2022 in this county: $431,754.
Median contract rent in 2022: $1,217 (lower quartile is $1,039, upper quartile is $1,542)
Median gross rent in East Haddam, CT in 2022: $1,352
Housing units in East Haddam with a mortgage: 1,781 (205 second mortgage, 290 home equity loan, 16 both second mortgage and home equity loan)
Houses without a mortgage: 547
Compare current foreclosures near East Haddam, CT:
| Photo | Address | Area | Beds / Baths | Price | Details |
|---|---|---|---|---|---|

|
#1
Haywardville Rd
East Haddam, CT 06423
|
1,132 sq. feet
|
1 baths 3 beds |
show details | |

|
#2
Woodmont Cir
East Haddam, CT 06423
|
2,128 sq. feet
|
2 baths 3 beds |
show details | |

|
#3
Parker Rd
East Haddam, CT 06423
|
1,336 sq. feet
|
2 baths 3 beds |
show details | |

|
#4
Honey Hill Rd
East Haddam, CT 06423
|
- sq. feet
|
- baths - beds |
show details | |

|
#5
Shanaghans Rd
East Haddam, CT 06423
|
- sq. feet
|
- baths - beds |
show details | |

|
#6
Railroad Ave
Chester, CT 06412
|
2,092 sq. feet
|
2 baths 4 beds |
$484,900
|
show details |

|
#7
Westchester Rd
Colchester, CT 06415
|
900 sq. feet
|
1 baths 2 beds |
$309,900
|
show details |

|
#8
Lake Dr E
Oakdale, CT 06370
|
1,346 sq. feet
|
1 baths 3 beds |
$365,000
|
show details |

|
#9
Hammond Ct
Colchester, CT 06415
|
1,152 sq. feet
|
1 baths 3 beds |
show details | |

|
#10
Hope Valley Rd
Amston, CT 06231
|
2,128 sq. feet
|
2 baths 3 beds |
show details |
| Photo | Address | Area | Beds / Baths | Price | Details |
|---|---|---|---|---|---|

|
#11
Jones Hollow Rd
Marlborough, CT 06447
|
1,984 sq. feet
|
2 baths 3 beds |
show details | |

|
#12
Leonard Bridge Rd
Lebanon, CT 06249
|
1,798 sq. feet
|
1 baths 2 beds |
show details | |

|
#13
E Main St
Middletown, CT 06457
|
1,736 sq. feet
|
2 baths 3 beds |
show details | |

|
#14
Mountain Rd
Colchester, CT 06415
|
3,158 sq. feet
|
3 baths 3 beds |
show details | |

|
#15
Park Rd
Marlborough, CT 06447
|
1,134 sq. feet
|
1 baths 3 beds |
show details | |

|
#16
Old Acres Rd
Moodus, CT 06469
|
1,298 sq. feet
|
2 baths 3 beds |
show details | |

|
#17
Butternut St
Middletown, CT 06457
|
1,498 sq. feet
|
1 baths 4 beds |
show details | |

|
#18
Main St
Cromwell, CT 06416
|
1,452 sq. feet
|
1 baths 3 beds |
show details | |

|
#19
Salem Dr
Cromwell, CT 06416
|
1,218 sq. feet
|
2 baths 2 beds |
show details | |

|
#20
Balawender Dr # 1
Norwich, CT 06360
|
2,052 sq. feet
|
2 baths 5 beds |
show details |
| Photo | Address | Area | Beds / Baths | Price | Details |
|---|---|---|---|---|---|

|
#21
Main St
Middlefield, CT 06455
|
1,526 sq. feet
|
2 baths 3 beds |
show details | |

|
#22
Opening Hill Rd
Madison, CT 06443
|
2,196 sq. feet
|
2 baths 4 beds |
show details | |

|
#23
Horse Pond Rd
Madison, CT 06443
|
1,474 sq. feet
|
2 baths 3 beds |
show details | |

|
#24
Long Hill Rd
Middletown, CT 06457
|
1,360 sq. feet
|
1 baths 3 beds |
show details | |

|
#25
Oakwood Rd
Niantic, CT 06357
|
1,104 sq. feet
|
1 baths 3 beds |
show details | |

|
#26
Washington Rd
Cromwell, CT 06416
|
1,316 sq. feet
|
1 baths 2 beds |
show details | |

|
#27
Peters Ln
Rockfall, CT 06481
|
1,425 sq. feet
|
1 baths 3 beds |
show details | |

|
#28
Pearl St
Middletown, CT 06457
|
2,832 sq. feet
|
2 baths 4 beds |
show details | |

|
#29
Pond Circle Rd
Westbrook, CT 06498
|
2,714 sq. feet
|
2 baths 4 beds |
show details | |

|
#30
Markham St
Middletown, CT 06457
|
960 sq. feet
|
1 baths 3 beds |
show details |
| Photo | Address | Area | Beds / Baths | Price | Details |
|---|---|---|---|---|---|

|
#31
Washington St # 9
Middletown, CT 06457
|
880 sq. feet
|
1 baths 2 beds |
show details | |

|
#32
Moxley Rd
Uncasville, CT 06382
|
1,118 sq. feet
|
2 baths 3 beds |
show details | |

|
#33
Christina Ct
Clinton, CT 06413
|
2,875 sq. feet
|
2 baths 4 beds |
show details | |

|
#34
Evergreen Dr
Clinton, CT 06413
|
1,344 sq. feet
|
1 baths 3 beds |
show details | |

|
#35
Society Rd
Niantic, CT 06357
|
1,248 sq. feet
|
2 baths 4 beds |
show details | |

|
#36
Middlefield St
Middletown, CT 06457
|
1,288 sq. feet
|
1 baths 3 beds |
show details | |

|
#37
S View Ter
Old Saybrook, CT 06475
|
952 sq. feet
|
1 baths 3 beds |
show details | |

|
#38
Lookout Hill Rd
Old Saybrook, CT 06475
|
1,760 sq. feet
|
2 baths 3 beds |
show details | |

|
#39
Middlefield St
Middletown, CT 06457
|
1,318 sq. feet
|
1 baths 3 beds |
show details | |

|
#40
Barry Ct
Middletown, CT 06457
|
912 sq. feet
|
1 baths 2 beds |
show details |
| Photo | Address | Area | Beds / Baths | Price | Details |
|---|---|---|---|---|---|

|
#41
Nooks Hill Rd
Cromwell, CT 06416
|
1,864 sq. feet
|
2 baths 5 beds |
show details | |

|
#42
Meech Rd
Middletown, CT 06457
|
1,075 sq. feet
|
1 baths 3 beds |
show details | |

|
#43
Partridge Lndg
Glastonbury, CT 06033
|
3,177 sq. feet
|
3 baths 4 beds |
show details | |

|
#44
Woodsvale Rd
Madison, CT 06443
|
1,700 sq. feet
|
2 baths 4 beds |
show details | |

|
#45
Ferry Ln
South Glastonbury, CT 06073
|
1,385 sq. feet
|
2 baths 3 beds |
show details | |

|
#46
Starr St
Norwich, CT 06360
|
2,207 sq. feet
|
2 baths 4 beds |
show details | |

|
#47
Mohegan Avenue Pkwy
Quaker Hill, CT 06375
|
1,330 sq. feet
|
1 baths 3 beds |
show details | |

|
#48
Seminole Rd
Middlefield, CT 06455
|
576 sq. feet
|
2 baths 2 beds |
show details | |

|
#49
Old Main St
Rocky Hill, CT 06067
|
1,168 sq. feet
|
2 baths 2 beds |
show details | |

|
Check over 1 million property listings on Foreclosure.com!
|
browse all offers | |||

 | Current Real estate markets (3987 replies) |
| Old Colonial Homes/Country Living/Schools in CT (58 replies) |
| 2024 Connecticut Town Tournament VI (Celebrating the 10-Year Anniversary & Dazzleman's Memorial) (813 replies) |
| Weekend home in CT or Long Island? Can you guys help me make a decision? (54 replies) |
| New Yorkers buying Connecticut Homes (31 replies) |
| Connecticut TOWN TOURNAMENT V (2022) (831 replies) |

Household type by relationship:
Households: 160,591- In family households: 131,621 (30,370 male householders, 13,373 female householders)
34,891 spouses, 44,052 children (41,443 natural, 1,059 adopted, 1,550 stepchildren), 1,876 grandchildren, 1,018 brothers or sisters, 1,359 parents, foster children, 1,032 other relatives, 2,795 non-relatives
- In nonfamily households: 28,970 (10,508 male householders (8,006 living alone)), 12,951 female householders (10,912 living alone)), 5,511 nonrelatives
- In group quarters: 5,085 (1,881 institutionalized population)
26,910 married couples with children.
6,210 single-parent households (1,312 men, 4,898 women).
94.2% of residents of East Haddam speak English at home.
0.8% of residents speak Spanish at home (100% speak English very well).
5.0% of residents speak other Indo-European language at home (70% speak English very well, 28% speak English well, 3% speak English not well).
Foreign born population: 359 (3.6%)
(88.3% of them are naturalized citizens)
| Here: | 7.1 |
| State: | 6.5 |
| Here: | 4.6 |
| State: | 4.0 |

- Bedrooms in owner-occupied houses and condos in East Haddam, Connecticut
- 24no bedroom
- 981 bedroom
- 4442 bedrooms
- 1,4603 bedrooms
- 5284 bedrooms
- 1265+ bedrooms

- Bedrooms in renter-occupied apartments in East Haddam, Connecticut
- 13no bedroom
- 1431 bedroom
- 1822 bedrooms
- 893 bedrooms
- 424 bedrooms
- 255+ bedrooms

- Cars and other vehicles available in East Haddam in owner-occupied houses/condos
- 56no vehicle
- 4581 vehicle
- 1,3272 vehicles
- 5613 vehicles
- 2234 vehicles
- 555+ vehicles

- Cars and other vehicles available in East Haddam in renter-occupied apartments
- 62no vehicle
- 1471 vehicle
- 1792 vehicles
- 863 vehicles
- 204 vehicles
- 05+ vehicles

- Rooms in owner-occupied houses in East Haddam, Connecticut
- 111 room
- 132 rooms
- 363 rooms
- 1704 rooms
- 4365 rooms
- 7556 rooms
- 4927 rooms
- 3618 rooms
- 4069+ rooms

- Rooms in renter-occupied apartments in East Haddam, Connecticut
- 131 room
- 212 rooms
- 1163 rooms
- 1124 rooms
- 1225 rooms
- 406 rooms
- 327 rooms
- 138 rooms
- 259+ rooms


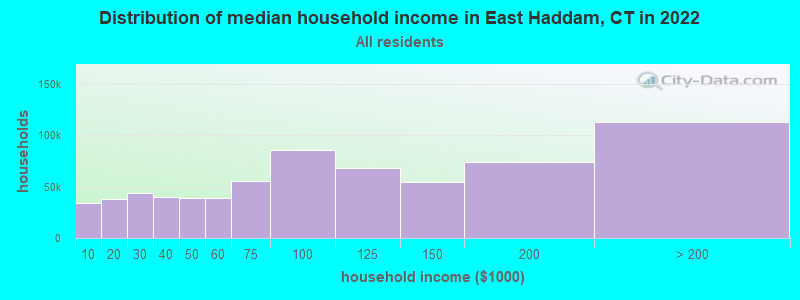
East Haddam, CT household income distribution

- 11,740Less than $10,000
- 12,023$10,000 to $19,999
- 14,957$20,000 to $29,999
- 15,338$30,000 to $39,999
- 14,082$40,000 to $49,999
- 14,985$50,000 to $59,999
- 24,296$60,000 to $74,999
- 36,545$75,000 to $99,999
- 31,476$100,000 to $124,999
- 25,260$125,000 to $149,999
- 35,504$150,000 to $199,999
- 59,633$200,000 or more
Percentage of workers working in this county: 57.9%
Number of people working at home: 975 (18.5% of all workers)
Travel time to work (commute)
- Less than 5 minutes: 183
- 5 to 9 minutes: 327
- 10 to 14 minutes: 344
- 15 to 19 minutes: 304
- 20 to 24 minutes: 419
- 25 to 29 minutes: 301
- 30 to 34 minutes: 659
- 35 to 39 minutes: 277
- 40 to 44 minutes: 392
- 45 to 59 minutes: 829
- 60 to 89 minutes: 286
- 90 or more minutes: 57
Means of transportation to work:
- Drove a car alone: 3,835 (84.7%)
- Carpooled: 453 (10.0%)
- Bus or trolley bus: 7 (0.2%)
- Walked: 83 (1.8%)
- Worked at home: 148 (3.3%)

- Year of entry for the foreign-born population in East Haddam, Connecticut
- 01995 to March 2000
- 141990 to 1994
- 01985 to 1989
- 301980 to 1984
- 91975 to 1979
- 181970 to 1974
- 141965 to 1969
- 133Before 1965
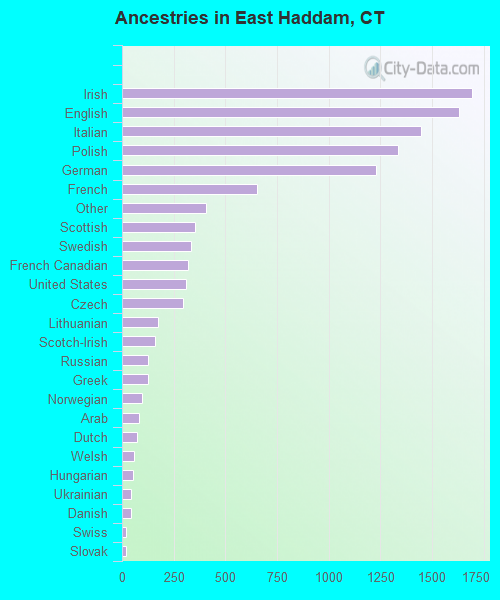
First ancestries reported:
- Irish: 1,692 (15.2%)
- English: 1,632 (14.7%)
- Italian: 1,446 (13.0%)
- Polish: 1,336 (12.0%)
- German: 1,232 (11.1%)
- French: 655 (5.9%)
- Other: 407 (3.7%)
- Scottish: 353 (3.2%)
- Swedish: 334 (3.0%)
- French Canadian: 320 (2.9%)
- United States: 309 (2.8%)
- Czech: 293 (2.6%)
- Lithuanian: 172 (1.5%)
- Scotch-Irish: 162 (1.5%)
- Russian: 127 (1.1%)
- Greek: 126 (1.1%)
- Norwegian: 97 (0.9%)
- Arab: 84 (0.8%)
- Dutch: 73 (0.7%)
- Welsh: 57 (0.5%)
- Hungarian: 52 (0.5%)
- Ukrainian: 45 (0.4%)
- Danish: 43 (0.4%)
- Swiss: 21 (0.2%)
- Slovak: 19 (0.2%)
- Portuguese: 9 (0.08%)
- West Indian: 8 (0.07%)
Most common places of birth for foreign-born residents (%):
| East Haddam: | 23.9% (52) |
| Connecticut: | 4.4% (16,395) |
| East Haddam: | 15.6% (34) |
| Connecticut: | 5.2% (19,083) |
| East Haddam: | 14.2% (31) |
| Connecticut: | 7.0% (26,023) |
| East Haddam: | 10.6% (23) |
| Connecticut: | 6.9% (25,507) |
| East Haddam: | 8.3% (18) |
| Connecticut: | 0.4% (1,303) |
| East Haddam: | 6.4% (14) |
| Connecticut: | 0.0% (178) |
| East Haddam: | 5.0% (11) |
| Connecticut: | 0.4% (1,374) |
| East Haddam: | 4.6% (10) |
| Connecticut: | 3.1% (11,432) |
| East Haddam: | 4.1% (9) |
| Connecticut: | 0.5% (1,693) |
| East Haddam: | 4.1% (9) |
| Connecticut: | 1.4% (5,021) |
| East Haddam: | 3.2% (7) |
| Connecticut: | 1.2% (4,622) |
Place of birth for U.S.-born residents:
- This state: 5,468
- Other state: 2,554
- Northeast: 1,665
- Midwest: 322
- South: 448
- West: 119
60% of East Haddam residents lived in the same house 5 years ago.
Out of people who lived in different houses, 46% lived in this county.
Out of people who lived in different counties, 63% lived in Connecticut.
Education attainment for males 25 years and older:
- No schooling: 21
- Nursery to 4th grade: 0
- 5th and 6th grade: 8
- 7th and 8th grade: 58
- 9th grade: 42
- 10th grade: 61
- 11th grade: 78
- 12th grade, no diploma: 51
- High school graduate (or equivalency): 839
- Less than 1 year of college: 191
- Some college more than 1 year, no degree: 335
- Associate degree: 249
- Bachelor's degree: 544
- Master's degree: 236
- Professional school degree: 61
- Doctorate degree: 24

Education attainment for females 25 years and older:
- No schooling: 38
- Nursery to 4th grade: 0
- 5th and 6th grade: 35
- 7th and 8th grade: 34
- 9th grade: 0
- 10th grade: 52
- 11th grade: 29
- 12th grade, no diploma: 44
- High school graduate (or equivalency): 936
- Less than 1 year of college: 261
- Some college more than 1 year, no degree: 370
- Associate degree: 298
- Bachelor's degree: 539
- Master's degree: 273
- Professional school degree: 60
- Doctorate degree: 21

Housing units in structures:
- One, detached: 3,570
- One, attached: 49
- Two: 124
- 3 or 4: 98
- 5 to 9: 94
- 10 to 19: 55
- 50 or more: 9
- Mobile homes: 16
Housing units lacking complete kitchen facilities: 4.7%

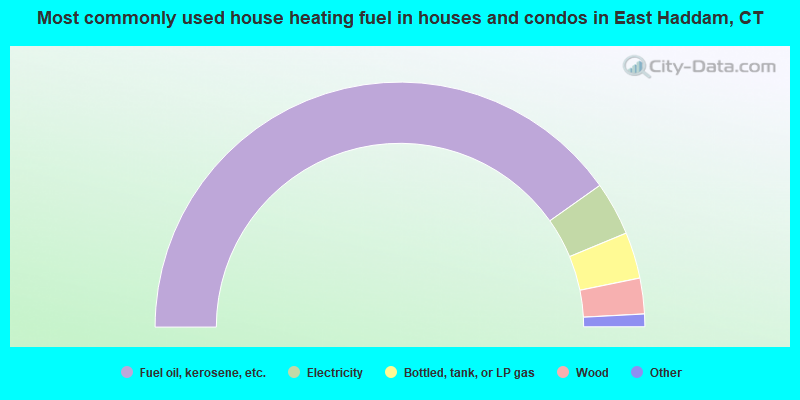
- 80.4%Fuel oil, kerosene, etc.
- 7.1%Electricity
- 6.1%Bottled, tank, or LP gas
- 4.7%Wood
- 1.3%Other fuel
- 0.4%Coal or coke
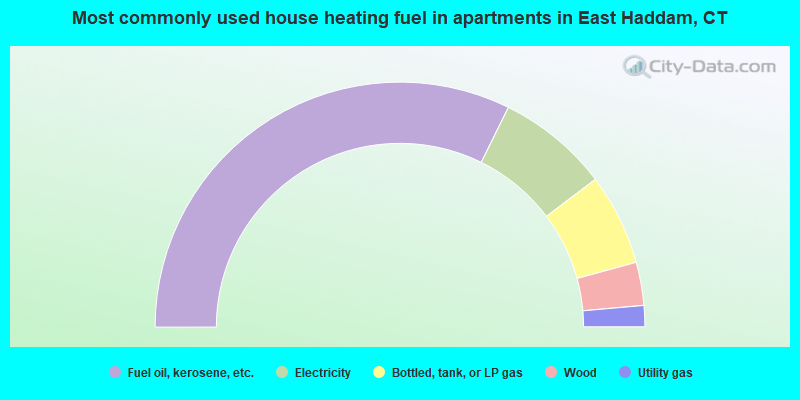
- 64.6%Fuel oil, kerosene, etc.
- 14.8%Electricity
- 12.1%Bottled, tank, or LP gas
- 5.7%Wood
- 2.8%Utility gas
Private vs. public school enrollment:
| Here: | 1.5% |
| Connecticut: | 9.9% |
| Here: | 12.9% |
| Connecticut: | 11.0% |
| Here: | 17.4% |
| Connecticut: | 33.4% |


