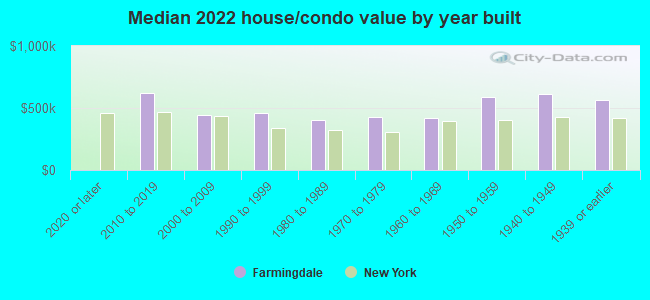
Farmingdale, NY (New York) Houses and Residents
| Farmingdale: | $523,742 |
| New York: | $400,400 |
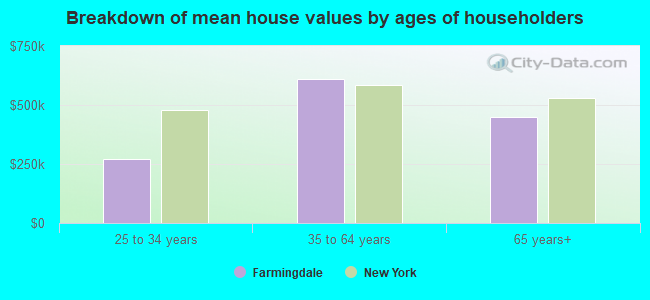
Mean price in 2022:
Detached houses: $575,321
Here: $575,321 State: $476,719 Townhouses or other attached units: $622,065
Here: $622,065 State: $699,270 In 2-unit structures: $541,380
Here: $541,380 State: $713,077 In 3-to-4-unit structures: $457,181
Here: $457,181 State: $764,568 In 5-or-more-unit structures: $201,434
Here: $201,434 State: $912,009
Total population: 8,619 (Urban population: 8,401, Rural population: 0)
Houses: 3,673 (3,542 occupied: 2,453 owner occupied, 1,083 renter occupied)
| % of renters here: | 31% |
| State: | 46% |
Housing density: 3,250 houses/condos per square mile
Median price asked for vacant for-sale houses and condos in 2022 in this county: $728,543.
Median contract rent in 2022: $1,990 (lower quartile is $1,424, upper quartile is over $2,000)
Median rent asked for vacant for-rent units in 2022: $2,016
Median gross rent in Farmingdale, NY in 2022: over $2,000
Housing units in Farmingdale with a mortgage: 1,490 (157 second mortgage, 0 home equity loan, 160 both second mortgage and home equity loan)
Houses without a mortgage: 72
Median household income for houses/condos with a mortgage: $176,875
Median household income for apartments without a mortgage: $88,802
Median monthly housing costs: $2,025
Compare current foreclosures in Farmingdale, NY:
| Photo | Address | Area | Beds / Baths | Price | Details |
|---|---|---|---|---|---|

|
#1
Wall St
Farmingdale, NY 11735
|
- sq. feet
|
1 baths 3 beds |
$442,000
|
show details |

|
#2
Boundary Ave
Farmingdale, NY 11735
|
1,474 sq. feet
|
2 baths 3 beds |
show details | |

|
#3
Intervale Ave
Farmingdale, NY 11735
|
2,649 sq. feet
|
2 baths 4 beds |
show details | |

|
#4
Eastern Pkw A
Farmingdale, NY 11735
|
2,108 sq. feet
|
2 baths - beds |
show details | |

|
#5
Lockwood Ave
Farmingdale, NY 11735
|
1,264 sq. feet
|
1 baths - beds |
show details | |

|
#6
Conklin St
Farmingdale, NY 11735
|
2,472 sq. feet
|
2 baths - beds |
show details | |

|
#7
Lawrence St
Farmingdale, NY 11735
|
1,394 sq. feet
|
1 baths - beds |
show details | |

|
#8
Pauline Dr
Farmingdale, NY 11735
|
1,613 sq. feet
|
1 baths - beds |
show details | |

|
#9
Pauline Dr
Farmingdale, NY 11735
|
1,358 sq. feet
|
1 baths - beds |
show details | |

|
#10
Stratford Grn
Farmingdale, NY 11735
|
1,736 sq. feet
|
2 baths - beds |
show details |
| Photo | Address | Area | Beds / Baths | Price | Details |
|---|---|---|---|---|---|

|
#11
Rita Pl
Farmingdale, NY 11735
|
1,615 sq. feet
|
2 baths - beds |
show details | |

|
#12
Yoakum Ave
Farmingdale, NY 11735
|
1,551 sq. feet
|
2 baths - beds |
show details | |

|
#13
Juniper St
Farmingdale, NY 11735
|
1,321 sq. feet
|
1 baths - beds |
show details | |

|
#14
Paula Dr
Farmingdale, NY 11735
|
1,196 sq. feet
|
1 baths - beds |
show details | |

|
#15
Columbia St
Farmingdale, NY 11735
|
1,400 sq. feet
|
2 baths - beds |
show details | |

|
#16
Atlantic Ave Apt 27
Farmingdale, NY 11735
|
880 sq. feet
|
1 baths - beds |
show details | |

|
#17
Eagle Ln
Farmingdale, NY 11735
|
1,453 sq. feet
|
1 baths - beds |
show details | |

|
#18
Paula Dr
Farmingdale, NY 11735
|
1,196 sq. feet
|
1 baths - beds |
show details | |

|
#19
W Oak St
Farmingdale, NY 11735
|
1,326 sq. feet
|
3 baths - beds |
show details | |

|
#20
Hemlock Dr
Farmingdale, NY 11735
|
1,561 sq. feet
|
2 baths - beds |
show details |
| Photo | Address | Area | Beds / Baths | Price | Details |
|---|---|---|---|---|---|

|
#21
Sean Michael Ct
Farmingdale, NY 11735
|
3,072 sq. feet
|
3 baths - beds |
show details | |

|
#22
Sullivan Ave
Farmingdale, NY 11735
|
1,238 sq. feet
|
2 baths - beds |
show details | |

|
#23
Main St
Farmingdale, NY 11735
|
1,960 sq. feet
|
2 baths - beds |
show details | |

|
#24
Hart St
Farmingdale, NY 11735
|
1,109 sq. feet
|
2 baths - beds |
show details | |

|
#25
Cypress St
Farmingdale, NY 11735
|
1,356 sq. feet
|
2 baths - beds |
show details | |

|
#26
Meadow Wood Ln
Farmingdale, NY 11735
|
2,143 sq. feet
|
2 baths - beds |
show details | |

|
#27
Grant St
Farmingdale, NY 11735
|
1,638 sq. feet
|
1 baths - beds |
show details | |

|
#28
2nd Ave
Farmingdale, NY 11735
|
1,337 sq. feet
|
1 baths - beds |
show details | |

|
#29
N Front St
Farmingdale, NY 11735
|
1,601 sq. feet
|
2 baths - beds |
show details | |

|
#30
Yoakum Ave
Farmingdale, NY 11735
|
1,551 sq. feet
|
2 baths - beds |
show details |
| Photo | Address | Area | Beds / Baths | Price | Details |
|---|---|---|---|---|---|

|
#31
Albatros Rd
Farmingdale, NY 11735
|
- sq. feet
|
- baths - beds |
show details | |

|
#32
Jervis Ave
Farmingdale, NY 11735
|
- sq. feet
|
- baths - beds |
show details | |

|
#33
Vanderwater St
Farmingdale, NY 11735
|
- sq. feet
|
- baths - beds |
show details | |

|
#34
Fulton St Apt 16
Farmingdale, NY 11735
|
- sq. feet
|
- baths - beds |
show details | |

|
#35
Jupiner St
Farmingdale, NY 11735
|
- sq. feet
|
- baths - beds |
show details | |

|
#36
Genova Ct
Farmingdale, NY 11735
|
- sq. feet
|
- baths - beds |
show details | |

|
#37
Eastern Pkwy # 3
Farmingdale, NY 11735
|
- sq. feet
|
- baths - beds |
show details | |

|
#38
Secatogue Ave
Farmingdale, NY 11735
|
- sq. feet
|
- baths - beds |
show details | |

|
#39
S Front St # 304
Farmingdale, NY 11735
|
- sq. feet
|
- baths - beds |
show details | |

|
#40
Fulton St Apt 47
Farmingdale, NY 11735
|
- sq. feet
|
- baths - beds |
show details |
| Photo | Address | Area | Beds / Baths | Price | Details |
|---|---|---|---|---|---|

|
#41
Main St Apt 8
Farmingdale, NY 11735
|
- sq. feet
|
- baths - beds |
show details | |

|
#42
Genova Ct
Farmingdale, NY 11735
|
- sq. feet
|
- baths - beds |
show details | |

|
#43
Birch Cir N
Farmingdale, NY 11735
|
- sq. feet
|
- baths - beds |
show details | |

|
#44
Locust Ave E
Farmingdale, NY 11735
|
- sq. feet
|
- baths - beds |
show details | |

|
#45
Monroe St
Farmingdale, NY 11735
|
- sq. feet
|
- baths - beds |
show details | |

|
#46
Wall St
Farmingdale, NY 11735
|
- sq. feet
|
- baths - beds |
show details | |

|
#47
Walnut Ave E
Farmingdale, NY 11735
|
- sq. feet
|
- baths - beds |
show details | |

|
#48
Walnut Ave E
Farmingdale, NY 11735
|
- sq. feet
|
- baths - beds |
show details | |

|
#49
Avenue I
Farmingdale, NY 11735
|
- sq. feet
|
- baths - beds |
show details | |

|
Check over 1 million property listings on Foreclosure.com!
|
browse all offers | |||

Latest news about housing in Farmingdale, NY collected exclusively by city-data.com from local newspapers, TV, and radio stations

 | Apartments rentals along LIRR (Farmingdale, Wyandanch, Huntington) (4 replies) |
| $100k salary in Farmingdale + nearby housing options (145 replies) |
| Another Thread with bad neighbors - Islip Area (Brentwood) (53 replies) |
| Farmingdale/Levittown Coops & Condos (14 replies) |
| Furnished apartment to rent in Long Island , no kids (20 replies) |
| private home illegal rentals (30 replies) |
Median year apartment built: 1985
Household type by relationship:
Households: 8,395- Male householders: 1,896 (424 living alone), Female householders: 1,615 (821 living alone)
1,587 spouses (1,568 opposite-sex spouses), 223 unmarried partners, (205 opposite-sex unmarried partners), 2,252 children (2,207 natural, 20 adopted, 23 stepchildren), 54 grandchildren, 125 brothers or sisters, 80 parents, 0 foster children, 208 other relatives, 205 non-relatives
- In group quarters: 145
Size of family households: 739 2-persons, 705 3-persons, 314 4-persons, 213 5-persons, 43 6-persons.
Size of nonfamily households: 1,299 1-person, 222 2-persons, 6 3-persons, 12 4-persons.
1,089 married couples with children.
195 single-parent households (70 men, 125 women).
81.4% of residents of Farmingdale speak English at home.
7.5% of residents speak Spanish at home (70% speak English very well, 28% speak English well, 2% speak English not well).
5.3% of residents speak other Indo-European language at home (87% speak English very well, 9% speak English well, 4% speak English not well).
4.7% of residents speak Asian or Pacific Island language at home (50% speak English very well, 30% speak English well, 21% speak English not well).
0.3% of residents speak other language at home (59% speak English very well, 41% speak English well).
Foreign born population: 1,129 (13.4%)
(68.1% of them are naturalized citizens)
| Here: | 6.0 |
| State: | 6.3 |
| Here: | 3.6 |
| State: | 3.8 |
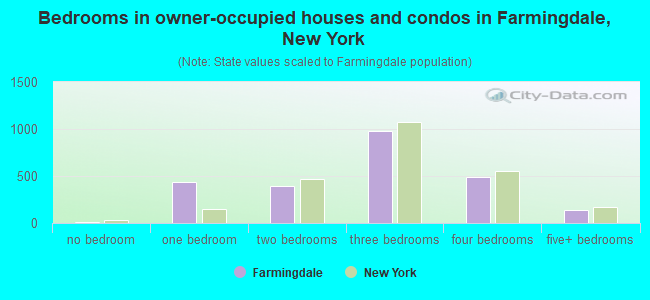
- Bedrooms in owner-occupied houses and condos in Farmingdale, New York
- 14no bedroom
- 4391 bedroom
- 3892 bedrooms
- 9843 bedrooms
- 4914 bedrooms
- 1355+ bedrooms
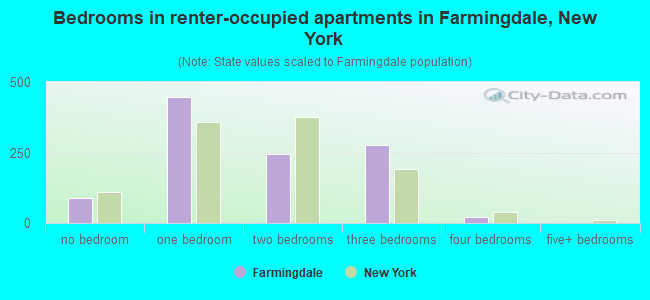
- Bedrooms in renter-occupied apartments in Farmingdale, New York
- 90no bedroom
- 4471 bedroom
- 2462 bedrooms
- 2773 bedrooms
- 234 bedrooms
- 05+ bedrooms
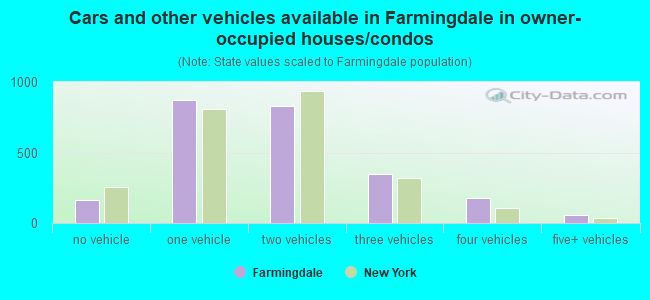
- Cars and other vehicles available in Farmingdale in owner-occupied houses/condos
- 165no vehicle
- 8741 vehicle
- 8272 vehicles
- 3473 vehicles
- 1804 vehicles
- 605+ vehicles
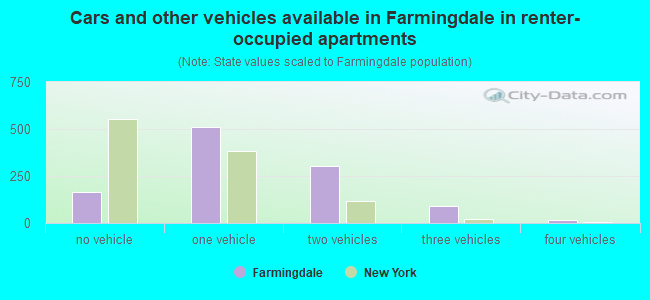
- Cars and other vehicles available in Farmingdale in renter-occupied apartments
- 165no vehicle
- 5081 vehicle
- 3032 vehicles
- 903 vehicles
- 174 vehicles
- 05+ vehicles
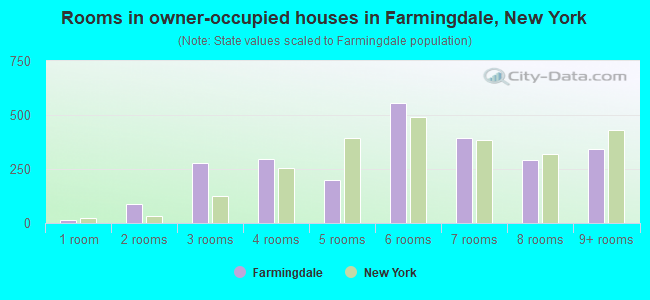
- Rooms in owner-occupied houses in Farmingdale, New York
- 141 room
- 862 rooms
- 2763 rooms
- 2984 rooms
- 1995 rooms
- 5576 rooms
- 3927 rooms
- 2918 rooms
- 3419+ rooms
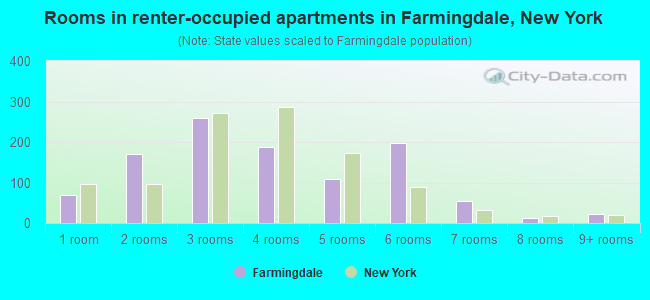
- Rooms in renter-occupied apartments in Farmingdale, New York
- 691 room
- 1712 rooms
- 2603 rooms
- 1884 rooms
- 1095 rooms
- 1986 rooms
- 557 rooms
- 128 rooms
- 229+ rooms
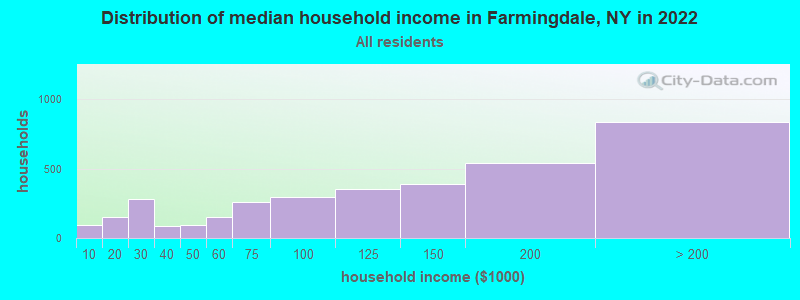
Farmingdale, NY household income distribution

- 94Less than $10,000
- 150$10,000 to $19,999
- 282$20,000 to $29,999
- 87$30,000 to $39,999
- 93$40,000 to $49,999
- 152$50,000 to $59,999
- 261$60,000 to $74,999
- 294$75,000 to $99,999
- 355$100,000 to $124,999
- 391$125,000 to $149,999
- 544$150,000 to $199,999
- 837$200,000 or more
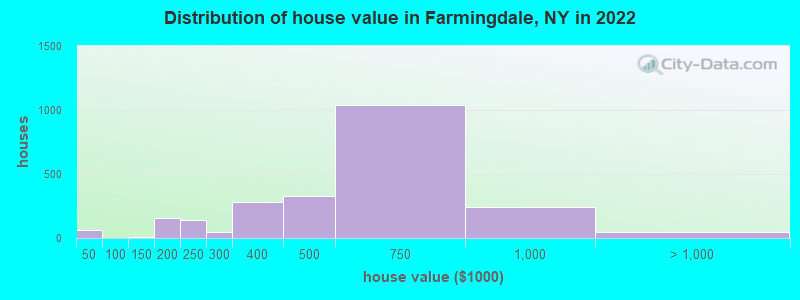
Home value of owner - occupied houses in 2022 in Farmingdale, NY
-
- 56Less than $10,000
- 4$20,000 to $24,999
- 11$125,000 to $149,999
- 111$150,000 to $174,999
- 45$175,000 to $199,999
- 140$200,000 to $249,999
- 46$250,000 to $299,999
- 283$300,000 to $399,999
- 326$400,000 to $499,999
- 1,037$500,000 to $749,999
- 244$750,000 to $999,999
- 43$1,000,000 to $1,499,999
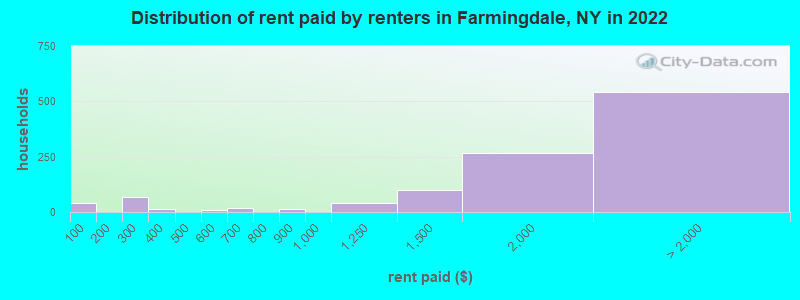
Rent paid by renters in 2022 in Farmingdale, NY
-
- 42Less than $100
- 69$200 to $249
- 12$350 to $399
- 10$550 to $599
- 8$600 to $649
- 9$650 to $699
- 14$800 to $899
- 38$1,000 to $1,249
- 98$1,250 to $1,499
- 267$1,500 to $1,999
- 134$2,000 to $2,499
- 144$2,500 to $2,999
- 199$3,000 to $3,499
- 25$3,500 or more
- 37No cash rent
Percentage of workers working in this county: 49.6%
Number of people working at home: 391 (8.2% of all workers)
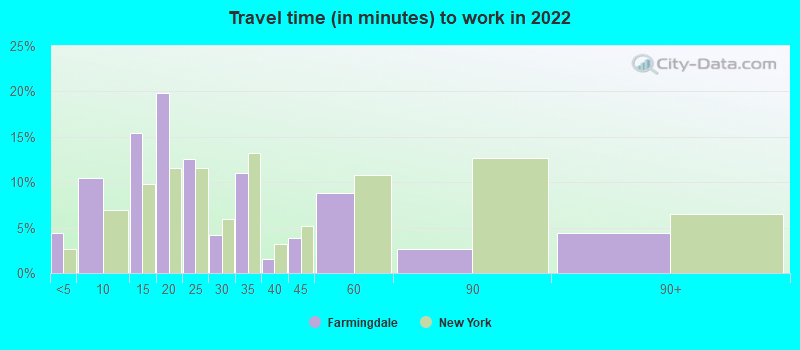
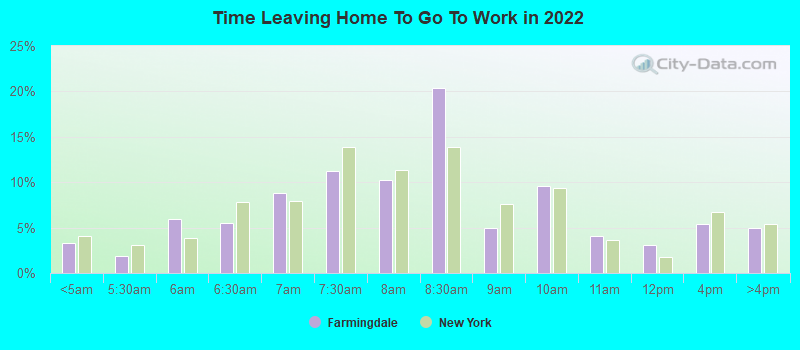
Travel time to work (commute)
- Less than 5 minutes: 90
- 5 to 9 minutes: 257
- 10 to 14 minutes: 720
- 15 to 19 minutes: 757
- 20 to 24 minutes: 556
- 25 to 29 minutes: 314
- 30 to 34 minutes: 237
- 35 to 39 minutes: 123
- 40 to 44 minutes: 28
- 45 to 59 minutes: 284
- 60 to 89 minutes: 628
- 90 or more minutes: 297
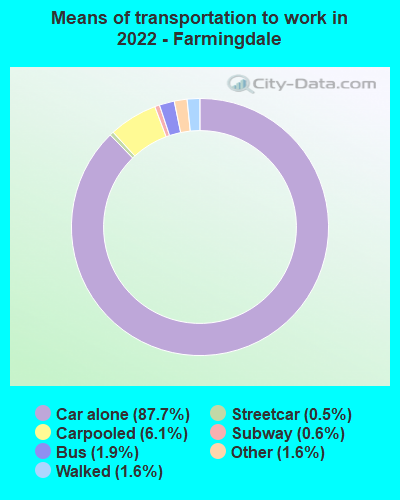
Means of transportation to work:
- Drove a car alone: 3,442 (78.3%)
- Carpooled: 232 (5.3%)
- Bus: 71 (1.6%)
- Subway or elevated rail: 18 (0.4%)
- Long-distance train or commuter rail: 19 (0.4%)
- Taxi: 89 (2.0%)
- Walked: 68 (1.5%)
- Worked at home: 391 (8.9%)
- Unemployment by race in 2022
- Unemployment rate for White non-Hispanic residents
- 2.0%Males
- 8.9%Females
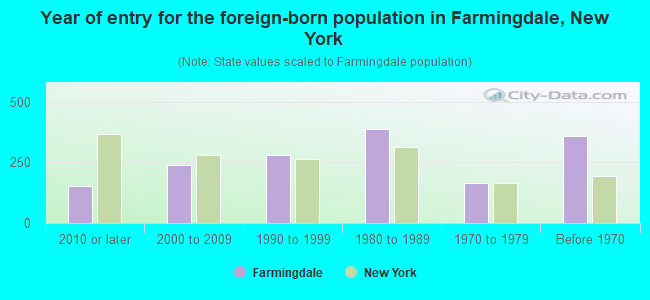
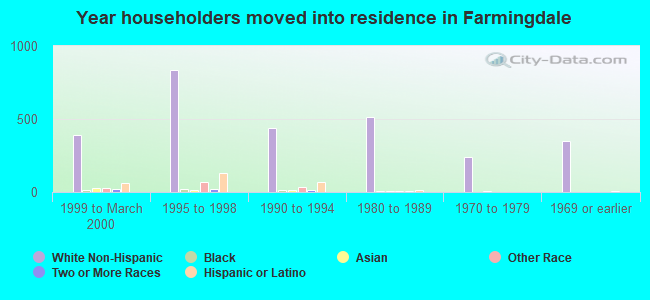
- Year of entry for the foreign-born population in Farmingdale, New York
- 1522010 or later
- 2382000 to 2009
- 2811990 to 1999
- 3871980 to 1989
- 1641970 to 1979
- 360Before 1970
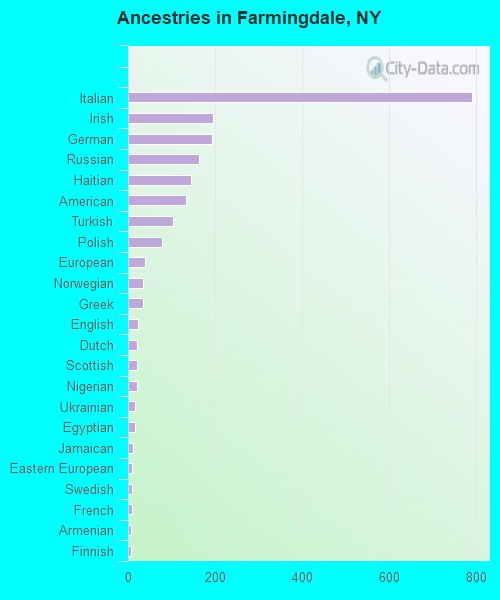
First ancestries reported:
- Italian: 790 (23.8%)
- Irish: 196 (5.9%)
- German: 194 (5.9%)
- Russian: 162 (4.9%)
- Haitian: 144 (4.3%)
- American: 134 (4.0%)
- Turkish: 103 (3.1%)
- Polish: 78 (2.4%)
- European: 40 (1.2%)
- Norwegian: 35 (1.1%)
- Greek: 34 (1.0%)
- English: 23 (0.7%)
- Dutch: 21 (0.6%)
- Scottish: 20 (0.6%)
- Nigerian: 20 (0.6%)
- Ukrainian: 16 (0.5%)
- Egyptian: 15 (0.5%)
- Jamaican: 11 (0.3%)
- Eastern European: 10 (0.3%)
- Swedish: 10 (0.3%)
- French: 9 (0.3%)
- Armenian: 8 (0.2%)
- Finnish: 8 (0.2%)
- Slovene: 5 (0.2%)
- Barbadian: 5 (0.2%)
- Slavic: 4 (0.1%)
Most common places of birth for foreign-born residents (%):
| Farmingdale: | 12.1% (132) |
| New York: | 1.2% (55,571) |
| Farmingdale: | 7.8% (85) |
| New York: | 1.8% (82,786) |
| Farmingdale: | 6.9% (75) |
| New York: | 2.4% (108,067) |
| Farmingdale: | 6.5% (71) |
| New York: | 2.8% (126,936) |
| Farmingdale: | 5.3% (58) |
| New York: | 5.0% (227,557) |
| Farmingdale: | 5.2% (57) |
| New York: | 3.8% (172,129) |
| Farmingdale: | 4.9% (53) |
| New York: | 2.0% (91,070) |
| Farmingdale: | 4.8% (52) |
| New York: | 3.5% (158,432) |
| Farmingdale: | 4.7% (51) |
| New York: | 0.6% (25,517) |
| Farmingdale: | 4.5% (49) |
| New York: | 9.1% (410,910) |
| Farmingdale: | 4.4% (48) |
| New York: | 4.8% (214,559) |
| Farmingdale: | 3.7% (40) |
| New York: | 2.5% (111,920) |
| Farmingdale: | 3.6% (39) |
| New York: | 0.2% (8,745) |
| Farmingdale: | 2.4% (26) |
| New York: | 0.9% (38,713) |
| Farmingdale: | 2.3% (25) |
| New York: | 1.8% (81,374) |
| Farmingdale: | 2.0% (22) |
| New York: | 1.4% (62,442) |
| Farmingdale: | 2.0% (22) |
| New York: | 0.6% (28,472) |
| Farmingdale: | 1.6% (17) |
| New York: | 0.5% (21,009) |
| Farmingdale: | 1.6% (17) |
| New York: | 0.3% (11,831) |
Place of birth for U.S.-born residents:
- This state: 6,867
- Other state: 265
- Northeast: 100
- Midwest: 37
- South: 85
- West: 41
91.3% of Farmingdale residents lived in the same house 1 years ago.
Out of people who lived in different houses, 36.3% lived in this county.
Out of people who lived in different counties, 95.7% lived in New York.
| Farmingdale: | 91.3% |
| State average: | 89.6% |
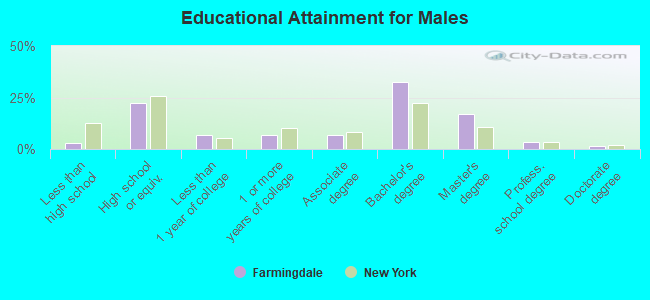
Education attainment for males 25 years and older:
- No schooling: 18
- Nursery to 4th grade: 7
- 5th and 6th grade: 41
- 7th and 8th grade: 8
- 9th grade: 0
- 10th grade: 4
- 11th grade: 17
- 12th grade, no diploma: 6
- High school graduate (or equivalency): 717
- Less than 1 year of college: 215
- Some college more than 1 year, no degree: 228
- Associate degree: 226
- Bachelor's degree: 1,057
- Master's degree: 555
- Professional school degree: 106
- Doctorate degree: 41
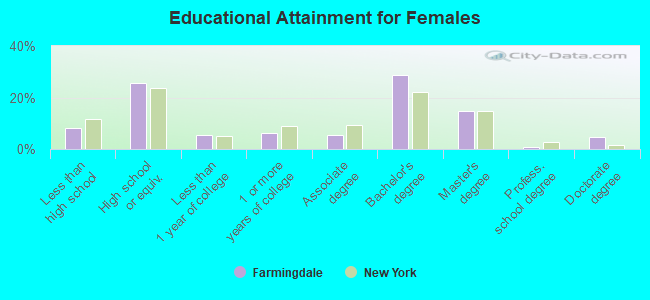
Education attainment for females 25 years and older:
- No schooling: 86
- Nursery to 4th grade: 20
- 5th and 6th grade: 10
- 7th and 8th grade: 7
- 9th grade: 0
- 10th grade: 12
- 11th grade: 21
- 12th grade, no diploma: 107
- High school graduate (or equivalency): 845
- Less than 1 year of college: 182
- Some college more than 1 year, no degree: 210
- Associate degree: 179
- Bachelor's degree: 941
- Master's degree: 482
- Professional school degree: 31
- Doctorate degree: 147
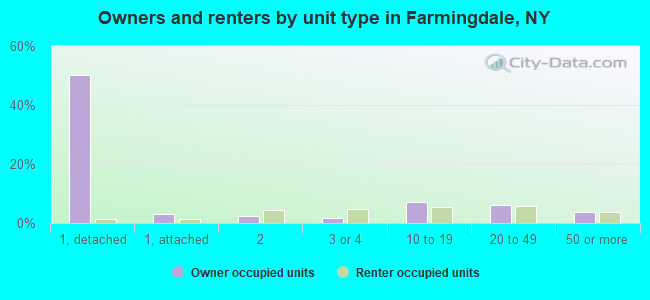
Housing units in structures:
- One, detached: 1,932
- One, attached: 195
- Two: 136
- 3 or 4: 154
- 5 to 9: 167
- 10 to 19: 335
- 20 to 49: 402
- 50 or more: 339
- Boats, RVs, vans, etc.: 8
Housing units lacking complete kitchen facilities in 2022: 0.5%
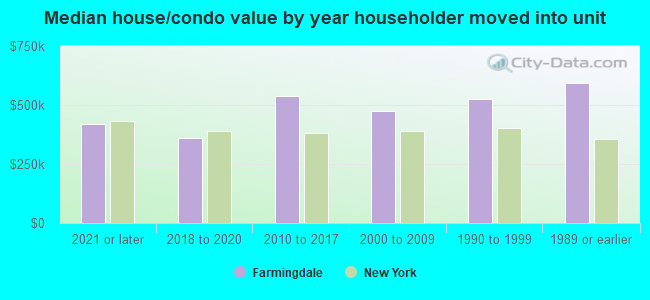
House/condo owner moved in on average 15 years ago
Renter moved in on average 3 years ago
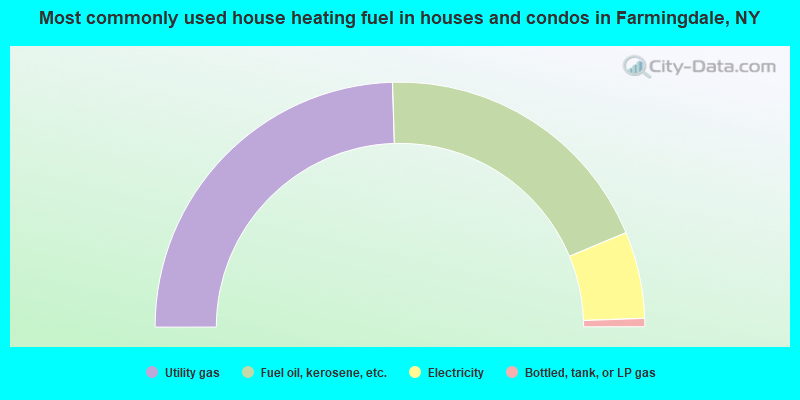
- 49.1%Utility gas
- 38.4%Fuel oil, kerosene, etc.
- 11.5%Electricity
- 1.1%Bottled, tank, or LP gas
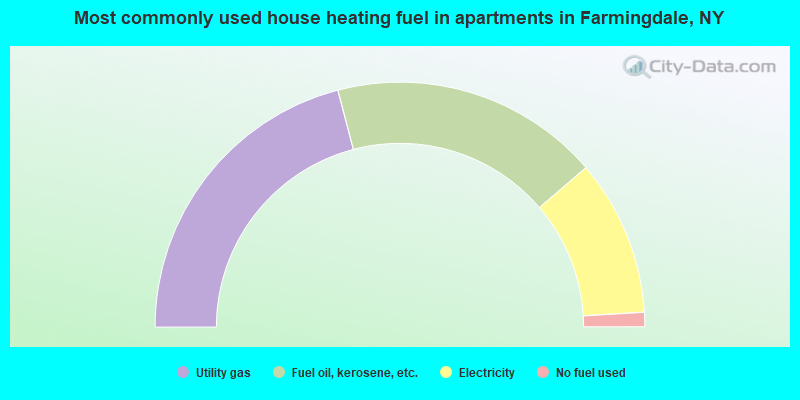
- 41.8%Utility gas
- 35.6%Fuel oil, kerosene, etc.
- 20.6%Electricity
- 1.9%No fuel used
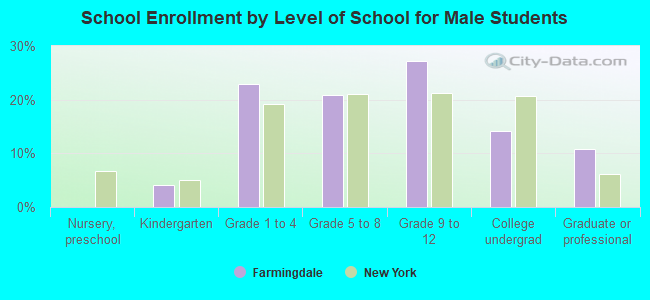
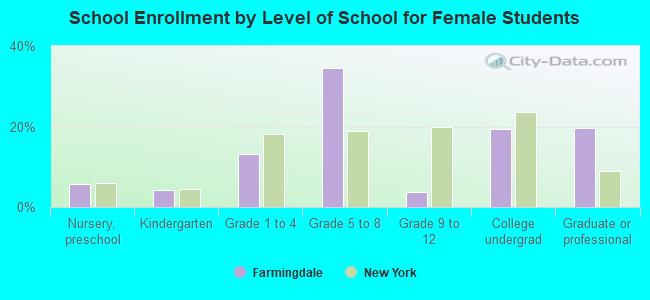
Private vs. public school enrollment:
| Here: | 0.0% |
| New York: | 15.6% |
| Here: | 6.4% |
| New York: | 15.0% |
| Here: | 45.9% |
| New York: | 39.2% |