Garrison, MD (Maryland) Houses and Residents
| Garrison: | $345,507 |
| Maryland: | $398,100 |
Mean price in 2022:
Detached houses: $843,903
Here: $843,903 State: $526,819 Townhouses or other attached units: $461,160
Here: $461,160 State: $328,305 In 3-to-4-unit structures: $279,133
Here: $279,133 State: $295,378 In 5-or-more-unit structures: $279,346
Here: $279,346 State: $350,378
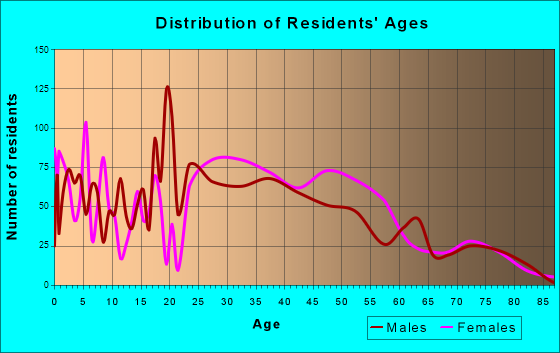
Total population: 8,823 (Urban population: 8,214, Rural population: 0)
Houses: 3,776 (3,520 occupied: 1,456 owner occupied, 2,142 renter occupied)
| % of renters here: | 60% |
| State: | 32% |
Housing density: 1,209 houses/condos per square mile
Median price asked for vacant for-sale houses and condos in 2022: $3,054,207.
Median contract rent in 2022: $1,666 (lower quartile is $1,126, upper quartile is $1,990)
Median rent asked for vacant for-rent units in 2022: $1,383
Median gross rent in Garrison, MD in 2022: $1,840
Housing units in Garrison with a mortgage: 906 (154 second mortgage, 0 home equity loan, 80 both second mortgage and home equity loan)
Houses without a mortgage: 0
Median household income for houses/condos with a mortgage: $127,080
Median household income for apartments without a mortgage: $99,518
Median monthly housing costs: $1,699
Compare current foreclosures near Garrison, MD:
| Photo | Address | Area | Beds / Baths | Price | Details |
|---|---|---|---|---|---|

|
#1
Willow Branch Way Unit 303
Owings Mills, MD 21117
|
1,200 sq. feet
|
2 baths 2 beds |
$259,000
|
show details |

|
#2
Harlem Ln
Catonsville, MD 21228
|
3,208 sq. feet
|
2 baths 4 beds |
$424,900
|
show details |

|
#3
Southern Ave
Baltimore, MD 21206
|
1,132 sq. feet
|
1 baths 3 beds |
$148,500
|
show details |

|
#4
Rossville Blvd
Rosedale, MD 21237
|
2,561 sq. feet
|
2 baths 4 beds |
$599,900
|
show details |

|
#5
Elm Ave
Glen Burnie, MD 21061
|
1,092 sq. feet
|
2 baths 3 beds |
$399,900
|
show details |

|
#6
Gwynnmore Ave
Gwynn Oak, MD 21207
|
1,955 sq. feet
|
1 baths 3 beds |
$170,000
|
show details |

|
#7
Mondawmin Ave
Baltimore, MD 21216
|
1,512 sq. feet
|
3 baths 3 beds |
$199,500
|
show details |

|
#8
S Washington St
Baltimore, MD 21231
|
1,638 sq. feet
|
2 baths 4 beds |
$349,500
|
show details |

|
#9
N Belnord Ave
Baltimore, MD 21205
|
1,040 sq. feet
|
1 baths 3 beds |
$112,900
|
show details |

|
#10
N Decker Ave
Baltimore, MD 21213
|
950 sq. feet
|
1 baths 2 beds |
$145,000
|
show details |
| Photo | Address | Area | Beds / Baths | Price | Details |
|---|---|---|---|---|---|

|
#11
W Mosher St
Baltimore, MD 21216
|
1,574 sq. feet
|
1 baths 3 beds |
$28,500
|
show details |

|
#12
E Strathmore Ave
Baltimore, MD 21214
|
1,268 sq. feet
|
2 baths 4 beds |
$314,900
|
show details |

|
#13
Beech Ave
Baltimore, MD 21211
|
1,200 sq. feet
|
1 baths 3 beds |
$179,000
|
show details |

|
#14
Francis St
Baltimore, MD 21217
|
2,038 sq. feet
|
2 baths 4 beds |
$45,500
|
show details |

|
#15
N Chapel Gate Ln
Baltimore, MD 21229
|
1,890 sq. feet
|
2 baths 3 beds |
$136,000
|
show details |

|
#16
Brooks Ln Apt 1a
Baltimore, MD 21217
|
983 sq. feet
|
2 baths 2 beds |
$134,900
|
show details |

|
#17
E 28th St
Baltimore, MD 21218
|
1,244 sq. feet
|
1 baths 2 beds |
$298,900
|
show details |

|
#18
Corkley Rd
Rosedale, MD 21237
|
1,292 sq. feet
|
2 baths 3 beds |
$364,900
|
show details |

|
#19
S Bouldin St
Baltimore, MD 21224
|
1,160 sq. feet
|
2 baths 2 beds |
$259,900
|
show details |

|
#20
N Main Street
Hampstead, MD 21074
|
1,352 sq. feet
|
2 baths 3 beds |
$169,900
|
show details |
| Photo | Address | Area | Beds / Baths | Price | Details |
|---|---|---|---|---|---|

|
#21
Wicklow Rd
Baltimore, MD 21229
|
1,152 sq. feet
|
1 baths 3 beds |
$112,000
|
show details |

|
#22
Light St
Baltimore, MD 21230
|
1,554 sq. feet
|
1 baths 2 beds |
$254,900
|
show details |

|
#23
Gorsuch Ave
Baltimore, MD 21218
|
1,380 sq. feet
|
1 baths 3 beds |
$90,000
|
show details |

|
#24
E 33rd St
Baltimore, MD 21218
|
1,500 sq. feet
|
1 baths 3 beds |
$140,000
|
show details |

|
#25
Ann Dr
Westminster, MD 21157
|
1,092 sq. feet
|
1 baths 3 beds |
$279,300
|
show details |

|
#26
Chestnut Ave
Baltimore, MD 21211
|
1,308 sq. feet
|
1 baths 3 beds |
$239,900
|
show details |

|
#27
Ardmore Ave
Parkville, MD 21234
|
2,463 sq. feet
|
2 baths 4 beds |
$360,000
|
show details |

|
#28
Annapolis Rd
Halethorpe, MD 21227
|
1,581 sq. feet
|
2 baths 4 beds |
$334,900
|
show details |

|
#29
Winston Ave
Baltimore, MD 21239
|
1,254 sq. feet
|
1 baths 3 beds |
$259,900
|
show details |

|
#30
N Curley St
Baltimore, MD 21224
|
1,008 sq. feet
|
1 baths 3 beds |
$51,000
|
show details |
| Photo | Address | Area | Beds / Baths | Price | Details |
|---|---|---|---|---|---|

|
#31
Homestead St
Baltimore, MD 21218
|
- sq. feet
|
2 baths 3 beds |
$114,400
|
show details |

|
#32
W Saratoga St
Baltimore, MD 21223
|
- sq. feet
|
1 baths 3 beds |
$29,900
|
show details |

|
#33
Cuthbert Ave
Baltimore, MD 21215
|
- sq. feet
|
1 baths 1 beds |
$12,000
|
show details |

|
#34
Middlesex Rd
Essex, MD 21221
|
1,152 sq. feet
|
2 baths 3 beds |
show details | |

|
#35
5th St
Brooklyn, MD 21225
|
1,232 sq. feet
|
1 baths - beds |
$49,900
|
show details |

|
#36
Sleepsoft Circle Arta 7216 Sleep Soft Circle
Columbia, MD 21045
|
972 sq. feet
|
3 baths 4 beds |
show details | |

|
#37
Asbury Ave
Baltimore, MD 21206
|
1,276 sq. feet
|
2 baths 4 beds |
show details | |

|
#38
Westfield Ave
Baltimore, MD 21214
|
1,326 sq. feet
|
2 baths 3 beds |
show details | |

|
#39
Mortimer Ave
Baltimore, MD 21215
|
1,344 sq. feet
|
1 baths 3 beds |
show details | |

|
#40
Arundel Rd W
Brooklyn, MD 21225
|
992 sq. feet
|
1 baths 3 beds |
show details |
| Photo | Address | Area | Beds / Baths | Price | Details |
|---|---|---|---|---|---|

|
#41
Benhill Ave
Curtis Bay, MD 21226
|
1,034 sq. feet
|
1 baths 2 beds |
show details | |

|
#42
Cole St
Baltimore, MD 21223
|
1,000 sq. feet
|
1 baths 3 beds |
show details | |

|
#43
Manor Ln
Ellicott City, MD 21042
|
864 sq. feet
|
1 baths 2 beds |
show details | |

|
#44
Putty Hill Ave
Parkville, MD 21234
|
1,358 sq. feet
|
1 baths 3 beds |
show details | |

|
#45
Cleveland St
Baltimore, MD 21230
|
1,232 sq. feet
|
1 baths 3 beds |
show details | |

|
#46
Benton Heights Ave
Baltimore, MD 21206
|
2,001 sq. feet
|
2 baths 3 beds |
show details | |

|
#47
Mactavish Ave
Baltimore, MD 21229
|
846 sq. feet
|
1 baths 2 beds |
show details | |

|
#48
Johnnycake Rd
Windsor Mill, MD 21244
|
2,000 sq. feet
|
3 baths - beds |
show details | |

|
#49
Sequoia Ave
Baltimore, MD 21215
|
1,190 sq. feet
|
3 baths 2 beds |
show details | |

|
Check over 1 million property listings on Foreclosure.com!
|
browse all offers | |||

Latest news about housing in Garrison, MD collected exclusively by city-data.com from local newspapers, TV, and radio stations

 | Wow. Why are there so many boarded up row houses ?? (22 replies) |
| Baltimore Mayor Catherine Pugh takes leave of absence for scandal (133 replies) |
| Accepted job offer in Owings Mills. Where to move? Mid-30s, no kids...yet (21 replies) |
| Population decline in baltimore (150 replies) |
| Baltimore Population Loss Study (124 replies) |
| Poll: The most dangerous strip in Baltimore? (88 replies) |
Median year apartment built: 1993
Household type by relationship:
Households: 9,711- Male householders: 1,469 (388 living alone), Female householders: 2,016 (989 living alone)
1,267 spouses (1,240 opposite-sex spouses), 172 unmarried partners, (122 opposite-sex unmarried partners), 2,751 children (2,539 natural, 46 adopted, 165 stepchildren), 208 grandchildren, 579 brothers or sisters, 300 parents, 40 foster children, 433 other relatives, 143 non-relatives
- In group quarters: 329
Size of family households: 716 2-persons, 454 3-persons, 445 4-persons, 72 5-persons, 281 7-or-more-persons.
Size of nonfamily households: 1,435 1-person, 243 2-persons.
1,399 married couples with children.
315 single-parent households (0 men, 315 women).
88.9% of residents of Garrison speak English at home.
0.3% of residents speak Spanish at home (46% speak English very well, 54% speak English well).
4.1% of residents speak other Indo-European language at home (32% speak English very well, 41% speak English well, 26% speak English not well).
1.5% of residents speak Asian or Pacific Island language at home (64% speak English very well, 36% speak English well).
6.1% of residents speak other language at home (86% speak English very well, 14% speak English well).
Foreign born population: 1,030 (10.6%)
(60.5% of them are naturalized citizens)
| Here: | 6.0 |
| State: | 7.3 |
| Here: | 4.7 |
| State: | 4.2 |

- Bedrooms in owner-occupied houses and condos in Garrison, Maryland
- 30no bedroom
- 01 bedroom
- 4792 bedrooms
- 5623 bedrooms
- 2154 bedrooms
- 1725+ bedrooms

- Bedrooms in renter-occupied apartments in Garrison, Maryland
- 102no bedroom
- 3781 bedroom
- 8482 bedrooms
- 5393 bedrooms
- 1294 bedrooms
- 1465+ bedrooms

- Cars and other vehicles available in Garrison in owner-occupied houses/condos
- 96no vehicle
- 5311 vehicle
- 6172 vehicles
- 1123 vehicles
- 1014 vehicles
- 05+ vehicles

- Cars and other vehicles available in Garrison in renter-occupied apartments
- 307no vehicle
- 8881 vehicle
- 6922 vehicles
- 2183 vehicles
- 374 vehicles
- 05+ vehicles

- Rooms in owner-occupied houses in Garrison, Maryland
- 301 room
- 02 rooms
- 263 rooms
- 2904 rooms
- 1915 rooms
- 3466 rooms
- 1237 rooms
- 2058 rooms
- 2459+ rooms

- Rooms in renter-occupied apartments in Garrison, Maryland
- 1021 room
- 1172 rooms
- 3183 rooms
- 3964 rooms
- 5105 rooms
- 3266 rooms
- 947 rooms
- 558 rooms
- 2239+ rooms


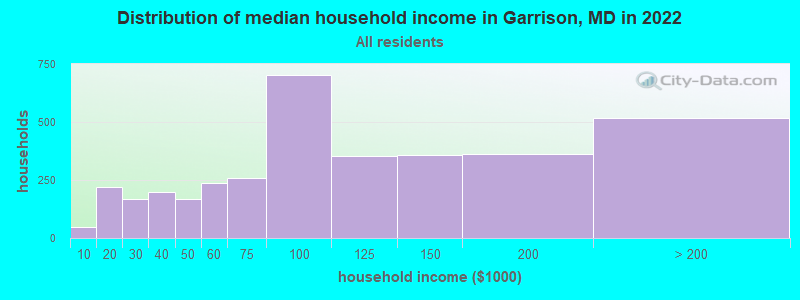
Garrison, MD household income distribution

- 48Less than $10,000
- 220$10,000 to $19,999
- 169$20,000 to $29,999
- 198$30,000 to $39,999
- 166$40,000 to $49,999
- 237$50,000 to $59,999
- 259$60,000 to $74,999
- 704$75,000 to $99,999
- 353$100,000 to $124,999
- 357$125,000 to $149,999
- 364$150,000 to $199,999
- 519$200,000 or more
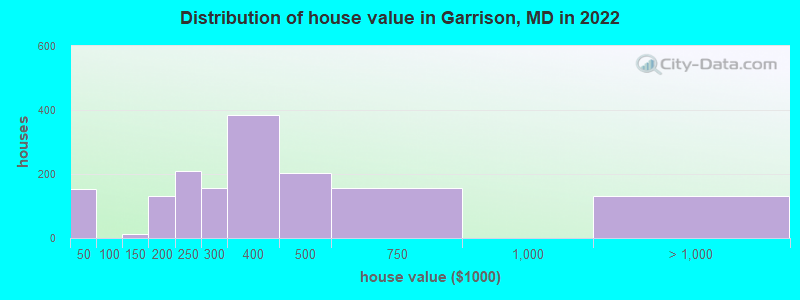
Home value of owner - occupied houses in 2022 in Garrison, MD
-
- 153Less than $10,000
- 12$125,000 to $149,999
- 116$150,000 to $174,999
- 14$175,000 to $199,999
- 207$200,000 to $249,999
- 156$250,000 to $299,999
- 383$300,000 to $399,999
- 203$400,000 to $499,999
- 155$500,000 to $749,999
- 100$1,000,000 to $1,499,999
- 18$1,500,000 to $1,999,999
- 12$2,000,000 or more
Rent paid by renters in 2022 in Garrison, MD
-
- 30$250 to $299
- 81$300 to $349
- 74$350 to $399
- 18$400 to $449
- 20$450 to $499
- 17$500 to $549
- 37$550 to $599
- 39$700 to $749
- 86$800 to $899
- 78$1,000 to $1,249
- 232$1,250 to $1,499
- 759$1,500 to $1,999
- 372$2,000 to $2,499
- 63$2,500 to $2,999
- 36$3,500 or more


Percentage of workers working in this county: 66.3%
Number of people working at home: 1,015 (21.7% of all workers)
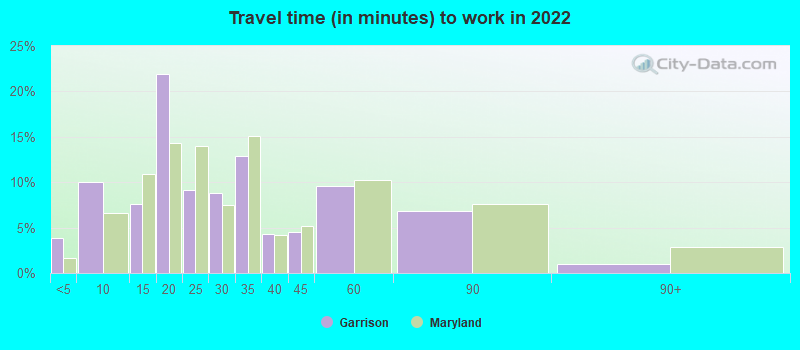
Travel time to work (commute)
- Less than 5 minutes: 126
- 5 to 9 minutes: 253
- 10 to 14 minutes: 573
- 15 to 19 minutes: 492
- 20 to 24 minutes: 130
- 25 to 29 minutes: 485
- 30 to 34 minutes: 422
- 35 to 39 minutes: 244
- 40 to 44 minutes: 234
- 45 to 59 minutes: 390
- 60 to 89 minutes: 240
- 90 or more minutes: 103
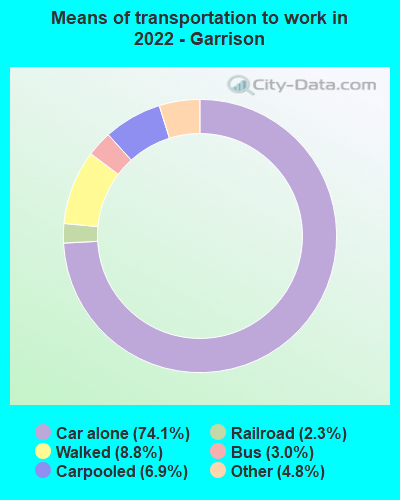
Means of transportation to work:
- Drove a car alone: 3,325 (60.0%)
- Carpooled: 357 (6.4%)
- Bus: 83 (1.5%)
- Light rail, streetcar or trolley: 105 (1.9%)
- Taxi: 260 (4.7%)
- Walked: 445 (8.0%)
- Worked at home: 1,015 (18.3%)

- Unemployment by race in 2022
- Unemployment rate for White non-Hispanic residents
- 2.0%Males
- 7.0%Females
- Unemployment rate for Black residents
- 1.7%Males
- 0.5%Females
- Unemployment rate for two or more race residents
- 21.3%Females

- Year of entry for the foreign-born population in Garrison, Maryland
- 5292010 or later
- 1392000 to 2009
- 2481990 to 1999
- 1881980 to 1989
- 1911970 to 1979
- 132Before 1970
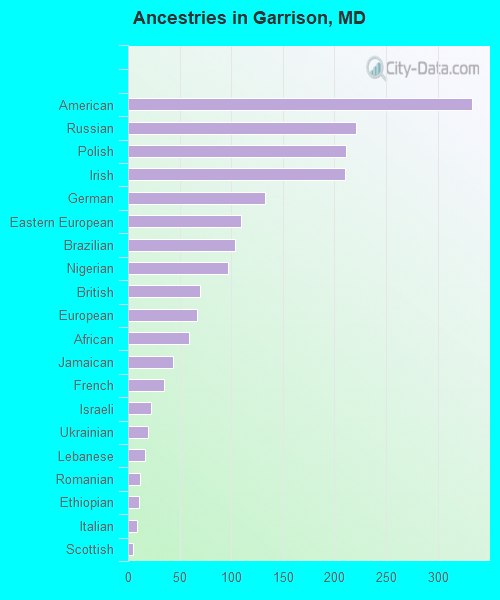
First ancestries reported:
- American: 333 (5.4%)
- Russian: 221 (3.6%)
- Polish: 211 (3.5%)
- Irish: 210 (3.4%)
- German: 133 (2.2%)
- Eastern European: 109 (1.8%)
- Brazilian: 104 (1.7%)
- Nigerian: 97 (1.6%)
- British: 70 (1.1%)
- European: 67 (1.1%)
- African: 59 (1.0%)
- Jamaican: 44 (0.7%)
- French: 35 (0.6%)
- Israeli: 22 (0.4%)
- Ukrainian: 19 (0.3%)
- Lebanese: 16 (0.3%)
- Romanian: 12 (0.2%)
- Ethiopian: 11 (0.2%)
- Italian: 9 (0.1%)
- Scottish: 5 (0.08%)
Most common places of birth for foreign-born residents (%):
| Garrison: | 22.5% (233) |
| Maryland: | 4.6% (44,825) |
| Garrison: | 11.2% (116) |
| Maryland: | 1.2% (11,980) |
| Garrison: | 9.9% (103) |
| Maryland: | 0.9% (8,603) |
| Garrison: | 5.8% (60) |
| Maryland: | 0.3% (3,199) |
| Garrison: | 5.6% (58) |
| Maryland: | 0.1% (1,273) |
| Garrison: | 5.3% (55) |
| Maryland: | 0.8% (7,497) |
| Garrison: | 4.5% (47) |
| Maryland: | 3.4% (32,635) |
| Garrison: | 3.3% (34) |
| Maryland: | 3.8% (36,698) |
| Garrison: | 3.1% (32) |
| Maryland: | 0.4% (3,756) |
| Garrison: | 3.1% (32) |
| Maryland: | 0.5% (4,414) |
| Garrison: | 2.9% (30) |
| Maryland: | 6.4% (61,725) |
| Garrison: | 2.6% (27) |
| Maryland: | 0.1% (502) |
| Garrison: | 2.0% (21) |
| Maryland: | 0.1% (1,262) |
| Garrison: | 1.8% (19) |
| Maryland: | 0.3% (2,576) |
| Garrison: | 1.8% (19) |
| Maryland: | 0.1% (1,071) |
| Garrison: | 1.5% (16) |
| Maryland: | 1.0% (9,481) |
Place of birth for U.S.-born residents:
- This state: 5,683
- Other state: 2,910
- Northeast: 1,290
- Midwest: 352
- South: 1,105
- West: 161
87.9% of Garrison residents lived in the same house 1 years ago.
Out of people who lived in different houses, 20.8% lived in this county.
Out of people who lived in different counties, 37.1% lived in Maryland.
| Garrison: | 87.9% |
| State average: | 88.5% |
Education attainment for males 25 years and older:
- No schooling: 0
- Nursery to 4th grade: 0
- 5th and 6th grade: 0
- 7th and 8th grade: 0
- 9th grade: 0
- 10th grade: 0
- 11th grade: 0
- 12th grade, no diploma: 11
- High school graduate (or equivalency): 490
- Less than 1 year of college: 131
- Some college more than 1 year, no degree: 264
- Associate degree: 127
- Bachelor's degree: 799
- Master's degree: 570
- Professional school degree: 147
- Doctorate degree: 27

Education attainment for females 25 years and older:
- No schooling: 9
- Nursery to 4th grade: 0
- 5th and 6th grade: 0
- 7th and 8th grade: 0
- 9th grade: 20
- 10th grade: 36
- 11th grade: 0
- 12th grade, no diploma: 0
- High school graduate (or equivalency): 475
- Less than 1 year of college: 112
- Some college more than 1 year, no degree: 399
- Associate degree: 271
- Bachelor's degree: 1,155
- Master's degree: 714
- Professional school degree: 127
- Doctorate degree: 112

Housing units in structures:
- One, detached: 552
- One, attached: 1,064
- Two: 11
- 3 or 4: 214
- 5 to 9: 532
- 10 to 19: 892
- 20 to 49: 195
- 50 or more: 314
Housing units lacking complete kitchen facilities in 2022: 2.8%
House/condo owner moved in on average 14 years ago
Renter moved in on average 6 years ago

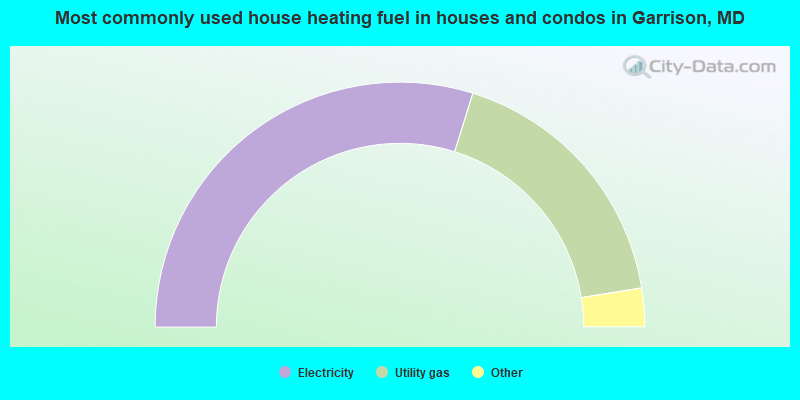
- 59.7%Electricity
- 35.3%Utility gas
- 2.7%Other fuel
- 2.0%Bottled, tank, or LP gas
- 0.4%Fuel oil, kerosene, etc.
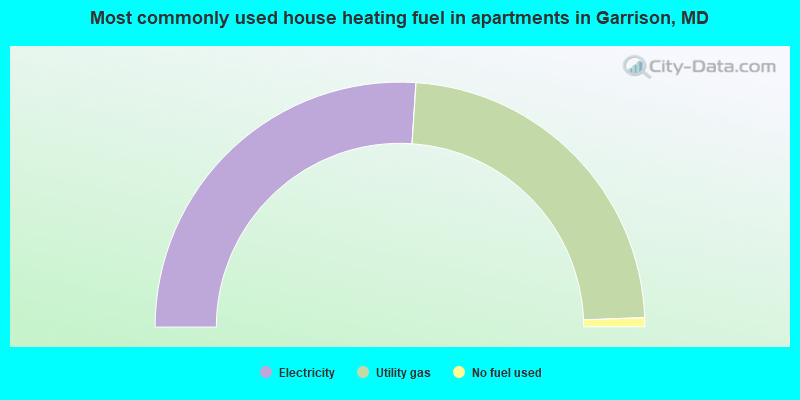
- 52.1%Electricity
- 46.7%Utility gas
- 1.2%No fuel used
Private vs. public school enrollment:
| Here: | 70.6% |
| Maryland: | 15.2% |
| Here: | 57.4% |
| Maryland: | 14.4% |
| Here: | 47.3% |
| Maryland: | 20.2% |


