Hanover, PA (Pennsylvania) Houses and Residents
| Hanover: | $193,193 |
| Pennsylvania: | $245,500 |
Mean price in 2022:
Detached houses: $213,904
Here: $213,904 State: $317,202 Townhouses or other attached units: $162,806
Here: $162,806 State: $254,369 In 2-unit structures: $145,011
Here: $145,011 State: $249,182 In 3-to-4-unit structures: $286,254
Here: $286,254 State: $297,446 In 5-or-more-unit structures: $171,451
Here: $171,451 State: $320,068
Total population: 15,454 (Urban population: 14,535 (all inside urban clusters), Rural population: 0)
Houses: 7,947 (7,259 occupied: 4,242 owner occupied, 3,146 renter occupied)
| % of renters here: | 43% |
| State: | 31% |
Housing density: 2,177 houses/condos per square mile
Median price asked for vacant for-sale houses and condos in 2022: $96,561.
Median contract rent in 2022: $890 (lower quartile is $701, upper quartile is $1,043)
Median rent asked for vacant for-rent units in 2022: $989
Median gross rent in Hanover, PA in 2022: $1,022
Housing units in Hanover with a mortgage: 2,568 (266 second mortgage, 22 home equity loan, 207 both second mortgage and home equity loan)
Houses without a mortgage: 261
Median household income for houses/condos with a mortgage: $82,381
Median household income for apartments without a mortgage: $60,216
Median monthly housing costs: $1,094
Compare current foreclosures in Hanover, PA:
| Photo | Address | Area | Beds / Baths | Price | Details |
|---|---|---|---|---|---|

|
#1
Sara Ln
Hanover, PA 17331
|
1,632 sq. feet
|
2 baths 3 beds |
show details | |

|
#2
Chapel Rd
Hanover, PA 17331
|
1,850 sq. feet
|
2 baths 3 beds |
show details | |

|
#3
Homestead Dr
Hanover, PA 17331
|
- sq. feet
|
2 baths 3 beds |
show details | |

|
#4
Joshua Dr
Hanover, PA 17331
|
- sq. feet
|
2 baths 5 beds |
show details | |

|
#5
Littlestown Rd
Hanover, PA 17331
|
1,568 sq. feet
|
1 baths 3 beds |
show details | |

|
#6
Ledger Dr
Hanover, PA 17331
|
2,085 sq. feet
|
2 baths 4 beds |
show details | |

|
#7
Filbert St
Hanover, PA 17331
|
1,128 sq. feet
|
2 baths 3 beds |
show details | |

|
#8
Colonial Dr
Hanover, PA 17331
|
1,508 sq. feet
|
1 baths 3 beds |
show details | |

|
#9
S Center St
Hanover, PA 17331
|
1,292 sq. feet
|
1 baths 3 beds |
show details | |

|
#10
Ridgewood Dr
Hanover, PA 17331
|
2,863 sq. feet
|
2 baths 4 beds |
show details |
| Photo | Address | Area | Beds / Baths | Price | Details |
|---|---|---|---|---|---|

|
#11
Saint Georgia Dr
Hanover, PA 17331
|
3,706 sq. feet
|
2 baths 5 beds |
show details | |

|
#12
Baltimore St
Hanover, PA 17331
|
1,552 sq. feet
|
1 baths 2 beds |
show details | |

|
#13
Filbert St
Hanover, PA 17331
|
1,128 sq. feet
|
2 baths 3 beds |
show details | |

|
#14
Centennial Rd
Hanover, PA 17331
|
1,400 sq. feet
|
1 baths 2 beds |
show details | |

|
#15
Malek Dr
Hanover, PA 17331
|
3,166 sq. feet
|
3 baths 4 beds |
show details | |

|
#16
Conewago Dr
Hanover, PA 17331
|
708 sq. feet
|
1 baths 3 beds |
show details | |

|
#17
Jacobs Mill Rd
Hanover, PA 17331
|
1,680 sq. feet
|
1 baths 4 beds |
show details | |

|
#18
Carlisle Pike
Hanover, PA 17331
|
909 sq. feet
|
1 baths 1 beds |
show details | |

|
#19
4th St
Hanover, PA 17331
|
1,908 sq. feet
|
1 baths 4 beds |
show details | |

|
#20
Ridge Ave
Hanover, PA 17331
|
1,260 sq. feet
|
1 baths 2 beds |
show details |
| Photo | Address | Area | Beds / Baths | Price | Details |
|---|---|---|---|---|---|

|
#21
Locust St
Hanover, PA 17331
|
1,608 sq. feet
|
1 baths 3 beds |
show details | |

|
#22
Gardenia Dr
Hanover, PA 17331
|
1,648 sq. feet
|
2 baths 3 beds |
show details | |

|
#23
Frederick St
Hanover, PA 17331
|
1,728 sq. feet
|
1 baths 4 beds |
show details | |

|
#24
Terrace Ave
Hanover, PA 17331
|
1,176 sq. feet
|
2 baths 6 beds |
show details | |

|
#25
Mcclellan Ln
Hanover, PA 17331
|
1,092 sq. feet
|
1 baths 3 beds |
show details | |

|
#26
Fulton St
Hanover, PA 17331
|
2,918 sq. feet
|
2 baths 4 beds |
show details | |

|
#27
Frock Dr
Hanover, PA 17331
|
- sq. feet
|
2 baths 3 beds |
show details | |

|
#28
S Center St
Hanover, PA 17331
|
1,292 sq. feet
|
1 baths 3 beds |
show details | |

|
#29
Panorama Ln
Hanover, PA 17331
|
1,648 sq. feet
|
1 baths 3 beds |
show details | |

|
#30
Westminster Ave
Hanover, PA 17331
|
1,916 sq. feet
|
2 baths 4 beds |
show details |
| Photo | Address | Area | Beds / Baths | Price | Details |
|---|---|---|---|---|---|

|
#31
Beech Ln
Hanover, PA 17331
|
1,164 sq. feet
|
2 baths 2 beds |
show details | |

|
#32
Ridgewood Dr
Hanover, PA 17331
|
2,863 sq. feet
|
2 baths 4 beds |
show details | |

|
#33
Albright Dr
Hanover, PA 17331
|
1,906 sq. feet
|
1 baths 2 beds |
show details | |

|
#34
E Middle St
Hanover, PA 17331
|
1,440 sq. feet
|
1 baths 3 beds |
show details | |

|
#35
Drummond Ln
Hanover, PA 17331
|
4,460 sq. feet
|
2 baths 4 beds |
show details | |

|
#36
Westminster Ave
Hanover, PA 17331
|
1,320 sq. feet
|
1 baths 3 beds |
show details | |

|
#37
Broadway
Hanover, PA 17331
|
2,112 sq. feet
|
1 baths 3 beds |
show details | |

|
#38
Centennial Ave
Hanover, PA 17331
|
1,472 sq. feet
|
1 baths 3 beds |
show details | |

|
#39
Princess St
Hanover, PA 17331
|
1,484 sq. feet
|
1 baths 3 beds |
show details | |

|
#40
Little Knoll Dr
Hanover, PA 17331
|
1,692 sq. feet
|
2 baths 3 beds |
show details |
| Photo | Address | Area | Beds / Baths | Price | Details |
|---|---|---|---|---|---|

|
#41
Pumping Station Rd
Hanover, PA 17331
|
1,912 sq. feet
|
2 baths 3 beds |
show details | |

|
#42
Stock St
Hanover, PA 17331
|
1,558 sq. feet
|
1 baths 3 beds |
show details | |

|
#43
Oliver St
Hanover, PA 17331
|
704 sq. feet
|
1 baths 2 beds |
show details | |

|
#44
Fulton St
Hanover, PA 17331
|
1,120 sq. feet
|
1 baths 3 beds |
show details | |

|
#45
Penn St
Hanover, PA 17331
|
1,450 sq. feet
|
1 baths 2 beds |
show details | |

|
#46
Eagle Dr
Hanover, PA 17331
|
1,764 sq. feet
|
2 baths 3 beds |
show details | |

|
#47
S Franklin St
Hanover, PA 17331
|
1,464 sq. feet
|
1 baths 3 beds |
show details | |

|
#48
Bowman Rd # B
Hanover, PA 17331
|
1,280 sq. feet
|
1 baths 3 beds |
show details | |

|
#49
Savoir Dr
Hanover, PA 17331
|
1,881 sq. feet
|
2 baths 3 beds |
show details | |

|
Check over 1 million property listings on Foreclosure.com!
|
browse all offers | |||

Latest news about housing in Hanover, PA collected exclusively by city-data.com from local newspapers, TV, and radio stations

 | Why aren't the Poconos as pricey as other outer-orbits of NYC? (174 replies) |
| Smithfield Gateway Progress?? (68 replies) |
| Need advice on w/b homes- s. Main or elizabeth street (7 replies) |
| New Upscale Housing Coming to Downtown Scranton (312 replies) |
| Wilkes Barre--how bad is it? (38 replies) |
| What neighborhoods to consider for renting in WB area (12 replies) |
Median year apartment built: 1954
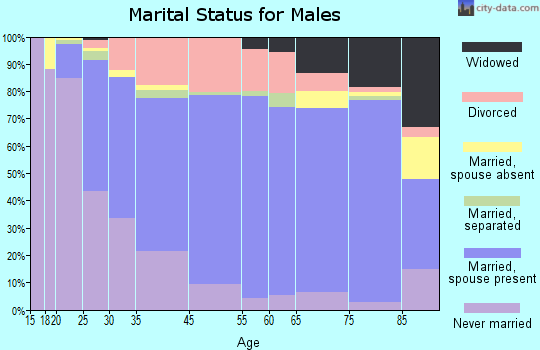
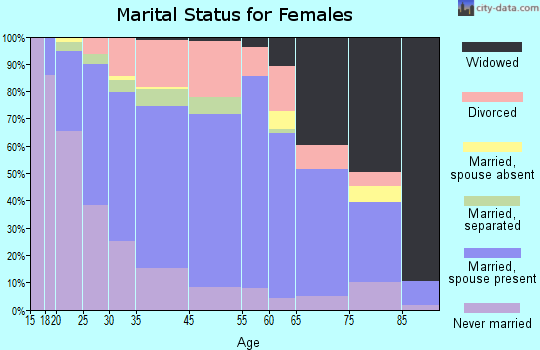
Household type by relationship:
Households: 16,554- Male householders: 2,998 (894 living alone), Female householders: 4,233 (1,684 living alone)
2,627 spouses (2,618 opposite-sex spouses), 695 unmarried partners, (672 opposite-sex unmarried partners), 4,464 children (4,130 natural, 137 adopted, 196 stepchildren), 388 grandchildren, 134 brothers or sisters, 122 parents, 0 foster children, 189 other relatives, 536 non-relatives
- In group quarters: 164
Size of family households: 2,215 2-persons, 667 3-persons, 811 4-persons, 449 5-persons, 68 6-persons, 121 7-or-more-persons.
Size of nonfamily households: 2,609 1-person, 462 2-persons, 5 3-persons, 27 5-persons, 8 7-or-more-persons.
1,663 married couples with children.
1,230 single-parent households (270 men, 960 women).
88.0% of residents of Hanover speak English at home.
10.9% of residents speak Spanish at home (58% speak English very well, 21% speak English well, 16% speak English not well, 5% don't speak English at all).
0.6% of residents speak other Indo-European language at home (69% speak English very well, 22% speak English well, 9% speak English not well).
0.6% of residents speak Asian or Pacific Island language at home (74% speak English very well, 26% speak English well).
Foreign born population: 1,094 (6.6%)
(50.4% of them are naturalized citizens)
| Here: | 6.7 |
| State: | 6.8 |
| Here: | 4.3 |
| State: | 4.3 |
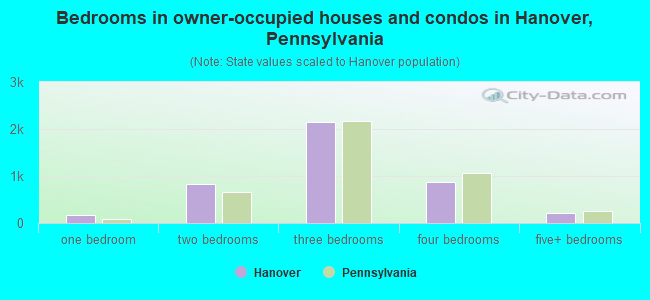
- Bedrooms in owner-occupied houses and condos in Hanover, Pennsylvania
- 0no bedroom
- 1771 bedroom
- 8372 bedrooms
- 2,1513 bedrooms
- 8654 bedrooms
- 2125+ bedrooms
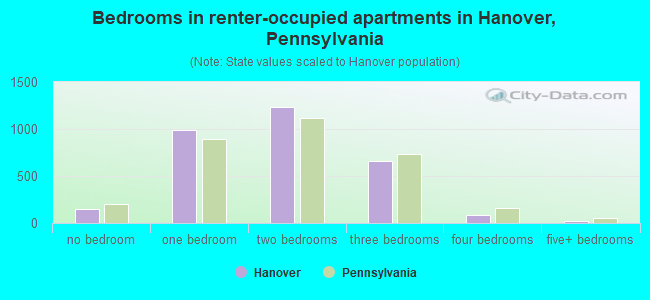
- Bedrooms in renter-occupied apartments in Hanover, Pennsylvania
- 154no bedroom
- 9941 bedroom
- 1,2382 bedrooms
- 6583 bedrooms
- 854 bedrooms
- 205+ bedrooms
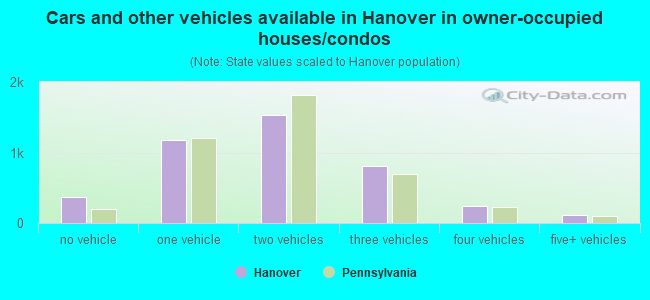
- Cars and other vehicles available in Hanover in owner-occupied houses/condos
- 375no vehicle
- 1,1761 vehicle
- 1,5342 vehicles
- 8073 vehicles
- 2384 vehicles
- 1125+ vehicles
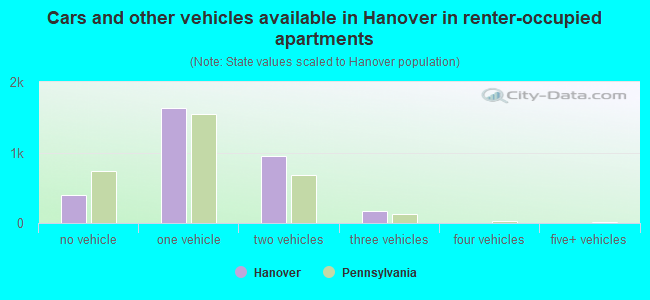
- Cars and other vehicles available in Hanover in renter-occupied apartments
- 394no vehicle
- 1,6341 vehicle
- 9482 vehicles
- 1643 vehicles
- 74 vehicles
- 05+ vehicles
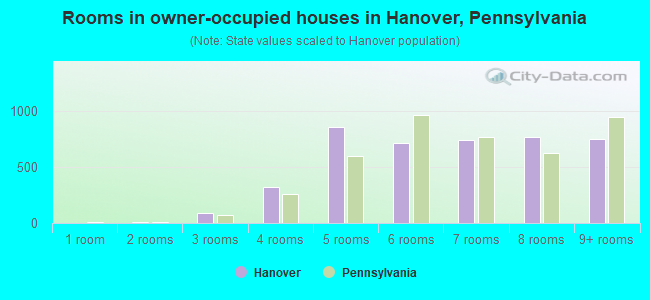
- Rooms in owner-occupied houses in Hanover, Pennsylvania
- 01 room
- 132 rooms
- 893 rooms
- 3174 rooms
- 8585 rooms
- 7116 rooms
- 7357 rooms
- 7678 rooms
- 7529+ rooms
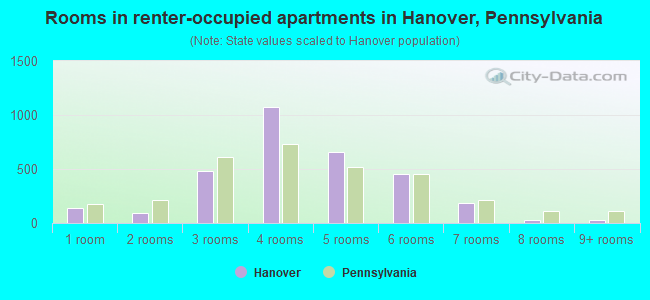
- Rooms in renter-occupied apartments in Hanover, Pennsylvania
- 1411 room
- 902 rooms
- 4863 rooms
- 1,0724 rooms
- 6595 rooms
- 4536 rooms
- 1867 rooms
- 308 rooms
- 309+ rooms
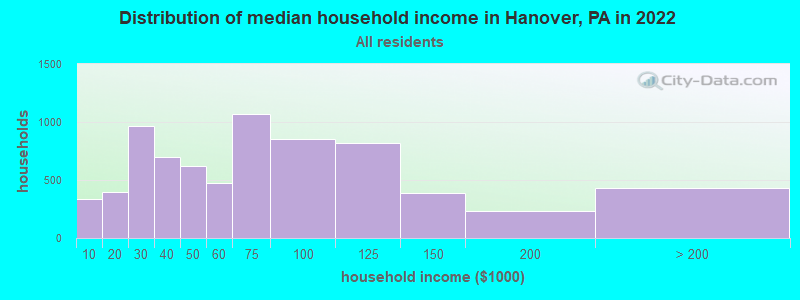
Hanover, PA household income distribution

- 339Less than $10,000
- 396$10,000 to $19,999
- 966$20,000 to $29,999
- 696$30,000 to $39,999
- 625$40,000 to $49,999
- 475$50,000 to $59,999
- 1,067$60,000 to $74,999
- 857$75,000 to $99,999
- 822$100,000 to $124,999
- 386$125,000 to $149,999
- 234$150,000 to $199,999
- 431$200,000 or more
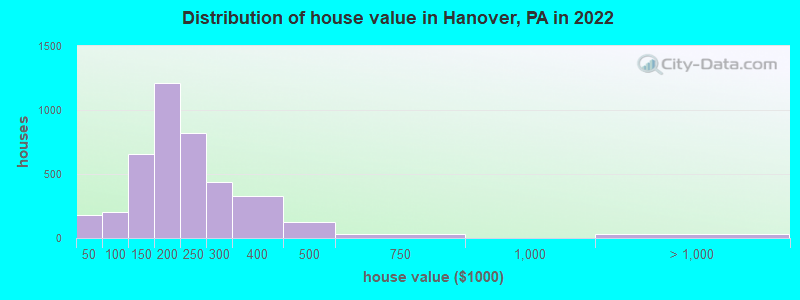
Home value of owner - occupied houses in 2022 in Hanover, PA
-
- 4Less than $10,000
- 82$10,000 to $14,999
- 16$15,000 to $19,999
- 45$20,000 to $24,999
- 30$40,000 to $49,999
- 38$60,000 to $69,999
- 41$70,000 to $79,999
- 46$80,000 to $89,999
- 43$90,000 to $99,999
- 402$100,000 to $124,999
- 254$125,000 to $149,999
- 748$150,000 to $174,999
- 458$175,000 to $199,999
- 820$200,000 to $249,999
- 438$250,000 to $299,999
- 326$300,000 to $399,999
- 124$400,000 to $499,999
- 30$500,000 to $749,999
- 31$1,000,000 to $1,499,999
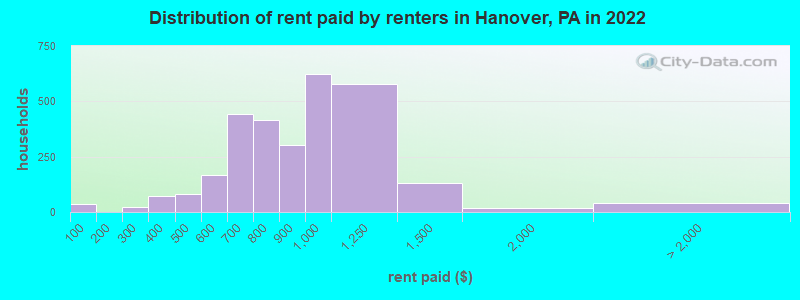
Rent paid by renters in 2022 in Hanover, PA
-
- 34Less than $100
- 4$200 to $249
- 19$250 to $299
- 59$300 to $349
- 12$350 to $399
- 50$400 to $449
- 29$450 to $499
- 58$500 to $549
- 109$550 to $599
- 145$600 to $649
- 295$650 to $699
- 117$700 to $749
- 297$750 to $799
- 301$800 to $899
- 621$900 to $999
- 580$1,000 to $1,249
- 129$1,250 to $1,499
- 16$1,500 to $1,999
- 16$3,500 or more
- 25No cash rent
Percentage of workers working in this county: 70.3%
Number of people working at home: 520 (6.4% of all workers)
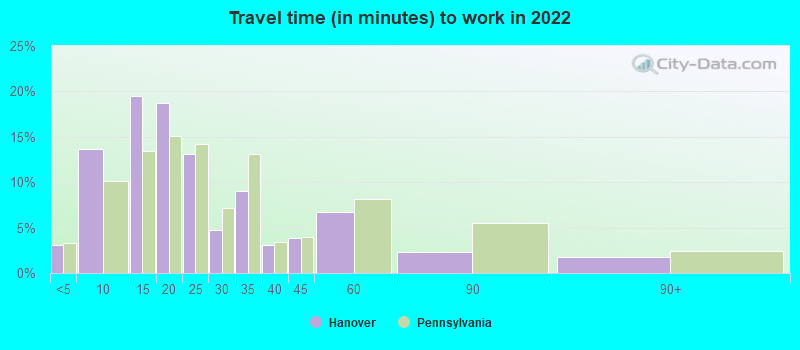
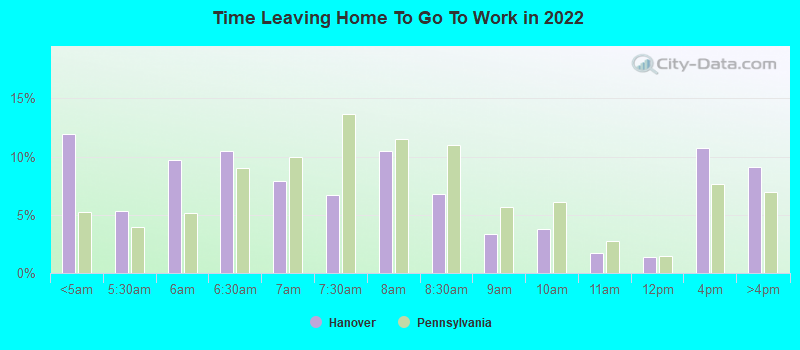
Travel time to work (commute)
- Less than 5 minutes: 430
- 5 to 9 minutes: 1,634
- 10 to 14 minutes: 1,605
- 15 to 19 minutes: 746
- 20 to 24 minutes: 447
- 25 to 29 minutes: 262
- 30 to 34 minutes: 593
- 35 to 39 minutes: 219
- 40 to 44 minutes: 224
- 45 to 59 minutes: 546
- 60 to 89 minutes: 415
- 90 or more minutes: 295

Means of transportation to work:
- Drove a car alone: 12,300 (84.7%)
- Carpooled: 884 (6.1%)
- Bus: 3 (0.0%)
- Taxi: 102 (0.7%)
- Bicycle: 39 (0.3%)
- Walked: 187 (1.3%)
- Worked at home: 520 (3.6%)
- Unemployment by race in 2022
- Unemployment rate for White non-Hispanic residents
- 6.8%Males
- 4.3%Females
- Unemployment rate for Black residents
- 10.2%Males
- 25.9%Females
- Unemployment rate for Asian residents
- 16.3%Males
- 67.0%Females
- Unemployment rate for two or more race residents
- 1.1%Males
- 3.7%Females
- Unemployment rate for Hispanic or Latino residents
- 1.4%Females
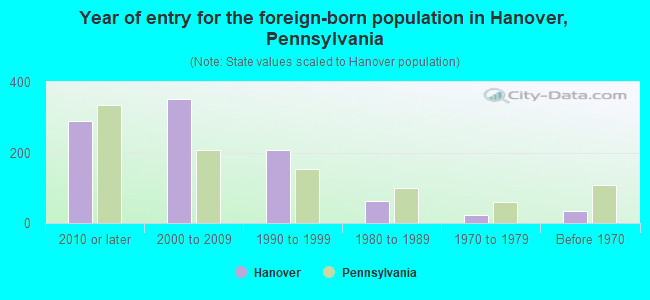
- Year of entry for the foreign-born population in Hanover, Pennsylvania
- 2882010 or later
- 3532000 to 2009
- 2061990 to 1999
- 621980 to 1989
- 231970 to 1979
- 33Before 1970
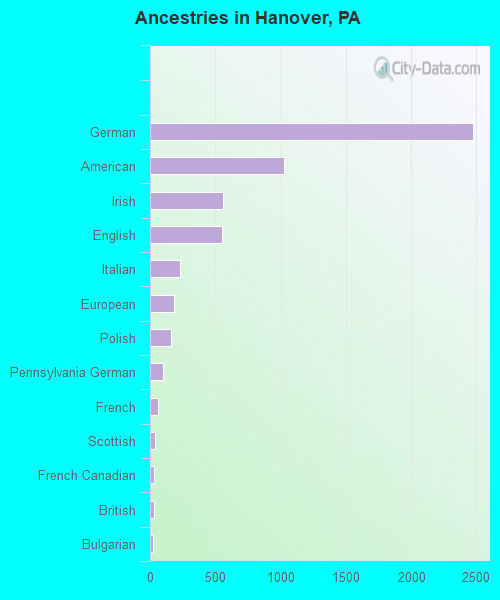
First ancestries reported:
- German: 2,473 (33.3%)
- American: 1,024 (13.8%)
- Irish: 559 (7.5%)
- English: 550 (7.4%)
- Italian: 233 (3.1%)
- European: 183 (2.5%)
- Polish: 160 (2.2%)
- Pennsylvania German: 97 (1.3%)
- French: 62 (0.8%)
- Scottish: 36 (0.5%)
- French Canadian: 30 (0.4%)
- British: 28 (0.4%)
- Bulgarian: 26 (0.4%)
- Lithuanian: 21 (0.3%)
- Luxembourger: 21 (0.3%)
- Australian: 15 (0.2%)
- Yugoslavian: 11 (0.1%)
- Greek: 9 (0.1%)
- Austrian: 8 (0.1%)
- Welsh: 8 (0.1%)
Most common places of birth for foreign-born residents (%):
| Hanover: | 43.1% (423) |
| Pennsylvania: | 5.8% (54,190) |
| Hanover: | 11.4% (112) |
| Pennsylvania: | 1.1% (10,035) |
| Hanover: | 9.0% (88) |
| Pennsylvania: | 0.2% (1,752) |
| Hanover: | 7.4% (73) |
| Pennsylvania: | 0.4% (4,113) |
| Hanover: | 7.2% (71) |
| Pennsylvania: | 2.2% (21,039) |
| Hanover: | 6.7% (66) |
| Pennsylvania: | 9.2% (86,544) |
| Hanover: | 4.0% (39) |
| Pennsylvania: | 0.5% (4,424) |
| Hanover: | 3.9% (38) |
| Pennsylvania: | 2.4% (22,612) |
| Hanover: | 2.9% (28) |
| Pennsylvania: | 0.4% (4,198) |
| Hanover: | 2.4% (24) |
| Pennsylvania: | 0.2% (2,319) |
| Hanover: | 1.6% (16) |
| Pennsylvania: | 0.5% (4,648) |
Place of birth for U.S.-born residents:
- This state: 10,074
- Other state: 5,238
- Northeast: 718
- Midwest: 512
- South: 3,815
- West: 176
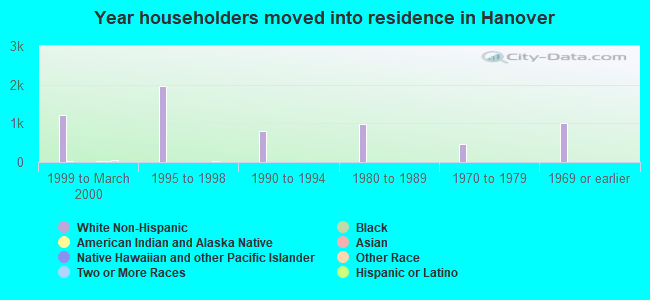
85.1% of Hanover residents lived in the same house 1 years ago.
Out of people who lived in different houses, 35.1% lived in this county.
Out of people who lived in different counties, 49.1% lived in Pennsylvania.
| Hanover: | 85.1% |
| State average: | 89.3% |
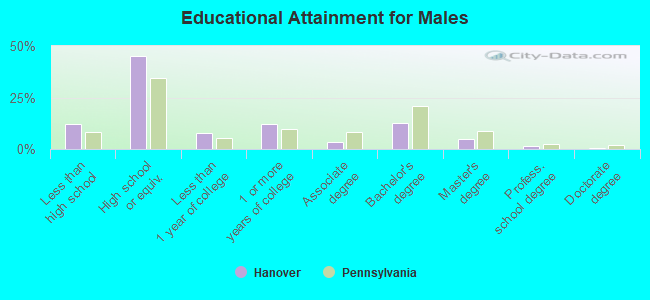
Education attainment for males 25 years and older:
- No schooling: 81
- Nursery to 4th grade: 0
- 5th and 6th grade: 3
- 7th and 8th grade: 27
- 9th grade: 96
- 10th grade: 129
- 11th grade: 111
- 12th grade, no diploma: 163
- High school graduate (or equivalency): 2,273
- Less than 1 year of college: 384
- Some college more than 1 year, no degree: 618
- Associate degree: 181
- Bachelor's degree: 635
- Master's degree: 232
- Professional school degree: 65
- Doctorate degree: 28
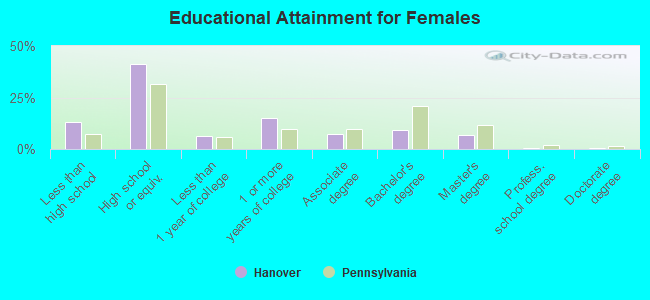
Education attainment for females 25 years and older:
- No schooling: 44
- Nursery to 4th grade: 9
- 5th and 6th grade: 34
- 7th and 8th grade: 118
- 9th grade: 128
- 10th grade: 204
- 11th grade: 86
- 12th grade, no diploma: 185
- High school graduate (or equivalency): 2,568
- Less than 1 year of college: 401
- Some college more than 1 year, no degree: 925
- Associate degree: 466
- Bachelor's degree: 587
- Master's degree: 410
- Professional school degree: 32
- Doctorate degree: 23
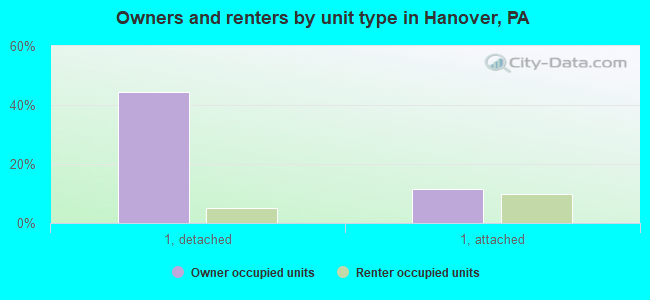
Housing units in structures:
- One, detached: 3,763
- One, attached: 1,710
- Two: 670
- 3 or 4: 706
- 5 to 9: 359
- 10 to 19: 324
- 20 to 49: 318
- 50 or more: 94
Housing units lacking complete kitchen facilities in 2022: 2.4%
House/condo owner moved in on average 17 years ago
Renter moved in on average 3 years ago
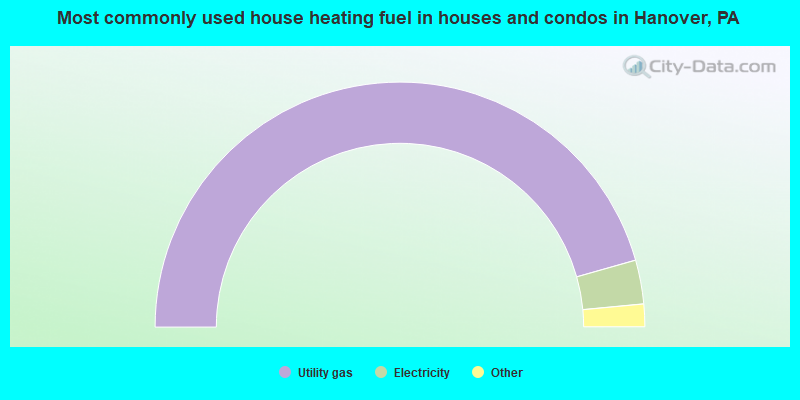
- 91.2%Utility gas
- 5.8%Electricity
- 1.5%Fuel oil, kerosene, etc.
- 0.7%Bottled, tank, or LP gas
- 0.4%Coal or coke
- 0.2%Solar energy
- 0.2%No fuel used
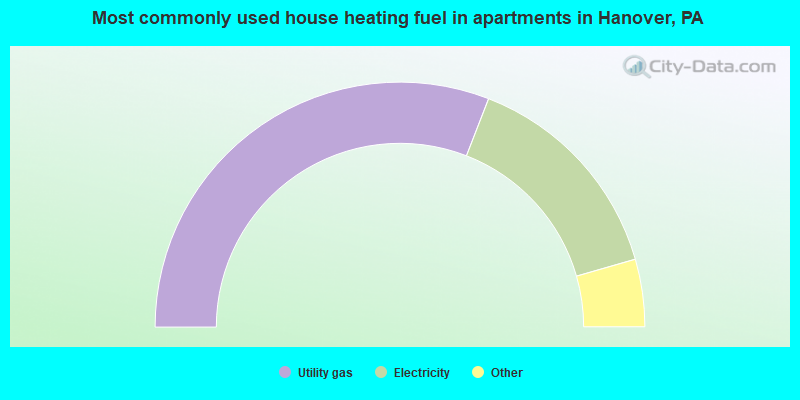
- 61.8%Utility gas
- 29.3%Electricity
- 2.9%Bottled, tank, or LP gas
- 2.8%Fuel oil, kerosene, etc.
- 1.5%No fuel used
- 1.1%Other fuel
- 0.5%Coal or coke
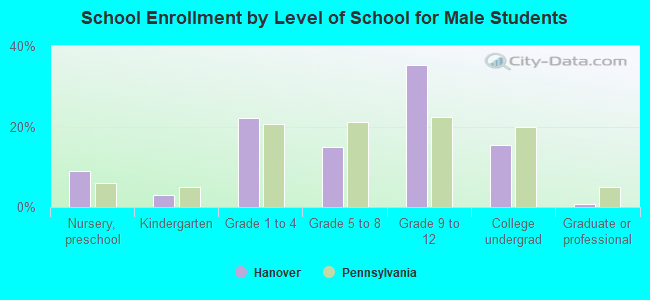
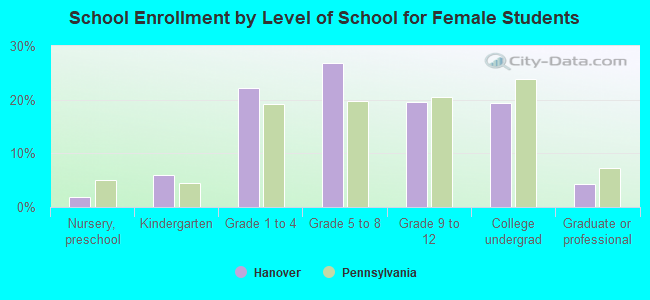
Private vs. public school enrollment:
| Here: | 2.6% |
| Pennsylvania: | 15.7% |
| Here: | 11.3% |
| Pennsylvania: | 13.4% |
| Here: | 19.7% |
| Pennsylvania: | 39.8% |