Jump to a detailed profile or search site with Google Custom Search

Kingston, NH (New Hampshire) Houses and Residents

Estimated median house or condo value in 2022: $475,450 (it was $155,600 in 2000)
Kingston:

$475,450
New Hampshire:

$384,700
Lower value quartile - upper value quartile: $340,650 - $637,513

Total population: 6,025 (Urban population: 2,729, Rural population: 3,133 (11 farm, 3,122 nonfarm))

Houses: 2,265 (2,122 occupied: 1,823 owner occupied, 299 renter occupied)

% of renters here:

14%
State:

28%

Housing density: 115 houses/condos per square mile

Median price asked for vacant for-sale houses and condos in 2022 in this county: $227,726.

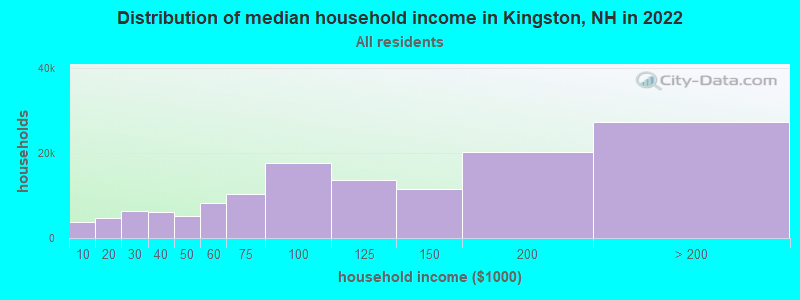
Median contract rent in 2022: $1,301 (lower quartile is $1,089, upper quartile is $1,847)


Median rent asked for vacant for-rent units in 2022: $1,192


Median gross rent in Kingston, NH in 2022: $1,411

Housing units in Kingston with a mortgage: 1,272 (108 second mortgage, 242 home equity loan, 8 both second mortgage and home equity loan)
Houses without a mortgage: 302

Compare current foreclosures near Kingston, NH:

Check out more offers near Kingston, NH.
Powered by Foreclosure.com


Latest news about housing in Kingston, NH collected exclusively by city-data.com from local newspapers, TV, and radio stations

Kingston, New Hampshire Age and Sex of Residents

Household type by relationship:

Households: 292,725
  • In family households: 247,693 (57,848 male householders, 21,984 female householders)
    64,858 spouses, 85,601 children (80,134 natural, 2,077 adopted, 3,390 stepchildren), 3,954 grandchildren, 1,562 brothers or sisters, 2,352 parents, foster children, 1,664 other relatives, 5,842 non-relatives
  • In nonfamily households: 45,032 (17,024 male householders (12,402 living alone)), 18,177 female householders (14,574 living alone)), 9,831 nonrelatives
  • In group quarters: 2,498 (1,438 institutionalized population)

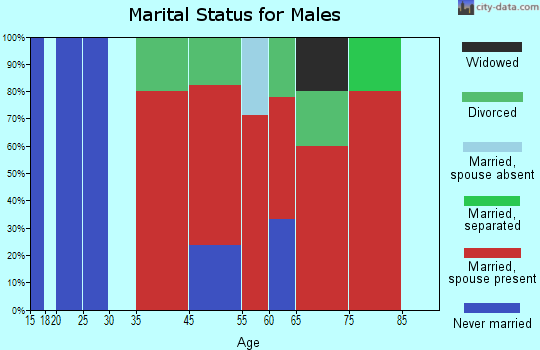
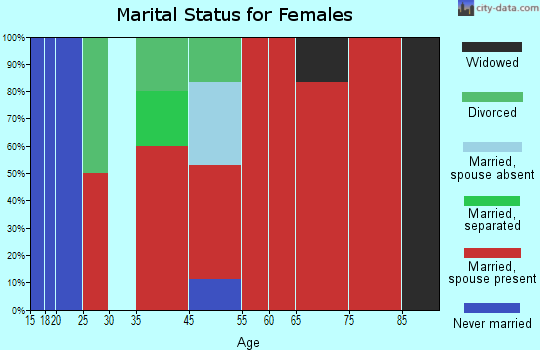
57,723 married couples with children.
11,266 single-parent households (3,032 men, 8,234 women).

95.7% of residents of Kingston speak English at home.
1.1% of residents speak Spanish at home (66% speak English very well, 34% speak English well).
2.6% of residents speak other Indo-European language at home (83% speak English very well, 5% speak English well, 13% speak English not well).
0.3% of residents speak Asian or Pacific Island language at home (53% speak English well, 47% speak English not well).
0.3% of residents speak other language at home (50% speak English very well, 50% speak English well).

Foreign born population: 203 (3.0%)
(73.4% of them are naturalized citizens)

Median number of rooms in houses and condos:
Here:

6.5
State:

6.4

Median number of rooms in apartments
Here:

3.8
State:

4.0

Owner-occupied Renter-occupied
Bedrooms in owner-occupied houses and condos in Kingston, New Hampshire
  • Bedrooms in owner-occupied houses and condos in Kingston, New Hampshire
  • 0no bedroom
  • 541 bedroom
  • 5102 bedrooms
  • 7913 bedrooms
  • 3684 bedrooms
  • 1005+ bedrooms
Bedrooms in renter-occupied apartments in Kingston, New Hampshire
  • Bedrooms in renter-occupied apartments in Kingston, New Hampshire
  • 8no bedroom
  • 841 bedroom
  • 1112 bedrooms
  • 863 bedrooms
  • 104 bedrooms
  • 05+ bedrooms
Owner-occupied Renter-occupied
Cars and other vehicles available in Kingston in owner-occupied houses/condos
  • Cars and other vehicles available in Kingston in owner-occupied houses/condos
  • 48no vehicle
  • 3141 vehicle
  • 8882 vehicles
  • 3573 vehicles
  • 1414 vehicles
  • 755+ vehicles
Cars and other vehicles available in Kingston in renter-occupied apartments
  • Cars and other vehicles available in Kingston in renter-occupied apartments
  • 10no vehicle
  • 1161 vehicle
  • 1302 vehicles
  • 363 vehicles
  • 74 vehicles
  • 05+ vehicles
Owner-occupied Renter-occupied
Rooms in owner-occupied houses in Kingston, New Hampshire
  • Rooms in owner-occupied houses in Kingston, New Hampshire
  • 01 room
  • 02 rooms
  • 203 rooms
  • 1154 rooms
  • 3995 rooms
  • 4366 rooms
  • 3547 rooms
  • 2708 rooms
  • 2299+ rooms
Rooms in renter-occupied apartments in Kingston, New Hampshire
  • Rooms in renter-occupied apartments in Kingston, New Hampshire
  • 01 room
  • 252 rooms
  • 563 rooms
  • 664 rooms
  • 785 rooms
  • 566 rooms
  • 187 rooms
  • 08 rooms
  • 09+ rooms
Year house built
Breakdown of mean house values by ages of householders
Owners and renters by unit type in Kingston, NH
  • Kingston, NH household income distribution

  • Distribution of median household income in Kingston, NH in 2022
  • 3,754Less than $10,000
  • 4,617$10,000 to $19,999
  • 6,438$20,000 to $29,999
  • 6,056$30,000 to $39,999
  • 5,155$40,000 to $49,999
  • 8,289$50,000 to $59,999
  • 10,387$60,000 to $74,999
  • 17,500$75,000 to $99,999
  • 13,515$100,000 to $124,999
  • 11,489$125,000 to $149,999
  • 20,227$150,000 to $199,999
  • 27,244$200,000 or more

Percentage of workers working in this county: 67.3%
Number of people working at home: 753 (20.6% of all workers)

Travel time to work (commute)

  • Less than 5 minutes: 164
  • 5 to 9 minutes: 165
  • 10 to 14 minutes: 144
  • 15 to 19 minutes: 299
  • 20 to 24 minutes: 511
  • 25 to 29 minutes: 158
  • 30 to 34 minutes: 508
  • 35 to 39 minutes: 97
  • 40 to 44 minutes: 90
  • 45 to 59 minutes: 384
  • 60 to 89 minutes: 270
  • 90 or more minutes: 129

Means of transportation to work:

  • Drove a car alone: 2,600 (83.2%)
  • Carpooled: 224 (7.2%)
  • Railroad: 6 (0.2%)
  • Motorcycle: 8 (0.3%)
  • Walked: 44 (1.4%)
  • Other means: 37 (1.2%)
  • Worked at home: 205 (6.6%)
Class of Workers in 2000
Year of entry for the foreign-born population in Kingston, New Hampshire
  • Year of entry for the foreign-born population in Kingston, New Hampshire
  • 91995 to March 2000
  • 01990 to 1994
  • 01985 to 1989
  • 321980 to 1984
  • 91975 to 1979
  • 01970 to 1974
  • 241965 to 1969
  • 50Before 1965
Ancestries in Kingston, NH

First ancestries reported:

  • Irish: 1,448 (20.4%)
  • English: 1,165 (16.4%)
  • French: 955 (13.4%)
  • Italian: 609 (8.6%)
  • Polish: 424 (6.0%)
  • Other: 422 (5.9%)
  • French Canadian: 406 (5.7%)
  • German: 382 (5.4%)
  • United States: 279 (3.9%)
  • Swedish: 196 (2.8%)
  • Scottish: 194 (2.7%)
  • Greek: 142 (2.0%)
  • Dutch: 115 (1.6%)
  • Portuguese: 110 (1.5%)
  • Scotch-Irish: 73 (1.0%)
  • Welsh: 35 (0.5%)
  • West Indian: 35 (0.5%)
  • Lithuanian: 28 (0.4%)
  • Norwegian: 28 (0.4%)
  • Russian: 21 (0.3%)
  • Danish: 19 (0.3%)
  • Arab: 9 (0.1%)
  • Ukrainian: 9 (0.1%)
  • Hungarian: 6 (0.08%)

Most common places of birth for foreign-born residents (%):

Canada
Kingston:

16.1% (20)
New Hampshire:

22.9% (12,397)

United Kingdom
Kingston:

14.5% (18)
New Hampshire:

8.1% (4,396)

Germany
Kingston:

12.9% (16)
New Hampshire:

4.9% (2,670)

Greece
Kingston:

12.9% (16)
New Hampshire:

2.3% (1,261)

Philippines
Kingston:

10.5% (13)
New Hampshire:

1.9% (1,031)

Portugal
Kingston:

7.3% (9)
New Hampshire:

1.5% (835)

Korea
Kingston:

7.3% (9)
New Hampshire:

2.9% (1,582)

Trinidad and Tobago
Kingston:

7.3% (9)
New Hampshire:

0.2% (94)

Other Eastern Europe
Kingston:

6.5% (8)
New Hampshire:

1.5% (786)

Other Northern Europe
Kingston:

4.8% (6)
New Hampshire:

0.9% (508)

Place of birth for U.S.-born residents:

  • This state: 1,296
  • Other state: 4,409
  • Northeast: 3,785
  • Midwest: 232
  • South: 162
  • West: 230

67% of Kingston residents lived in the same house 5 years ago.
   Out of people who lived in different houses, 49% lived in this county.
   Out of people who lived in different counties, 8% lived in New Hampshire.

Education attainment for males 25 years and older:

  • No schooling: 10
  • Nursery to 4th grade: 0
  • 5th and 6th grade: 7
  • 7th and 8th grade: 27
  • 9th grade: 39
  • 10th grade: 59
  • 11th grade: 55
  • 12th grade, no diploma: 56
  • High school graduate (or equivalency): 664
  • Less than 1 year of college: 160
  • Some college more than 1 year, no degree: 295
  • Associate degree: 209
  • Bachelor's degree: 255
  • Master's degree: 130
  • Professional school degree: 0
  • Doctorate degree: 17
Educational Attainment for Males

Education attainment for females 25 years and older:

  • No schooling: 0
  • Nursery to 4th grade: 0
  • 5th and 6th grade: 13
  • 7th and 8th grade: 18
  • 9th grade: 29
  • 10th grade: 50
  • 11th grade: 24
  • 12th grade, no diploma: 14
  • High school graduate (or equivalency): 634
  • Less than 1 year of college: 159
  • Some college more than 1 year, no degree: 327
  • Associate degree: 221
  • Bachelor's degree: 288
  • Master's degree: 200
  • Professional school degree: 19
  • Doctorate degree: 0
Educational Attainment for Females
Kingston marital status for males
Kingston marital status for females

Housing units in structures:

  • One, detached: 1,825
  • One, attached: 85
  • Two: 87
  • 3 or 4: 34
  • 5 to 9: 94
  • Mobile homes: 140

Median worth of mobile homes: $226,086

Year householders moved into residence in Kingston
Houses and condos Apartments
Most commonly used house heating fuel in houses and condos in Kingston, NH
  • 79.8%Fuel oil, kerosene, etc.
  • 9.5%Bottled, tank, or LP gas
  • 7.4%Wood
  • 2.0%Electricity
  • 0.8%Other fuel
  • 0.5%Utility gas
Most commonly used house heating fuel in apartments in Kingston, NH
  • 84.9%Fuel oil, kerosene, etc.
  • 6.4%Electricity
  • 5.7%Bottled, tank, or LP gas
  • 3.0%No fuel used

Private vs. public school enrollment:

Students in private schools in grades 1 to 8 (elementary and middle school): 86
Here:

11.2%
New Hampshire:

8.9%

Students in private schools in grades 9 to 12 (high school): 59
Here:

21.5%
New Hampshire:

10.7%

Students in private undergraduate colleges: 82
Here:

34.7%
New Hampshire:

36.4%
School Enrollment by Level of School for Male Students
School Enrollment by Level of School for Female Students
Age and Sex of Sensory-Disabled Noninstitutionalized Residents
Age and Sex of Physically-Disabled Noninstitutionalized Residents
Age and Sex of Mentally-Disabled Noninstitutionalized Residents
Age and Sex of Self-Care Disabled Noninstitutionalized Residents
Age and Sex of Go-Outside-Home Disabled Noninstitutionalized Residents
Age and Sex of Noninstitutionalized Residents with Employment Disability