Housing density: 1,462 houses/condos per square mile
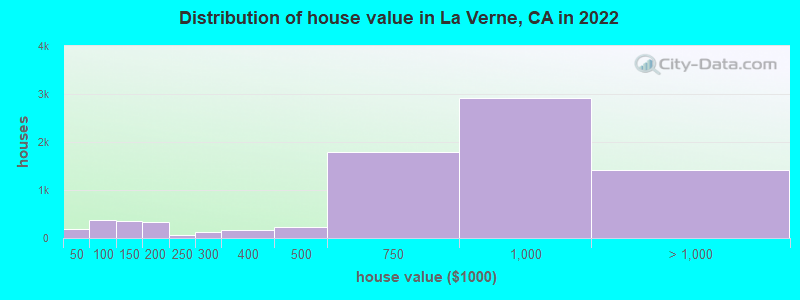
Median price asked for vacant for-sale houses and condos in 2022: $1,651,131.
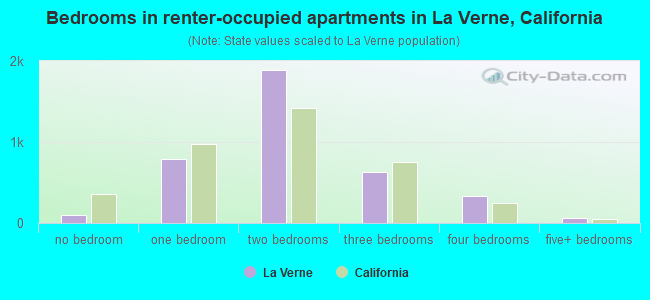
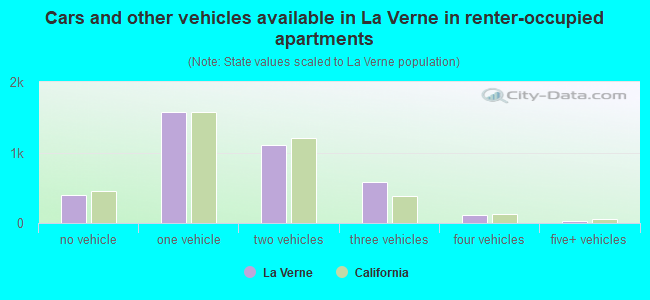
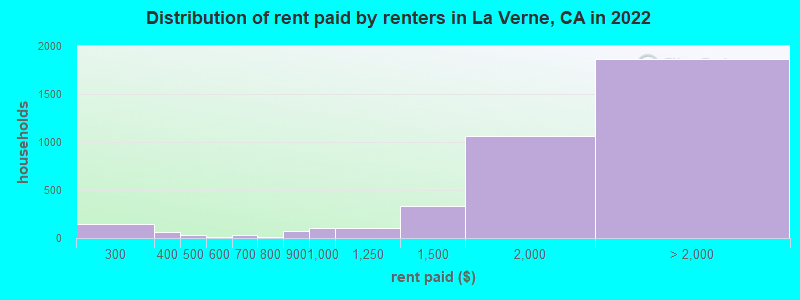
Median contract rent in 2022: $1,882 (lower quartile is $1,419, upper quartile is over $2,000)
Median rent asked for vacant for-rent units in 2022: $2,385
Median gross rent in La Verne, CA in 2022: $1,985
Housing units in La Verne with a mortgage: 4,922 (547 second mortgage, 0 home equity loan, 502 both second mortgage and home equity loan) Houses without a mortgage: 36
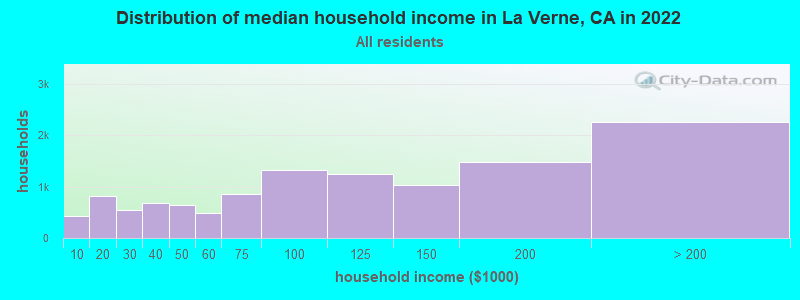
Median household income for houses/condos with a mortgage: $148,192
Median household income for apartments without a mortgage: $71,545
3,648 married couples with children.
1,524 single-parent households (515 men, 1,009 women).
77.0% of residents of La Verne speak English at home.
12.0% of residents speak Spanish at home (74% speak English very well, 15% speak English well, 9% speak English not well, 2% don't speak English at all).
3.3% of residents speak other Indo-European language at home (85% speak English very well, 11% speak English well, 4% speak English not well).
7.6% of residents speak Asian or Pacific Island language at home (49% speak English very well, 20% speak English well, 28% speak English not well, 4% don't speak English at all).
1.5% of residents speak other language at home (70% speak English very well, 19% speak English well, 11% speak English not well).
Foreign born population: 5,166 (16.9%)
(73.1% of them are naturalized citizens)
Percentage of workers working in this county: 79.5% Number of people working at home: 2,954 (20.8% of all workers)
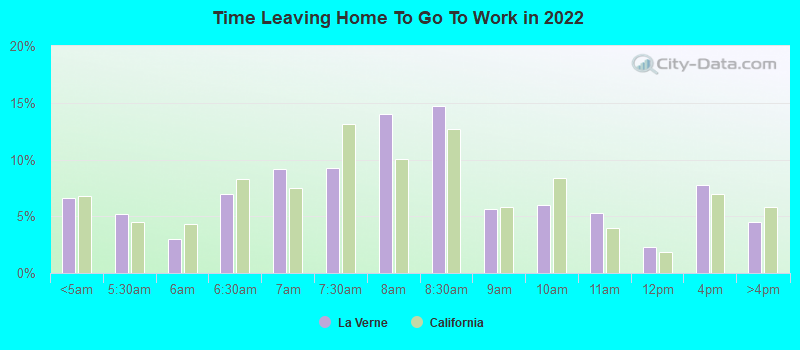
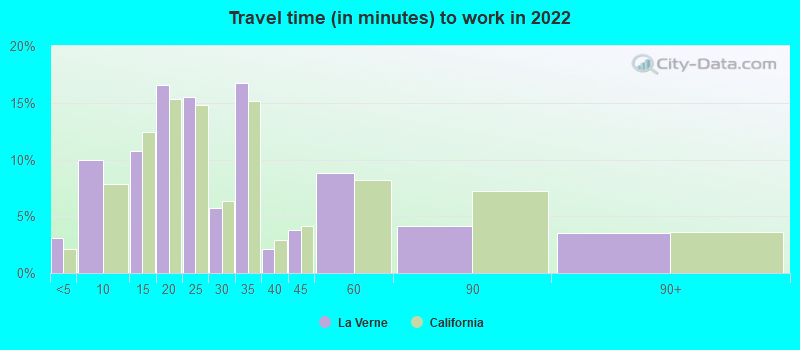
Travel time to work (commute)
Less than 5 minutes: 411
5 to 9 minutes: 1,091
10 to 14 minutes: 1,531
15 to 19 minutes: 1,177
20 to 24 minutes: 1,467
25 to 29 minutes: 562
30 to 34 minutes: 1,428
35 to 39 minutes: 266
40 to 44 minutes: 561
45 to 59 minutes: 1,223
60 to 89 minutes: 1,193
90 or more minutes: 485
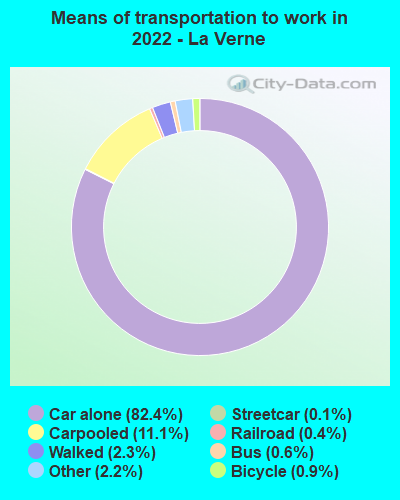
Means of transportation to work:
Drove a car alone: 7,423 (63.0%)
Carpooled: 1,107 (9.4%)
Bus: 50 (0.4%)
Subway or elevated rail: 10 (0.1%)
Light rail, streetcar or trolley: 23 (0.2%)
Taxi: 212 (1.8%)
Bicycle: 83 (0.7%)
Walked: 220 (1.9%)
Worked at home: 2,954 (25.1%)
Unemployment by race in 2022
Unemployment rate for White non-Hispanic residents
3.7%Males
4.5%Females
Unemployment rate for Black residents
28.3%Males
11.8%Females
Unemployment rate for Asian residents
6.4%Males
18.7%Females
Unemployment rate for other race residents
5.4%Males
5.8%Females
Unemployment rate for two or more race residents
4.2%Males
2.4%Females
Unemployment rate for Hispanic or Latino residents
5.4%Males
3.8%Females
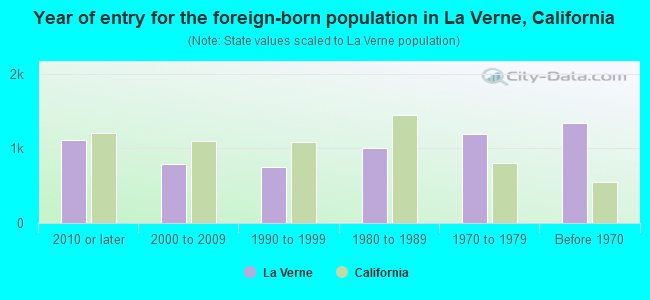
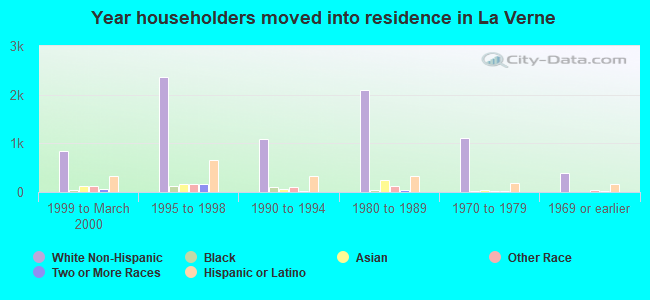
Year of entry for the foreign-born population in La Verne, California
1,1142010 or later
7852000 to 2009
7531990 to 1999
1,0081980 to 1989
1,1881970 to 1979
1,336Before 1970
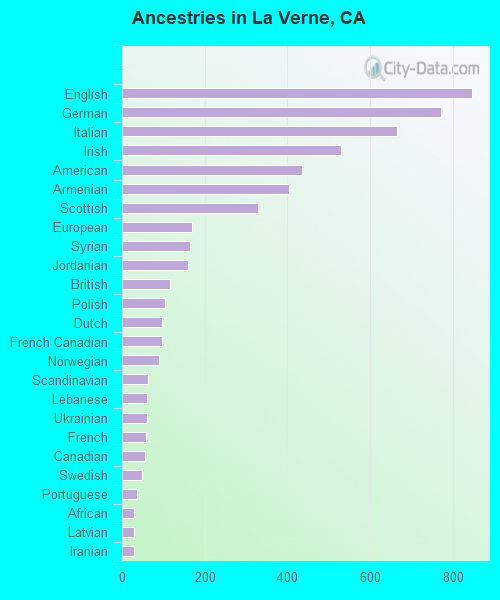
First ancestries reported:
English: 846 (5.4%)
German: 771 (4.9%)
Italian: 666 (4.2%)
Irish: 531 (3.4%)
American: 436 (2.8%)
Armenian: 404 (2.6%)
Scottish: 329 (2.1%)
European: 170 (1.1%)
Syrian: 165 (1.0%)
Jordanian: 160 (1.0%)
British: 117 (0.7%)
Polish: 103 (0.7%)
Dutch: 98 (0.6%)
French Canadian: 98 (0.6%)
Norwegian: 89 (0.6%)
Scandinavian: 64 (0.4%)
Lebanese: 61 (0.4%)
Ukrainian: 60 (0.4%)
French: 59 (0.4%)
Canadian: 56 (0.4%)
Swedish: 48 (0.3%)
Portuguese: 37 (0.2%)
African: 29 (0.2%)
Latvian: 29 (0.2%)
Iranian: 29 (0.2%)
Welsh: 27 (0.2%)
Scotch-Irish: 24 (0.2%)
Russian: 19 (0.1%)
Ghanaian: 18 (0.1%)
Hungarian: 14 (0.09%)
Nigerian: 14 (0.09%)
Arab: 13 (0.08%)
Palestinian: 13 (0.08%)
Danish: 12 (0.08%)
Croatian: 11 (0.07%)
Australian: 11 (0.07%)
Greek: 10 (0.06%)
Swiss: 10 (0.06%)
Eastern European: 9 (0.06%)
Pennsylvania German: 9 (0.06%)
Israeli: 8 (0.05%)
Kenyan: 8 (0.05%)
Celtic: 7 (0.04%)
Ethiopian: 7 (0.04%)
Austrian: 5 (0.03%)
Egyptian: 4 (0.03%)
Most common places of birth for foreign-born residents (%):
Mexico
La Verne:
20.3% (1,047)
California:
37.2% (3,881,193)
Philippines
La Verne:
10.9% (562)
California:
7.8% (818,297)
China, excluding Hong Kong and Taiwan
La Verne:
10.5% (540)
California:
6.6% (684,672)
Korea
La Verne:
9.4% (485)
California:
3.0% (315,248)
Syria
La Verne:
3.7% (191)
California:
0.3% (30,949)
Jordan
La Verne:
3.6% (188)
California:
0.2% (16,384)
Nicaragua
La Verne:
3.6% (184)
California:
0.6% (58,161)
India
La Verne:
3.4% (174)
California:
5.2% (539,184)
Thailand
La Verne:
2.6% (132)
California:
0.6% (65,335)
Vietnam
La Verne:
2.2% (116)
California:
4.9% (512,335)
El Salvador
La Verne:
2.2% (112)
California:
4.2% (440,287)
Australia
La Verne:
2.1% (108)
California:
0.2% (23,338)
Lebanon
La Verne:
1.6% (84)
California:
0.3% (31,757)
Cuba
La Verne:
1.6% (84)
California:
0.3% (30,441)
Guatemala
La Verne:
1.5% (79)
California:
2.8% (290,436)
Place of birth for U.S.-born residents:
This state: 20,347
Other state: 4,748
Northeast: 1,143
Midwest: 1,532
South: 1,304
West: 746
91.1% of La Verne residents lived in the same house 1 years ago. Out of people who lived in different houses, 37.9% lived in this county. Out of people who lived in different counties, 80.2% lived in California.
La Verne:
91.1%
State average:
88.9%
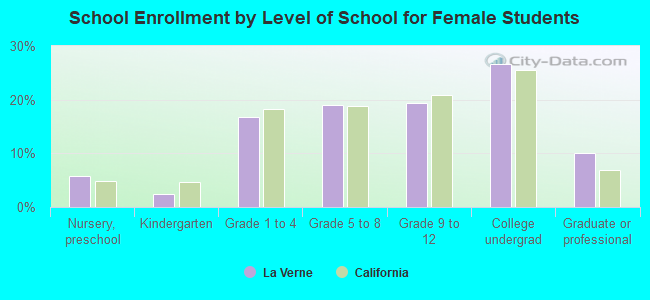
Education attainment for males 25 years and older:
No schooling: 218
Nursery to 4th grade: 0
5th and 6th grade: 55
7th and 8th grade: 36
9th grade: 52
10th grade: 71
11th grade: 112
12th grade, no diploma: 163
High school graduate (or equivalency): 1,988
Less than 1 year of college: 667
Some college more than 1 year, no degree: 1,616
Associate degree: 883
Bachelor's degree: 2,708
Master's degree: 1,266
Professional school degree: 419
Doctorate degree: 362
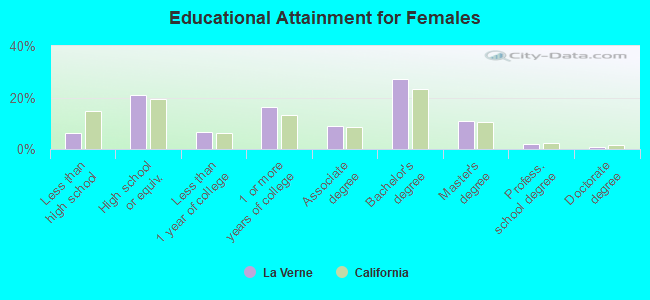
Education attainment for females 25 years and older:
No schooling: 88
Nursery to 4th grade: 27
5th and 6th grade: 112
7th and 8th grade: 133
9th grade: 57
10th grade: 28
11th grade: 89
12th grade, no diploma: 172
High school graduate (or equivalency): 2,458
Less than 1 year of college: 792
Some college more than 1 year, no degree: 1,892
Associate degree: 1,038
Bachelor's degree: 3,159
Master's degree: 1,272
Professional school degree: 246
Doctorate degree: 107
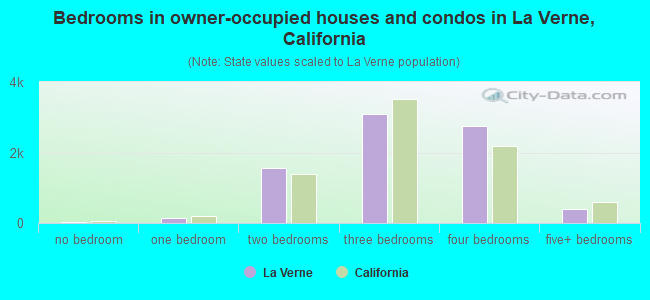
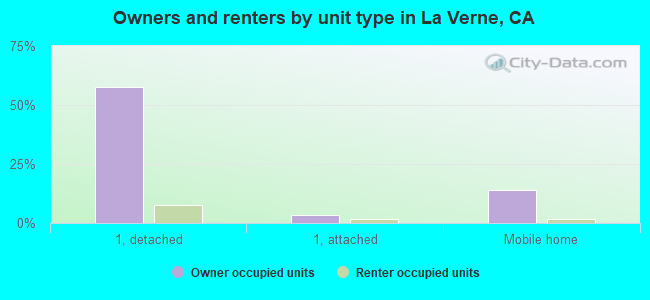
Housing units in structures:
One, detached: 7,525
One, attached: 715
Two: 159
3 or 4: 885
5 to 9: 511
10 to 19: 100
20 to 49: 112
50 or more: 599
Mobile homes: 1,543
Median worth of mobile homes: $183,804
Housing units lacking complete plumbing facilities in 2022: 0.9%
Housing units lacking complete kitchen facilities in 2022: 1.9%
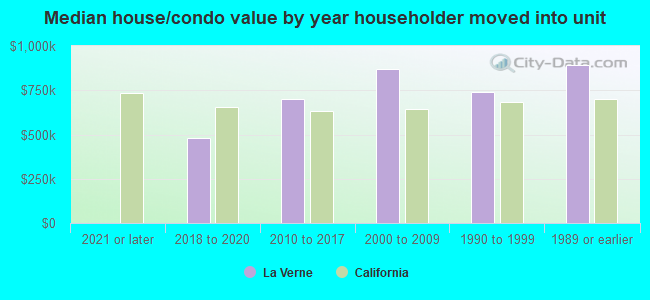
House/condo owner moved in on average 16 years ago