Madison, MS (Mississippi) Houses and Residents
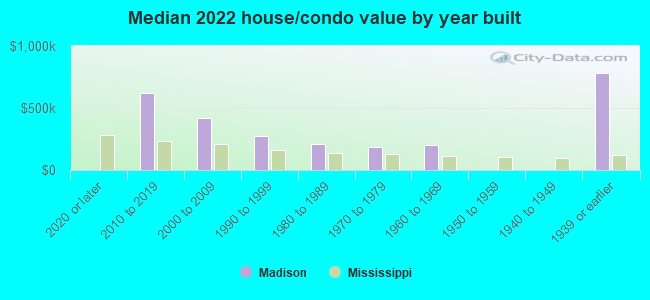
Estimated median house or condo value in 2022: $331,235 (it was $135,400 in 2000 )
Madison:
$331,235Mississippi:
$162,500
Lower value quartile - upper value quartile: $229,650 - $498,705Total population: 25,455 (Urban population: 13,734, Rural population: 969 (51 farm, 918 nonfarm ))
Houses: 10,098 (9,651 occupied: 8,976 owner occupied, 651 renter occupied )
% of renters here:
7%State:
30%
Housing density: 749 houses/condos per square mile
Median price asked for vacant for-sale houses and condos in 2022: $306,643.
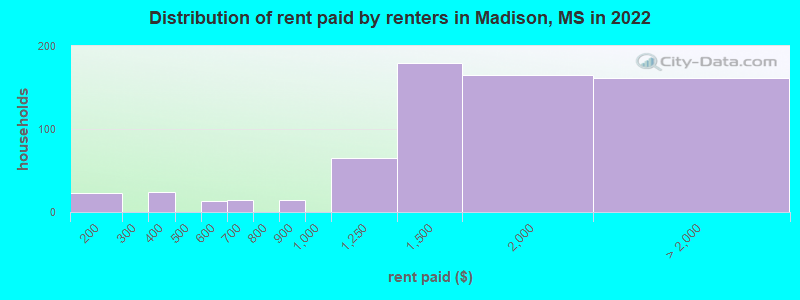
Median contract rent in 2022: $1,502 (lower quartile is $1,209, upper quartile is $1,929)
Median rent asked for vacant for-rent units in 2022: $3,130
Median gross rent in Madison, MS in 2022: $1,752
Housing units in Madison with a mortgage: 6,360 (796 second mortgage, 0 home equity loan, 793 both second mortgage and home equity loan )Houses without a mortgage: 278
Median household income for houses/condos with a mortgage: $129,834
Median household income for apartments without a mortgage: $101,261
Median monthly housing costs: $1,597
Data:
Median house or condo value ($)
Median house or condo value ($ change since 2000)
Median house or condo value ($) - White
Median house or condo value ($) - Black or African American
Median house or condo value ($) - Asian
Median house or condo value ($) - Hispanic or Latino
Median house or condo value ($) - American Indian and Alaska Native
Median house or condo value ($) - Multirace
Median house or condo value ($) - Other Race
Median price asked for mobile homes ($)
Household density (households per square mile)
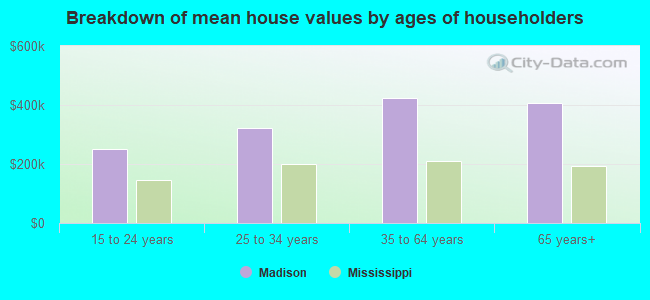
Mean house or condo value by units in structure - 1, detached ($)
Mean house or condo value by units in structure - 1, attached ($)
Mean house or condo value by units in structure - 2 ($)
Mean house or condo value by units in structure by units in structure - 3 or 4 ($)
Mean house or condo value by units in structure - 5 or more ($)
Mean house or condo value by units in structure - Boat, RV, van, etc. ($)
Mean house or condo value by units in structure - Mobile home ($)
Median contract rent ($)
Median contract rent - Lower quartile ($)
Median contract rent - Upper quartile ($)
Median gross rent ($)
Urban houses (%)
Rural houses (%)
Houses occupied (%)
Houses occupied (% change since 2000)
Houses owner occupied (%)
Houses owner occupied (% change since 2000)
Houses renter occupied (%)
Houses renter occupied (% change since 2000)
Vacant housing units - For rent (%)
Vacant housing units - For rent (% change since 2000)
Vacant housing units - For sale only (%)
Vacant housing units - For sale only (% change since 2000)
Vacant housing units - Rented or sold, not occupied (%)
Vacant housing units - Rented or sold, not occupied (% change since 2000)
Vacant housing units - For seasonal, recreational, or occasional use (%)
Vacant housing units - For seasonal, recreational, or occasional use (% change since 2000)
Vacant housing units - For migrant workers (%)
Vacant housing units - For migrant workers (% change since 2000)
Vacant housing units - Other vacant (%)
Vacant housing units - Other vacant (% change since 2000)
Median monthly housing costs ($)
Median household income for houses/condos with a mortgage ($)
Median household income for houses/condos without a mortgage ($)
Median household income ($)
Median household income ($) - White
Median household income ($) - Black or African American
Median household income ($) - Asian
Median household income ($) - Hispanic or Latino
Median household income ($) - American Indian and Alaska Native
Median household income ($) - Multirace
Median household income ($) - Other Race
Mortgage status - with mortgage (%)
Mortgage status - with second mortgage (%)
Mortgage status - with home equity loan (%)
Mortgage status - with both second mortgage and home equity loan (%)
Mortgage status - without a mortgage (%)
Median year house/condo built
Median year apartment built
Household type by relationship - Male householder living alone (%)
Household type by relationship - Male householder not living alone (%)
Household type by relationship - Female householder living alone (%)
Household type by relationship - Female householder not living alone (%)
Household type by relationship - Opposite-Sex spouse (%)
Household type by relationship - Same-Sex spouse (%)
Household type by relationship - Opposite-Sex unmarried partner (%)
Household type by relationship - Same-Sex unmarried partner (%)
Household type by relationship - In group quarters (%)
Size of family households - 2-person household (%)
Size of family households - 3-person household (%)
Size of family households - 4-person household (%)
Size of family households - 5-person household (%)
Size of family households - 6-person household (%)
Size of family households - 7-or-more-person household (%)
Size of nonfamily households - 1-person household (%)
Size of nonfamily households - 2-person household (%)
Size of nonfamily households - 3-person household (%)
Size of nonfamily households - 4-person household (%)
Size of nonfamily households - 5-person household (%)
Size of nonfamily households - 6-person household (%)
Size of nonfamily households - 7-or-moreperson household (%)
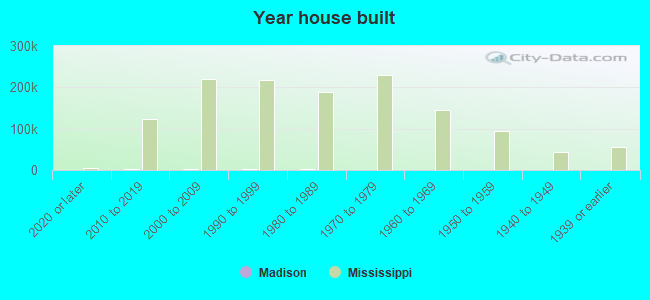
Year house built - Built 2010 or later (%)
Year house built - Built 2000 to 2009 (%)
Year house built - Built 1990 to 1999 (%)
Year house built - Built 1980 to 1989 (%)
Year house built - Built 1970 to 1979 (%)
Year house built - Built 1960 to 1969 (%)
Year house built - Built 1950 to 1959 (%)
Year house built - Built 1940 to 1949 (%)
Year house built - Built 1939 or earlier (%)
Median number of rooms in houses and condos
Median number of rooms in apartments
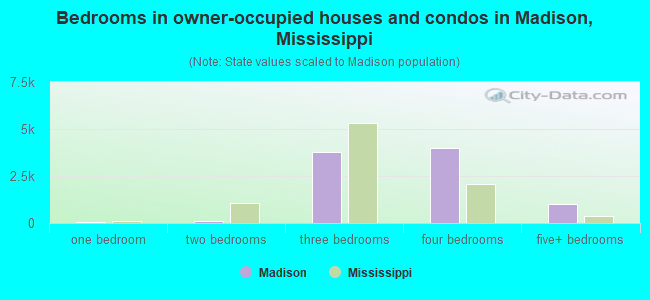
Median number of bedrooms in owner occupied houses
Mean number of bedrooms in owner occupied houses
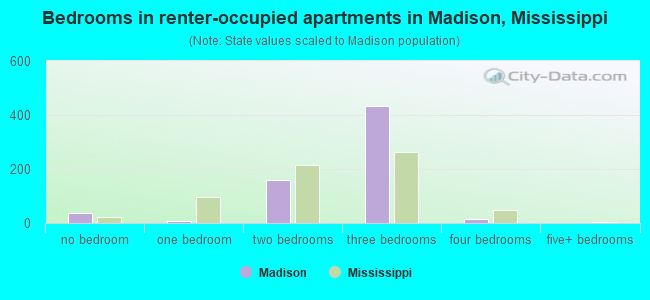
Median number of bedrooms in renter occupied houses
Mean number of bedrooms in renter occupied houses
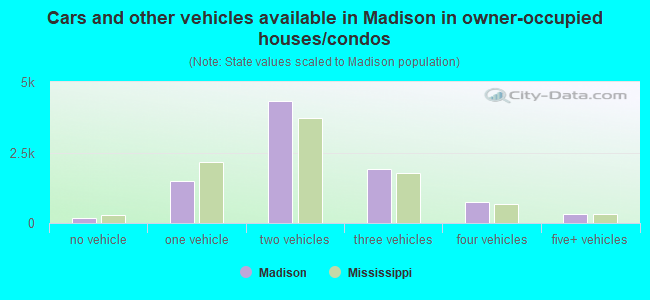
Median number of vehichles in owner occupied houses
Mean number of vehichles in owner occupied houses
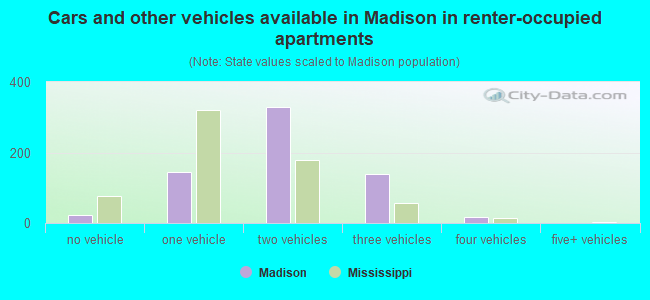
Median number of vehichles in renter occupied houses
Mean number of vehichles in renter occupied houses
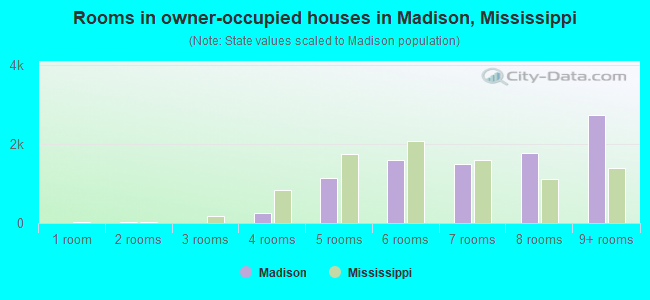
Rooms in owner-occupied houses - 1 room (%)
Rooms in owner-occupied houses - 2 rooms (%)
Rooms in owner-occupied houses - 3 rooms (%)
Rooms in owner-occupied houses - 4 rooms (%)
Rooms in owner-occupied houses - 5 rooms (%)
Rooms in owner-occupied houses - 6 rooms (%)
Rooms in owner-occupied houses - 7 rooms (%)
Rooms in owner-occupied houses - 8 rooms (%)
Rooms in owner-occupied houses - 9+ rooms (%)
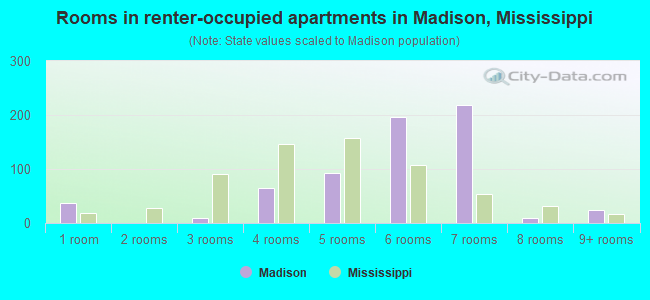
Rooms in renter-occupied houses - 1 room (%)
Rooms in renter-occupied houses - 2 rooms (%)
Rooms in renter-occupied houses - 3 rooms (%)
Rooms in renter-occupied houses - 4 rooms (%)
Rooms in renter-occupied houses - 5 rooms (%)
Rooms in renter-occupied houses - 6 rooms (%)
Rooms in renter-occupied houses - 7 rooms (%)
Rooms in renter-occupied houses - 8 rooms (%)
Rooms in renter-occupied houses - 9+ rooms (%)
Bedrooms in owner-occupied houses - no bedrooms (%)
Bedrooms in owner-occupied houses - 1 bedroom (%)
Bedrooms in owner-occupied houses - 2 bedrooms (%)
Bedrooms in owner-occupied houses - 3 bedrooms (%)
Bedrooms in owner-occupied houses - 4 bedrooms (%)
Bedrooms in owner-occupied houses - 5+ bedrooms (%)
Bedrooms in renter-occupied houses - no bedrooms (%)
Bedrooms in renter-occupied houses - 1 bedroom (%)
Bedrooms in renter-occupied houses - 2 bedrooms (%)
Bedrooms in renter-occupied houses - 3 bedrooms (%)
Bedrooms in renter-occupied houses - 4 bedrooms (%)
Bedrooms in renter-occupied houses - 5+ bedrooms (%)
Vehicles available in owner-occupied houses - no vehicle available (%)
Vehicles available in owner-occupied houses - 1 vehicle available(%)
Vehicles available in owner-occupied houses - 2 Vehicles available (%)
Vehicles available in owner-occupied houses - 3 Vehicles available (%)
Vehicles available in owner-occupied houses - 4 Vehicles available (%)
Vehicles available in owner-occupied houses - 5+ Vehicles available (%)
Vehicles available in renter-occupied houses - no vehicle available (%)
Vehicles available in renter-occupied houses - 1 vehicle available (%)
Vehicles available in renter-occupied houses - 2 Vehicles available (%)
Vehicles available in renter-occupied houses - 3 Vehicles available (%)
Vehicles available in renter-occupied houses - 4 Vehicles available (%)
Vehicles available in renter-occupied houses - 5+ Vehicles available (%)
Housing units in structures - 1, detached (%)
Housing units in structures - 1, attached (%)
Housing units in structures - 2 (%)
Housing units in structures - 3 or 4 (%)
Housing units in structures - 5 to 9 (%)
Housing units in structures - 10 to 19 (%)
Housing units in structures - 20 to 49 (%)
Housing units in structures - 50 or more (%)
Housing units in structures - Mobile home (%)
Housing units in structures - Boat, RV, van, etc. (%)
Housing units in structures - Owners - 1, detached (%)
Housing units in structures - Owners - 1, attached (%)
Housing units in structures - Owners - 2 (%)
Housing units in structures - Owners - 3 or 4 (%)
Housing units in structures - Owners - 5 to 9 (%)
Housing units in structures - Owners - 10 to 19 (%)
Housing units in structures - Owners - 20 to 49 (%)
Housing units in structures - Owners - 50 or more (%)
Housing units in structures - Owners - Mobile home (%)
Housing units in structures - Owners - Boat, RV, van, etc. (%)
Housing units in structures - Renters - 1, detached (%)
Housing units in structures - Renters - 1, attached (%)
Housing units in structures - Renters - 2 (%)
Housing units in structures - Renters - 3 or 4 (%)
Housing units in structures - Renters - 5 to 9 (%)
Housing units in structures - Renters - 10 to 19 (%)
Housing units in structures - Renters - 20 to 49 (%)
Housing units in structures - Renters - 50 or more (%)
Housing units in structures - Renters - Mobile home (%)
Housing units in structures - Renters - Boat, RV, van, etc. (%)
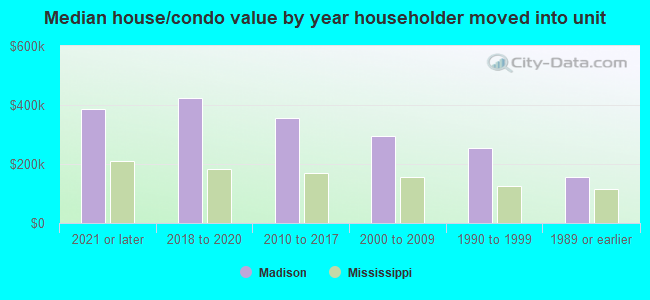
House/condo owner moved in on average (years ago)
Renter moved in on average (years ago)
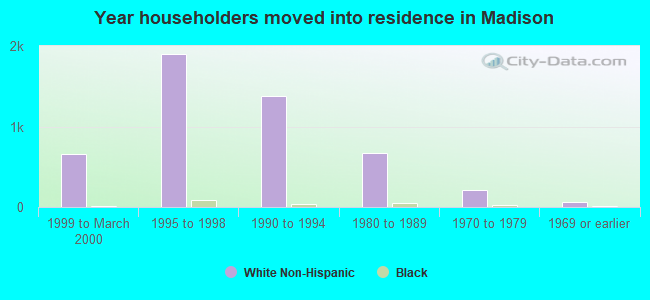
Year householder moved into unit - Moved in 1999 to March 2000 (%)
Year householder moved into unit - Moved in 1999 to March 2000 (%) - White
Year householder moved into unit - Moved in 1999 to March 2000 (%) - Black or African American
Year householder moved into unit - Moved in 1999 to March 2000 (%) - Asian
Year householder moved into unit - Moved in 1999 to March 2000 (%) - Hispanic or Latino
Year householder moved into unit - Moved in 1999 to March 2000 (%) - American Indian and Alaska Native
Year householder moved into unit - Moved in 1999 to March 2000 (%) - Multirace
Year householder moved into unit - Moved in 1999 to March 2000 (%) - Other Race
Year householder moved into unit - Moved in 1995 to 1998 (%)
Year householder moved into unit - Moved in 1995 to 1998 (%) - White
Year householder moved into unit - Moved in 1995 to 1998 (%) - Black or African American
Year householder moved into unit - Moved in 1995 to 1998 (%) - Asian
Year householder moved into unit - Moved in 1995 to 1998 (%) - Hispanic or Latino
Year householder moved into unit - Moved in 1995 to 1998 (%) - American Indian and Alaska Native
Year householder moved into unit - Moved in 1995 to 1998 (%) - Multirace
Year householder moved into unit - Moved in 1995 to 1998 (%) - Other Race
Year householder moved into unit - Moved in 1990 to 1994 (%)
Year householder moved into unit - Moved in 1990 to 1994 (%) - White
Year householder moved into unit - Moved in 1990 to 1994 (%) - Black or African American
Year householder moved into unit - Moved in 1990 to 1994 (%) - Asian
Year householder moved into unit - Moved in 1990 to 1994 (%) - Hispanic or Latino
Year householder moved into unit - Moved in 1990 to 1994 (%) - American Indian and Alaska Native
Year householder moved into unit - Moved in 1990 to 1994 (%) - Multirace
Year householder moved into unit - Moved in 1990 to 1994 (%) - Other Race
Year householder moved into unit - Moved in 1980 to 1989 (%)
Year householder moved into unit - Moved in 1980 to 1989 (%) - White
Year householder moved into unit - Moved in 1980 to 1989 (%) - Black or African American
Year householder moved into unit - Moved in 1980 to 1989 (%) - Asian
Year householder moved into unit - Moved in 1980 to 1989 (%) - Hispanic or Latino
Year householder moved into unit - Moved in 1980 to 1989 (%) - American Indian and Alaska Native
Year householder moved into unit - Moved in 1980 to 1989 (%) - Multirace
Year householder moved into unit - Moved in 1980 to 1989 (%) - Other Race
Year householder moved into unit - Moved in 1970 to 1979 (%)
Year householder moved into unit - Moved in 1970 to 1979 (%) - White
Year householder moved into unit - Moved in 1970 to 1979 (%) - Black or African American
Year householder moved into unit - Moved in 1970 to 1979 (%) - Asian
Year householder moved into unit - Moved in 1970 to 1979 (%) - Hispanic or Latino
Year householder moved into unit - Moved in 1970 to 1979 (%) - American Indian and Alaska Native
Year householder moved into unit - Moved in 1970 to 1979 (%) - Multirace
Year householder moved into unit - Moved in 1970 to 1979 (%) - Other Race
Year householder moved into unit - Moved in 1969 or earlier (%)
Year householder moved into unit - Moved in 1969 or earlier (%) - White
Year householder moved into unit - Moved in 1969 or earlier (%) - Black or African American
Year householder moved into unit - Moved in 1969 or earlier (%) - Asian
Year householder moved into unit - Moved in 1969 or earlier (%) - Hispanic or Latino
Year householder moved into unit - Moved in 1969 or earlier (%) - American Indian and Alaska Native
Year householder moved into unit - Moved in 1969 or earlier (%) - Multirace
Year householder moved into unit - Moved in 1969 or earlier (%) - Other Race
Housing units lacking complete plumbing facilities (%)
Housing units lacking complete kitchen facilities (%)
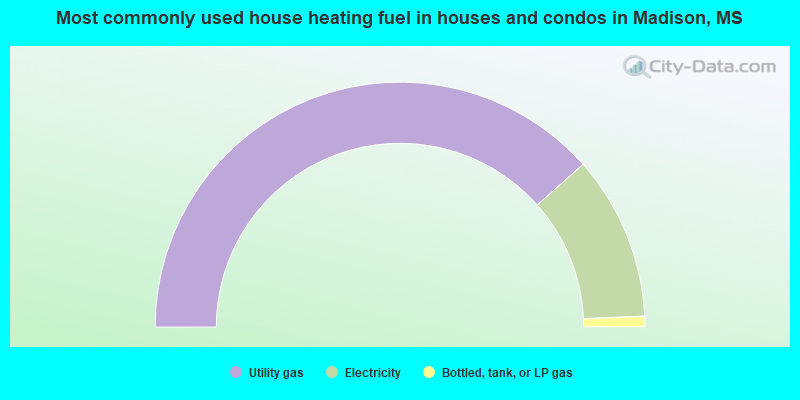
House heating fuel used in houses and condos - Utility gas (%)
House heating fuel used in houses and condos - Bottled, tank, or LP gas (%)
House heating fuel used in houses and condos - Electricity (%)
House heating fuel used in houses and condos - Fuel oil, kerosene, etc. (%)
House heating fuel used in houses and condos - Coal or coke (%)
House heating fuel used in houses and condos - Wood (%)
House heating fuel used in houses and condos - Solar energy (%)
House heating fuel used in houses and condos - Other fuel (%)
House heating fuel used in houses and condos - No fuel used (%)
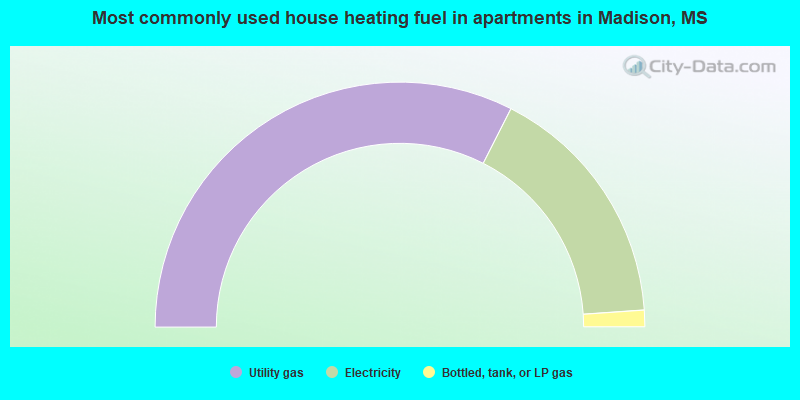
House heating fuel used in apartments - Utility gas (%)
House heating fuel used in apartments - Bottled, tank, or LP gas (%)
House heating fuel used in apartments - Electricity (%)
House heating fuel used in apartments - Fuel oil, kerosene, etc. (%)
House heating fuel used in apartments - Coal or coke (%)
House heating fuel used in apartments - Wood (%)
House heating fuel used in apartments - Solar energy (%)
House heating fuel used in apartments - Other fuel (%)
House heating fuel used in apartments - No fuel used (%)
Latest news about housing in Madison, MS collected exclusively by city-data.com from local newspapers, TV, and radio stations
Median year house/condo built: 1999Median year apartment built: 1990Household type by relationship:
Households: 28,063
Male householders: 5,056 (694 living alone ), Female householders: 4,483 (1,196 living alone )6,976 spouses (6,959 opposite-sex spouses ), 120 unmarried partners , (105 opposite-sex unmarried partners ), 9,393 children (8,675 natural , 152 adopted , 565 stepchildren ), 629 grandchildren , 120 brothers or sisters , 200 parents , 84 foster children , 328 other relatives , 172 non-relatives In group quarters: 497
Size of family households: 2,870 2-persons , 1,442 3-persons , 1,566 4-persons , 1,087 5-persons , 471 6-persons , 90 7-or-more-persons .
Size of nonfamily households: 2,061 1-person , 110 2-persons .
5,692 married couples with children. single-parent households (116 men , 724 women ).
91.7% of residents of Madison speak English at home. of residents speak Spanish at home (75% speak English very well , 19% speak English well , 4% speak English not well , 2% don't speak English at all ).of residents speak other Indo-European language at home (89% speak English very well , 11% speak English well ).of residents speak Asian or Pacific Island language at home (54% speak English very well , 13% speak English well , 13% speak English not well , 20% don't speak English at all ).of residents speak other language at home (94% speak English very well , 6% speak English well ).
Foreign born population: 2,258 (8.0%)of them are naturalized citizens )
Median number of rooms in houses and condos:
Median number of rooms in apartments
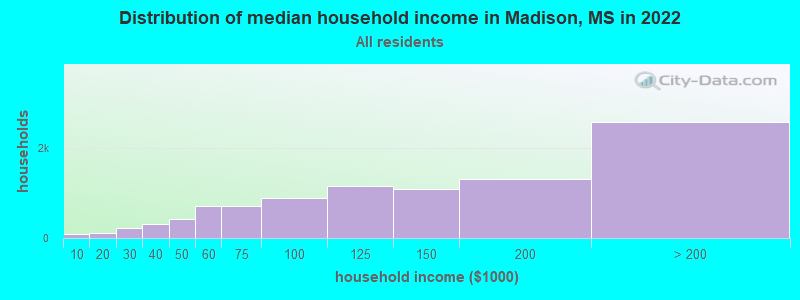
Madison, MS household income distribution 95 Less than $10,000113 $10,000 to $19,999226 $20,000 to $29,999322 $30,000 to $39,999432 $40,000 to $49,999708 $50,000 to $59,999702 $60,000 to $74,999895 $75,000 to $99,9991,155 $100,000 to $124,9991,091 $125,000 to $149,9991,321 $150,000 to $199,9992,585 $200,000 or more
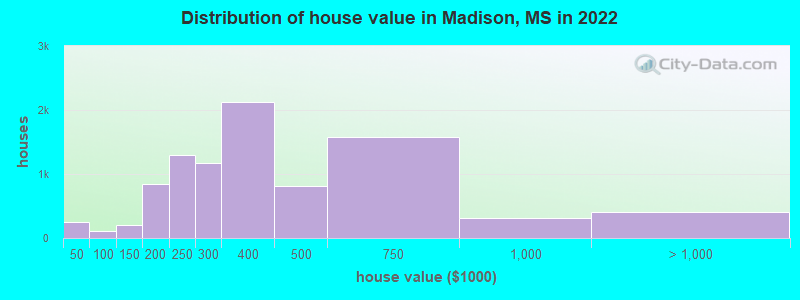
Home value of owner - occupied houses in 2022 in Madison, MS 145 Less than $10,00072 $15,000 to $19,9996 $20,000 to $24,99930 $40,000 to $49,99922 $50,000 to $59,99936 $70,000 to $79,9996 $80,000 to $89,9997 $90,000 to $99,999103 $100,000 to $124,99996 $125,000 to $149,999291 $150,000 to $174,999555 $175,000 to $199,9991,298 $200,000 to $249,9991,165 $250,000 to $299,9992,130 $300,000 to $399,999810 $400,000 to $499,9991,582 $500,000 to $749,999309 $750,000 to $999,999321 $1,000,000 to $1,499,99980 $2,000,000 or moreRent paid by renters in 2022 in Madison, MS 22 $100 to $14924 $300 to $34912 $500 to $54914 $650 to $69913 $800 to $89965 $1,000 to $1,249180 $1,250 to $1,499164 $1,500 to $1,99925 $2,000 to $2,49933 $2,500 to $2,99912 $3,500 or more90 No cash rent
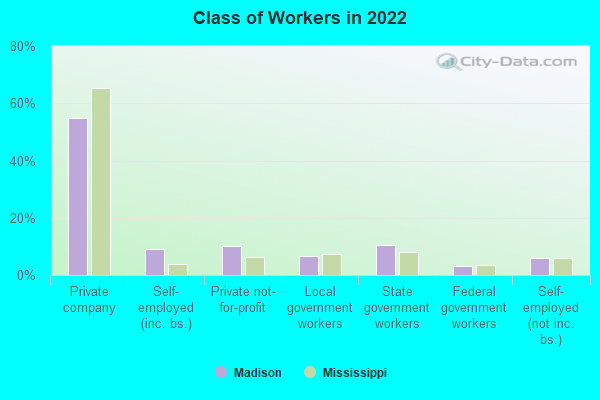
Percentage of workers working in this county: 58.7%Number of people working at home: 1,675 (12.6% of all workers )
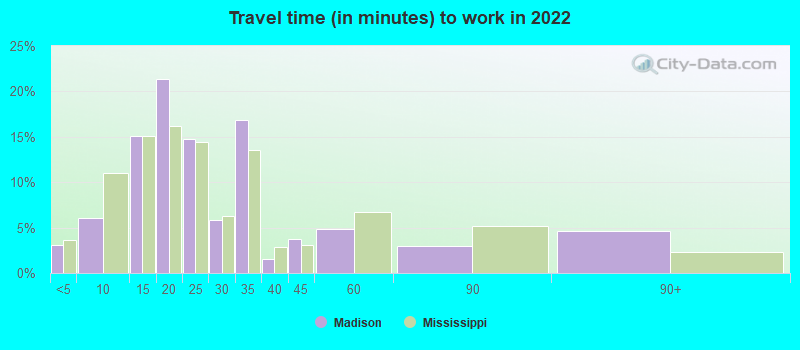
Travel time to work (commute)
Less than 5 minutes: 3665 to 9 minutes: 66110 to 14 minutes: 1,53115 to 19 minutes: 2,60220 to 24 minutes: 2,11125 to 29 minutes: 1,31830 to 34 minutes: 1,90835 to 39 minutes: 10240 to 44 minutes: 25345 to 59 minutes: 35960 to 89 minutes: 13690 or more minutes: 396
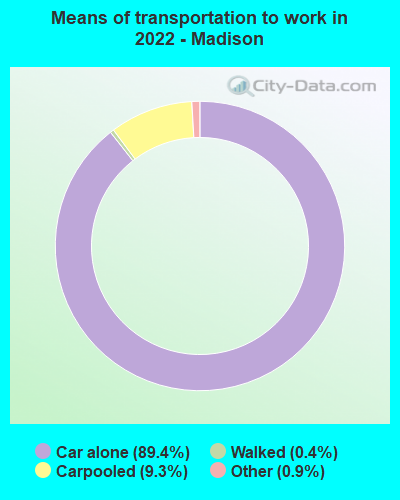
Means of transportation to work:
Drove a car alone: 11,175 (78.9%)Carpooled: 1,295 (9.1%)Taxi: 89 (0.6%)Walked: 66 (0.5%)Worked at home: 1,675 (11.8%)
Unemployment by race in 2022
Unemployment rate for White non-Hispanic residents 1.5% Males4.8% FemalesUnemployment rate for Black residents 2.8% Males4.5% FemalesUnemployment rate for Asian residents 8.4% FemalesUnemployment rate for other race residents 11.4% Males
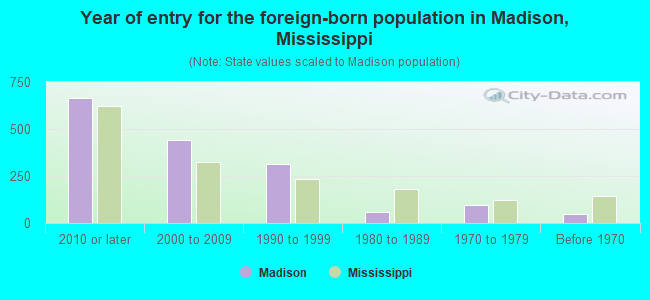
Year of entry for the foreign-born population in Madison, Mississippi
667 2010 or later 443 2000 to 2009 316 1990 to 1999 61 1980 to 1989 98 1970 to 1979 46 Before 1970
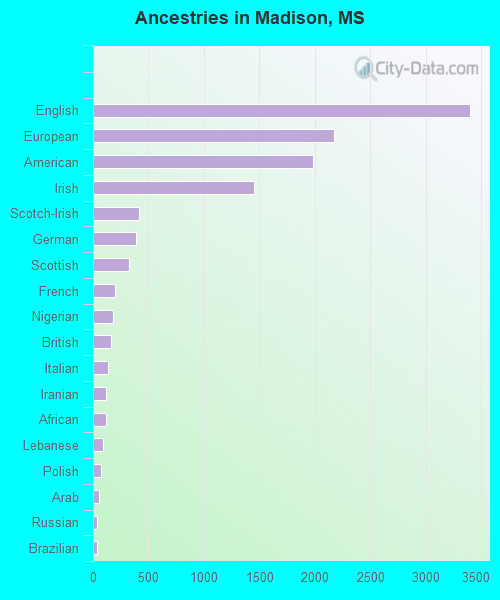
First ancestries reported:
English: 3,402 (19.5%)
European: 2,172 (12.5%)
American: 1,984 (11.4%)
Irish: 1,449 (8.3%)
Scotch-Irish: 413 (2.4%)
German: 384 (2.2%)
Scottish: 324 (1.9%)
French: 202 (1.2%)
Nigerian: 182 (1.0%)
British: 158 (0.9%)
Italian: 136 (0.8%)
Iranian: 120 (0.7%)
African: 118 (0.7%)
Lebanese: 92 (0.5%)
Polish: 68 (0.4%)
Arab: 53 (0.3%)
Russian: 40 (0.2%)
Brazilian: 33 (0.2%)
Norwegian: 30 (0.2%)
Scandinavian: 30 (0.2%)
Welsh: 26 (0.1%)
Northern European: 25 (0.1%)
Ghanaian: 24 (0.1%)
Jordanian: 21 (0.1%)
French Canadian: 21 (0.1%)
Dutch: 19 (0.1%)
Palestinian: 17 (0.10%)
Cajun: 15 (0.09%)
Ukrainian: 13 (0.07%)
South African: 11 (0.06%)
Swiss: 10 (0.06%)
Greek: 9 (0.05%)
Austrian: 8 (0.05%)
Danish: 8 (0.05%)
Portuguese: 6 (0.03%)
West Indian: 2 (0.01%) Most common places of birth for foreign-born residents (%): India Madison:
28.2% (512)Mississippi:
6.3% (4,325)
China, excluding Hong Kong and Taiwan Madison:
19.5% (354)Mississippi:
4.3% (2,948)
Iran Madison:
5.1% (93)Mississippi:
0.4% (305)
Pakistan Madison:
5.1% (92)Mississippi:
0.7% (455)
Peru Madison:
4.7% (86)Mississippi:
1.3% (870)
Nigeria Madison:
4.1% (74)Mississippi:
1.1% (718)
Korea Madison:
3.9% (70)Mississippi:
1.5% (1,043)
Philippines Madison:
3.4% (62)Mississippi:
4.7% (3,211)
Germany Madison:
2.4% (43)Mississippi:
3.1% (2,126)
Poland Madison:
2.3% (42)Mississippi:
0.3% (189)
Vietnam Madison:
2.0% (37)Mississippi:
5.8% (3,948)
Brazil Madison:
1.9% (34)Mississippi:
0.8% (556)
Asia, n.e.c. Madison:
1.7% (30)Mississippi:
0.2% (144)
Mexico Madison:
1.6% (29)Mississippi:
25.4% (17,354)
Place of birth for U.S.-born residents:
This state: 20,047Other state: 5,571Northeast: 460Midwest: 994South: 3,588West: 530 93.2% of Madison residents lived in the same house 1 years ago.
Out of people who lived in different houses, 27.1% lived in this county.
Out of people who lived in different counties, 58.5% lived in Mississippi.
Madison:
93.2%State average:
88.9%
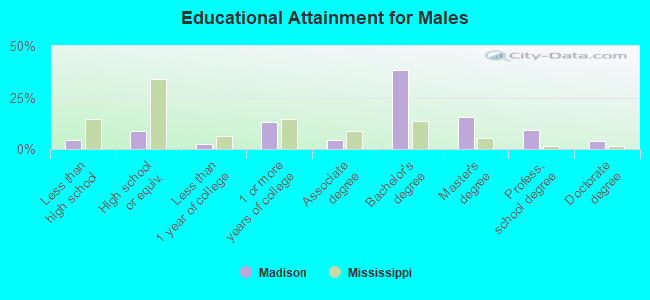
Education attainment for males 25 years and older:
No schooling: 16Nursery to 4th grade: 05th and 6th grade: 247th and 8th grade: 1369th grade: 2110th grade: 311th grade: 912th grade, no diploma: 181High school graduate (or equivalency): 753Less than 1 year of college: 200Some college more than 1 year, no degree: 1,146Associate degree: 365Bachelor's degree: 3,295Master's degree: 1,331Professional school degree: 817Doctorate degree: 341
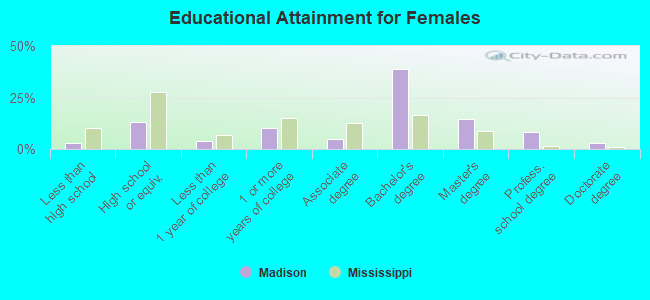
Education attainment for females 25 years and older:
No schooling: 8Nursery to 4th grade: 35th and 6th grade: 537th and 8th grade: 409th grade: 010th grade: 2711th grade: 5212th grade, no diploma: 107High school graduate (or equivalency): 1,238Less than 1 year of college: 374Some college more than 1 year, no degree: 966Associate degree: 477Bachelor's degree: 3,640Master's degree: 1,384Professional school degree: 779Doctorate degree: 279
Housing units in structures:
One, detached: 9,697One, attached: 1193 or 4: 6410 to 19: 650 or more: 98Mobile homes: 111Median worth of mobile homes: $11,825
Housing units lacking complete plumbing facilities in 2022: 1.2%Housing units lacking complete kitchen facilities in 2022: 1.9%House/condo owner moved in on average 10 years ago
Renter moved in on average 0 years ago
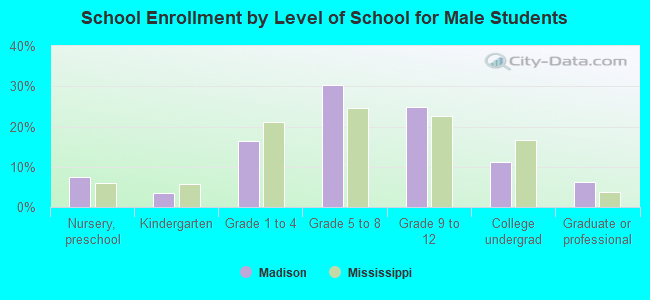
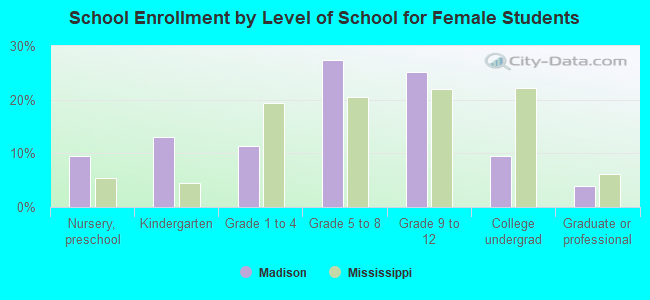
Private vs. public school enrollment:
Students in private schools in grades 1 to 8 (elementary and middle school): 1,248 Here:
34.3%Mississippi:
16.1%
Students in private schools in grades 9 to 12 (high school): 556 Here:
26.5%Mississippi:
14.6%
Students in private undergraduate colleges: 311 Here:
34.4%Mississippi:
12.8%