Midland, MI (Michigan) Houses and Residents
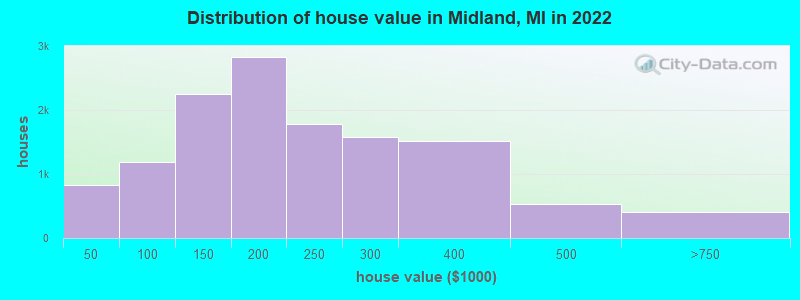
Estimated median house or condo value in 2022: $193,331 (it was $110,400 in 2000 )
Midland:
$193,331Michigan:
$224,400
Lower value quartile - upper value quartile: $134,208 - $281,421Mean price in 2022: Detached houses: $253,629 Here:
$253,629State:
$280,038
Townhouses or other attached units: $235,975 Here:
$235,975State:
$239,520
In 2-unit structures: $244,617 Here:
$244,617State:
$219,481
In 5-or-more-unit structures: $250,550 Here:
$250,550State:
$192,733
Mobile homes: $31,777 Here:
$31,777State:
$72,868
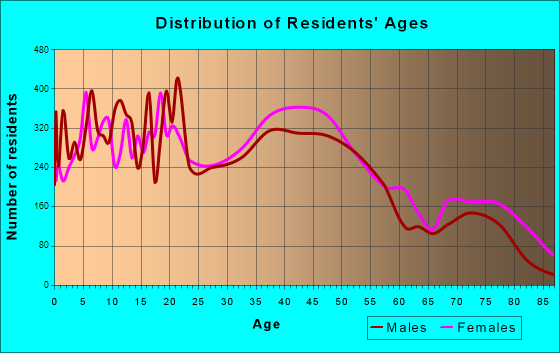
Total population: 41,957 (Urban population: 41,197 (all inside urban clusters), Rural population: 466 (all nonfarm) )
Houses: 19,087 (18,078 occupied: 12,390 owner occupied, 6,102 renter occupied )
% of renters here:
33%State:
27%
Housing density: 575 houses/condos per square mile
Median price asked for vacant for-sale houses and condos in 2022: $146,225.
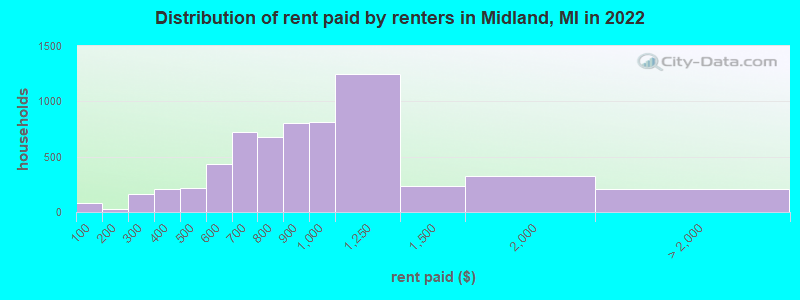
Median contract rent in 2022: $873 (lower quartile is $695, upper quartile is $1,087)
Median rent asked for vacant for-rent units in 2022: $755
Median gross rent in Midland, MI in 2022: $1,028
Housing units in Midland with a mortgage: 7,447 (883 second mortgage, 18 home equity loan, 833 both second mortgage and home equity loan )Houses without a mortgage: 139
Median household income for houses/condos with a mortgage: $106,613
Median household income for apartments without a mortgage: $79,141
Median monthly housing costs: $1,039
Data:
Median house or condo value ($)
Median house or condo value ($ change since 2000)
Median house or condo value ($) - White
Median house or condo value ($) - Black or African American
Median house or condo value ($) - Asian
Median house or condo value ($) - Hispanic or Latino
Median house or condo value ($) - American Indian and Alaska Native
Median house or condo value ($) - Multirace
Median house or condo value ($) - Other Race
Median price asked for mobile homes ($)
Household density (households per square mile)
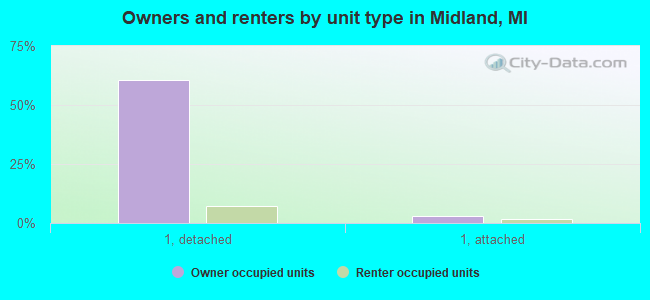
Mean house or condo value by units in structure - 1, detached ($)
Mean house or condo value by units in structure - 1, attached ($)
Mean house or condo value by units in structure - 2 ($)
Mean house or condo value by units in structure by units in structure - 3 or 4 ($)
Mean house or condo value by units in structure - 5 or more ($)
Mean house or condo value by units in structure - Boat, RV, van, etc. ($)
Mean house or condo value by units in structure - Mobile home ($)
Median contract rent ($)
Median contract rent - Lower quartile ($)
Median contract rent - Upper quartile ($)
Median gross rent ($)
Urban houses (%)
Rural houses (%)
Houses occupied (%)
Houses occupied (% change since 2000)
Houses owner occupied (%)
Houses owner occupied (% change since 2000)
Houses renter occupied (%)
Houses renter occupied (% change since 2000)
Vacant housing units - For rent (%)
Vacant housing units - For rent (% change since 2000)
Vacant housing units - For sale only (%)
Vacant housing units - For sale only (% change since 2000)
Vacant housing units - Rented or sold, not occupied (%)
Vacant housing units - Rented or sold, not occupied (% change since 2000)
Vacant housing units - For seasonal, recreational, or occasional use (%)
Vacant housing units - For seasonal, recreational, or occasional use (% change since 2000)
Vacant housing units - For migrant workers (%)
Vacant housing units - For migrant workers (% change since 2000)
Vacant housing units - Other vacant (%)
Vacant housing units - Other vacant (% change since 2000)
Median monthly housing costs ($)
Median household income for houses/condos with a mortgage ($)
Median household income for houses/condos without a mortgage ($)
Median household income ($)
Median household income ($) - White
Median household income ($) - Black or African American
Median household income ($) - Asian
Median household income ($) - Hispanic or Latino
Median household income ($) - American Indian and Alaska Native
Median household income ($) - Multirace
Median household income ($) - Other Race
Mortgage status - with mortgage (%)
Mortgage status - with second mortgage (%)
Mortgage status - with home equity loan (%)
Mortgage status - with both second mortgage and home equity loan (%)
Mortgage status - without a mortgage (%)
Median year house/condo built
Median year apartment built
Household type by relationship - Male householder living alone (%)
Household type by relationship - Male householder not living alone (%)
Household type by relationship - Female householder living alone (%)
Household type by relationship - Female householder not living alone (%)
Household type by relationship - Opposite-Sex spouse (%)
Household type by relationship - Same-Sex spouse (%)
Household type by relationship - Opposite-Sex unmarried partner (%)
Household type by relationship - Same-Sex unmarried partner (%)
Household type by relationship - In group quarters (%)
Size of family households - 2-person household (%)
Size of family households - 3-person household (%)
Size of family households - 4-person household (%)
Size of family households - 5-person household (%)
Size of family households - 6-person household (%)
Size of family households - 7-or-more-person household (%)
Size of nonfamily households - 1-person household (%)
Size of nonfamily households - 2-person household (%)
Size of nonfamily households - 3-person household (%)
Size of nonfamily households - 4-person household (%)
Size of nonfamily households - 5-person household (%)
Size of nonfamily households - 6-person household (%)
Size of nonfamily households - 7-or-moreperson household (%)
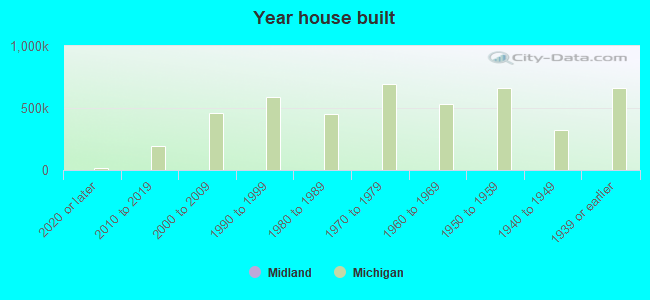
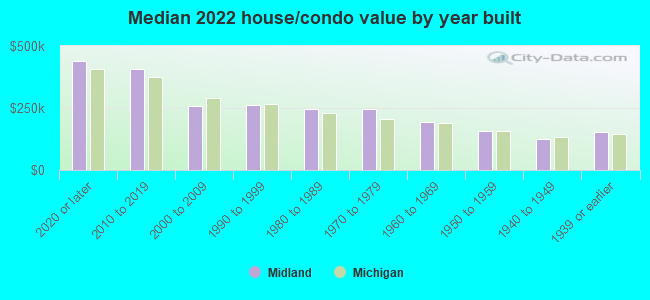
Year house built - Built 2010 or later (%)
Year house built - Built 2000 to 2009 (%)
Year house built - Built 1990 to 1999 (%)
Year house built - Built 1980 to 1989 (%)
Year house built - Built 1970 to 1979 (%)
Year house built - Built 1960 to 1969 (%)
Year house built - Built 1950 to 1959 (%)
Year house built - Built 1940 to 1949 (%)
Year house built - Built 1939 or earlier (%)
Median number of rooms in houses and condos
Median number of rooms in apartments
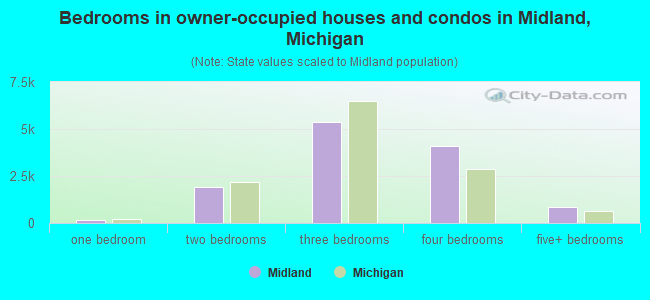
Median number of bedrooms in owner occupied houses
Mean number of bedrooms in owner occupied houses
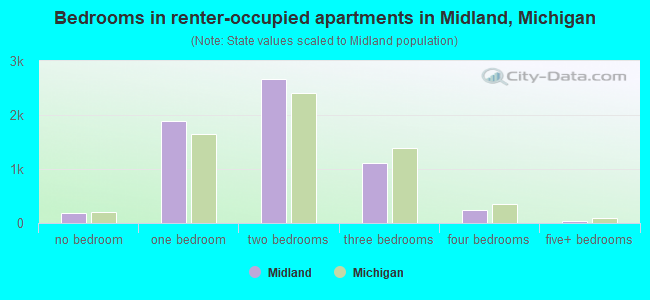
Median number of bedrooms in renter occupied houses
Mean number of bedrooms in renter occupied houses
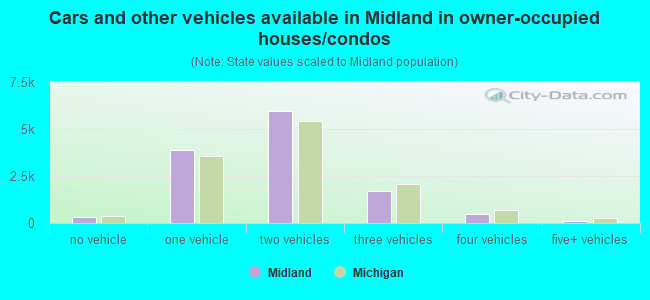
Median number of vehichles in owner occupied houses
Mean number of vehichles in owner occupied houses
Median number of vehichles in renter occupied houses
Mean number of vehichles in renter occupied houses
Rooms in owner-occupied houses - 1 room (%)
Rooms in owner-occupied houses - 2 rooms (%)
Rooms in owner-occupied houses - 3 rooms (%)
Rooms in owner-occupied houses - 4 rooms (%)
Rooms in owner-occupied houses - 5 rooms (%)
Rooms in owner-occupied houses - 6 rooms (%)
Rooms in owner-occupied houses - 7 rooms (%)
Rooms in owner-occupied houses - 8 rooms (%)
Rooms in owner-occupied houses - 9+ rooms (%)
Rooms in renter-occupied houses - 1 room (%)
Rooms in renter-occupied houses - 2 rooms (%)
Rooms in renter-occupied houses - 3 rooms (%)
Rooms in renter-occupied houses - 4 rooms (%)
Rooms in renter-occupied houses - 5 rooms (%)
Rooms in renter-occupied houses - 6 rooms (%)
Rooms in renter-occupied houses - 7 rooms (%)
Rooms in renter-occupied houses - 8 rooms (%)
Rooms in renter-occupied houses - 9+ rooms (%)
Bedrooms in owner-occupied houses - no bedrooms (%)
Bedrooms in owner-occupied houses - 1 bedroom (%)
Bedrooms in owner-occupied houses - 2 bedrooms (%)
Bedrooms in owner-occupied houses - 3 bedrooms (%)
Bedrooms in owner-occupied houses - 4 bedrooms (%)
Bedrooms in owner-occupied houses - 5+ bedrooms (%)
Bedrooms in renter-occupied houses - no bedrooms (%)
Bedrooms in renter-occupied houses - 1 bedroom (%)
Bedrooms in renter-occupied houses - 2 bedrooms (%)
Bedrooms in renter-occupied houses - 3 bedrooms (%)
Bedrooms in renter-occupied houses - 4 bedrooms (%)
Bedrooms in renter-occupied houses - 5+ bedrooms (%)
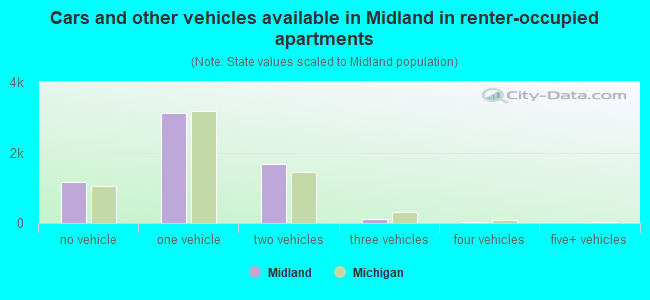
Vehicles available in owner-occupied houses - no vehicle available (%)
Vehicles available in owner-occupied houses - 1 vehicle available(%)
Vehicles available in owner-occupied houses - 2 Vehicles available (%)
Vehicles available in owner-occupied houses - 3 Vehicles available (%)
Vehicles available in owner-occupied houses - 4 Vehicles available (%)
Vehicles available in owner-occupied houses - 5+ Vehicles available (%)
Vehicles available in renter-occupied houses - no vehicle available (%)
Vehicles available in renter-occupied houses - 1 vehicle available (%)
Vehicles available in renter-occupied houses - 2 Vehicles available (%)
Vehicles available in renter-occupied houses - 3 Vehicles available (%)
Vehicles available in renter-occupied houses - 4 Vehicles available (%)
Vehicles available in renter-occupied houses - 5+ Vehicles available (%)
Housing units in structures - 1, detached (%)
Housing units in structures - 1, attached (%)
Housing units in structures - 2 (%)
Housing units in structures - 3 or 4 (%)
Housing units in structures - 5 to 9 (%)
Housing units in structures - 10 to 19 (%)
Housing units in structures - 20 to 49 (%)
Housing units in structures - 50 or more (%)
Housing units in structures - Mobile home (%)
Housing units in structures - Boat, RV, van, etc. (%)
Housing units in structures - Owners - 1, detached (%)
Housing units in structures - Owners - 1, attached (%)
Housing units in structures - Owners - 2 (%)
Housing units in structures - Owners - 3 or 4 (%)
Housing units in structures - Owners - 5 to 9 (%)
Housing units in structures - Owners - 10 to 19 (%)
Housing units in structures - Owners - 20 to 49 (%)
Housing units in structures - Owners - 50 or more (%)
Housing units in structures - Owners - Mobile home (%)
Housing units in structures - Owners - Boat, RV, van, etc. (%)
Housing units in structures - Renters - 1, detached (%)
Housing units in structures - Renters - 1, attached (%)
Housing units in structures - Renters - 2 (%)
Housing units in structures - Renters - 3 or 4 (%)
Housing units in structures - Renters - 5 to 9 (%)
Housing units in structures - Renters - 10 to 19 (%)
Housing units in structures - Renters - 20 to 49 (%)
Housing units in structures - Renters - 50 or more (%)
Housing units in structures - Renters - Mobile home (%)
Housing units in structures - Renters - Boat, RV, van, etc. (%)
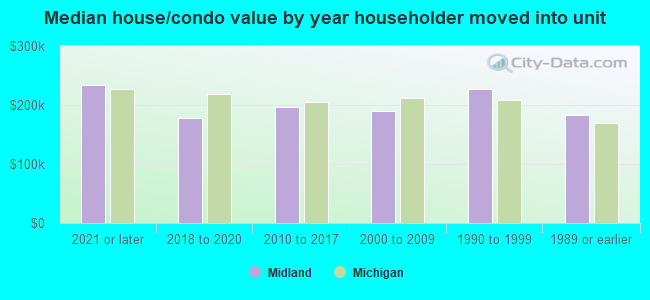
House/condo owner moved in on average (years ago)
Renter moved in on average (years ago)
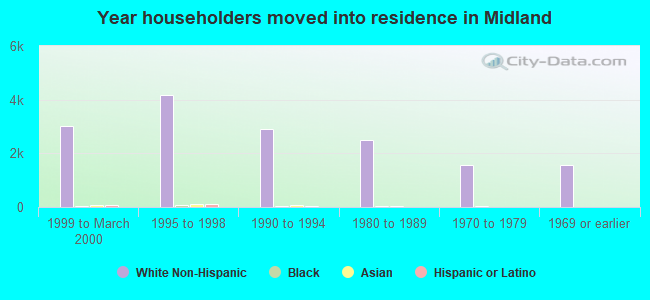
Year householder moved into unit - Moved in 1999 to March 2000 (%)
Year householder moved into unit - Moved in 1999 to March 2000 (%) - White
Year householder moved into unit - Moved in 1999 to March 2000 (%) - Black or African American
Year householder moved into unit - Moved in 1999 to March 2000 (%) - Asian
Year householder moved into unit - Moved in 1999 to March 2000 (%) - Hispanic or Latino
Year householder moved into unit - Moved in 1999 to March 2000 (%) - American Indian and Alaska Native
Year householder moved into unit - Moved in 1999 to March 2000 (%) - Multirace
Year householder moved into unit - Moved in 1999 to March 2000 (%) - Other Race
Year householder moved into unit - Moved in 1995 to 1998 (%)
Year householder moved into unit - Moved in 1995 to 1998 (%) - White
Year householder moved into unit - Moved in 1995 to 1998 (%) - Black or African American
Year householder moved into unit - Moved in 1995 to 1998 (%) - Asian
Year householder moved into unit - Moved in 1995 to 1998 (%) - Hispanic or Latino
Year householder moved into unit - Moved in 1995 to 1998 (%) - American Indian and Alaska Native
Year householder moved into unit - Moved in 1995 to 1998 (%) - Multirace
Year householder moved into unit - Moved in 1995 to 1998 (%) - Other Race
Year householder moved into unit - Moved in 1990 to 1994 (%)
Year householder moved into unit - Moved in 1990 to 1994 (%) - White
Year householder moved into unit - Moved in 1990 to 1994 (%) - Black or African American
Year householder moved into unit - Moved in 1990 to 1994 (%) - Asian
Year householder moved into unit - Moved in 1990 to 1994 (%) - Hispanic or Latino
Year householder moved into unit - Moved in 1990 to 1994 (%) - American Indian and Alaska Native
Year householder moved into unit - Moved in 1990 to 1994 (%) - Multirace
Year householder moved into unit - Moved in 1990 to 1994 (%) - Other Race
Year householder moved into unit - Moved in 1980 to 1989 (%)
Year householder moved into unit - Moved in 1980 to 1989 (%) - White
Year householder moved into unit - Moved in 1980 to 1989 (%) - Black or African American
Year householder moved into unit - Moved in 1980 to 1989 (%) - Asian
Year householder moved into unit - Moved in 1980 to 1989 (%) - Hispanic or Latino
Year householder moved into unit - Moved in 1980 to 1989 (%) - American Indian and Alaska Native
Year householder moved into unit - Moved in 1980 to 1989 (%) - Multirace
Year householder moved into unit - Moved in 1980 to 1989 (%) - Other Race
Year householder moved into unit - Moved in 1970 to 1979 (%)
Year householder moved into unit - Moved in 1970 to 1979 (%) - White
Year householder moved into unit - Moved in 1970 to 1979 (%) - Black or African American
Year householder moved into unit - Moved in 1970 to 1979 (%) - Asian
Year householder moved into unit - Moved in 1970 to 1979 (%) - Hispanic or Latino
Year householder moved into unit - Moved in 1970 to 1979 (%) - American Indian and Alaska Native
Year householder moved into unit - Moved in 1970 to 1979 (%) - Multirace
Year householder moved into unit - Moved in 1970 to 1979 (%) - Other Race
Year householder moved into unit - Moved in 1969 or earlier (%)
Year householder moved into unit - Moved in 1969 or earlier (%) - White
Year householder moved into unit - Moved in 1969 or earlier (%) - Black or African American
Year householder moved into unit - Moved in 1969 or earlier (%) - Asian
Year householder moved into unit - Moved in 1969 or earlier (%) - Hispanic or Latino
Year householder moved into unit - Moved in 1969 or earlier (%) - American Indian and Alaska Native
Year householder moved into unit - Moved in 1969 or earlier (%) - Multirace
Year householder moved into unit - Moved in 1969 or earlier (%) - Other Race
Housing units lacking complete plumbing facilities (%)
Housing units lacking complete kitchen facilities (%)
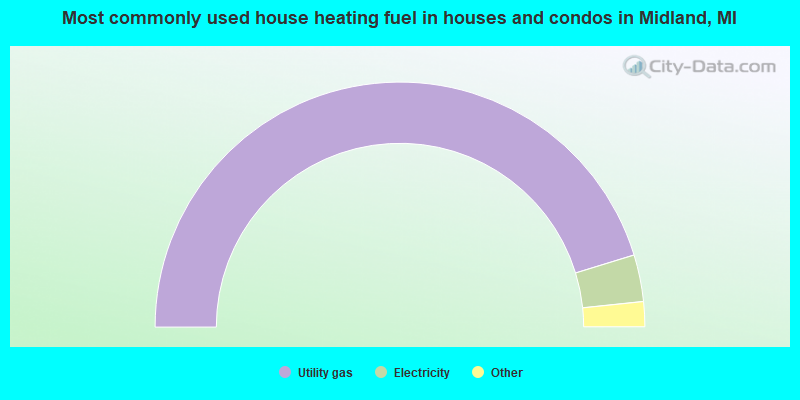
House heating fuel used in houses and condos - Utility gas (%)
House heating fuel used in houses and condos - Bottled, tank, or LP gas (%)
House heating fuel used in houses and condos - Electricity (%)
House heating fuel used in houses and condos - Fuel oil, kerosene, etc. (%)
House heating fuel used in houses and condos - Coal or coke (%)
House heating fuel used in houses and condos - Wood (%)
House heating fuel used in houses and condos - Solar energy (%)
House heating fuel used in houses and condos - Other fuel (%)
House heating fuel used in houses and condos - No fuel used (%)
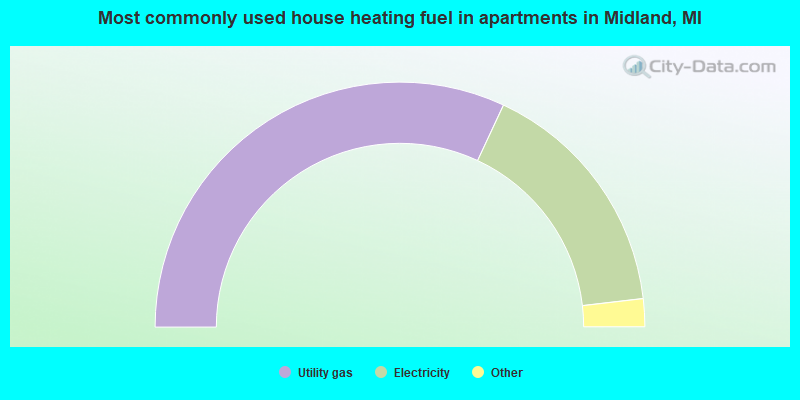
House heating fuel used in apartments - Utility gas (%)
House heating fuel used in apartments - Bottled, tank, or LP gas (%)
House heating fuel used in apartments - Electricity (%)
House heating fuel used in apartments - Fuel oil, kerosene, etc. (%)
House heating fuel used in apartments - Coal or coke (%)
House heating fuel used in apartments - Wood (%)
House heating fuel used in apartments - Solar energy (%)
House heating fuel used in apartments - Other fuel (%)
House heating fuel used in apartments - No fuel used (%)
Latest news about housing in Midland, MI collected exclusively by city-data.com from local newspapers, TV, and radio stations
Median year house/condo built: 1969Median year apartment built: 1973Household type by relationship:
Households: 42,490
Male householders: 8,828 (2,608 living alone ), Female householders: 9,184 (3,527 living alone )8,679 spouses (8,609 opposite-sex spouses ), 1,035 unmarried partners , (969 opposite-sex unmarried partners ), 11,406 children (10,598 natural , 193 adopted , 614 stepchildren ), 330 grandchildren , 259 brothers or sisters , 397 parents , 37 foster children , 543 other relatives , 717 non-relatives In group quarters: 1,071
Size of family households: 5,467 2-persons , 1,886 3-persons , 2,194 4-persons , 1,043 5-persons , 161 6-persons , 429 7-or-more-persons .
Size of nonfamily households: 6,026 1-person , 1,129 2-persons , 61 3-persons , 22 4-persons .
7,389 married couples with children. single-parent households (162 men , 953 women ).
94.8% of residents of Midland speak English at home. of residents speak Spanish at home (73% speak English very well , 7% speak English well , 18% speak English not well , 1% don't speak English at all ).of residents speak other Indo-European language at home (91% speak English very well , 5% speak English well , 4% speak English not well ).of residents speak Asian or Pacific Island language at home (64% speak English very well , 27% speak English well , 9% speak English not well ).
Foreign born population: 2,442 (5.7%)of them are naturalized citizens )
Median number of rooms in houses and condos:
Median number of rooms in apartments
Owner-occupied Renter-occupied
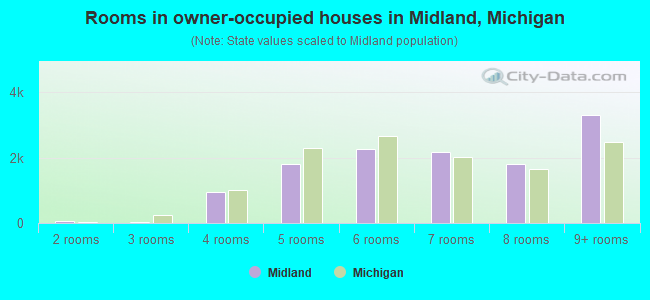
Rooms in owner-occupied houses in Midland, Michigan
0 1 room 47 2 rooms 30 3 rooms 952 4 rooms 1,811 5 rooms 2,265 6 rooms 2,170 7 rooms 1,810 8 rooms 3,307 9+ rooms
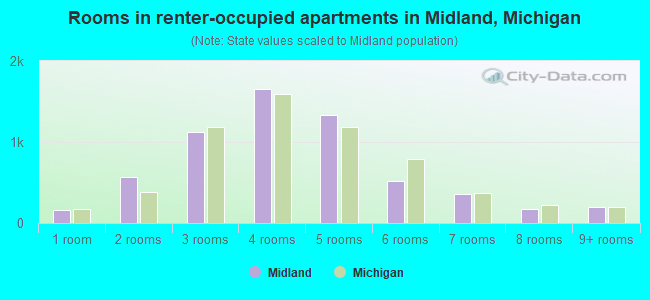
Rooms in renter-occupied apartments in Midland, Michigan
158 1 room 569 2 rooms 1,128 3 rooms 1,659 4 rooms 1,337 5 rooms 519 6 rooms 359 7 rooms 171 8 rooms 203 9+ rooms
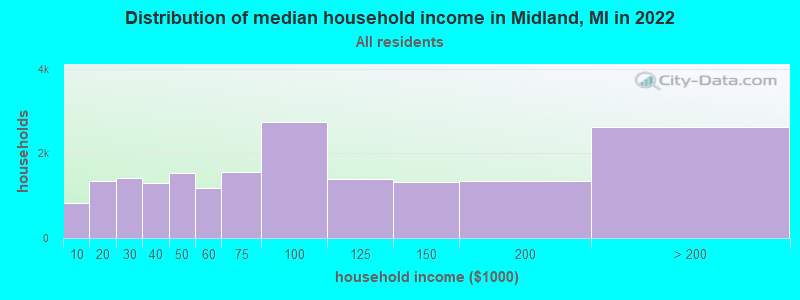
Midland, MI household income distribution 819 Less than $10,0001,339 $10,000 to $19,9991,415 $20,000 to $29,9991,289 $30,000 to $39,9991,533 $40,000 to $49,9991,188 $50,000 to $59,9991,559 $60,000 to $74,9992,740 $75,000 to $99,9991,390 $100,000 to $124,9991,321 $125,000 to $149,9991,338 $150,000 to $199,9992,620 $200,000 or more
Home value of owner - occupied houses in 2022 in Midland, MI 285 Less than $10,000289 $10,000 to $14,9997 $15,000 to $19,99952 $20,000 to $24,99918 $25,000 to $29,99950 $35,000 to $39,999129 $40,000 to $49,99988 $50,000 to $59,99950 $60,000 to $69,999379 $70,000 to $79,999338 $80,000 to $89,999195 $90,000 to $99,9991,081 $100,000 to $124,9991,161 $125,000 to $149,9991,545 $150,000 to $174,9991,284 $175,000 to $199,9991,779 $200,000 to $249,9991,574 $250,000 to $299,9991,517 $300,000 to $399,999528 $400,000 to $499,999367 $500,000 to $749,99930 $750,000 to $999,9998 $1,000,000 to $1,499,9997 $2,000,000 or moreRent paid by renters in 2022 in Midland, MI 80 Less than $10011 $100 to $14913 $150 to $199116 $200 to $24942 $250 to $29984 $300 to $349124 $350 to $39968 $400 to $449147 $450 to $499158 $500 to $549278 $550 to $599248 $600 to $649474 $650 to $699403 $700 to $749276 $750 to $799799 $800 to $899811 $900 to $9991,243 $1,000 to $1,249231 $1,250 to $1,499320 $1,500 to $1,99911 $2,000 to $2,49954 $3,000 to $3,49936 $3,500 or more111 No cash rent
Percentage of workers working in this county: 74.3%Number of people working at home: 2,527 (13.0% of all workers )
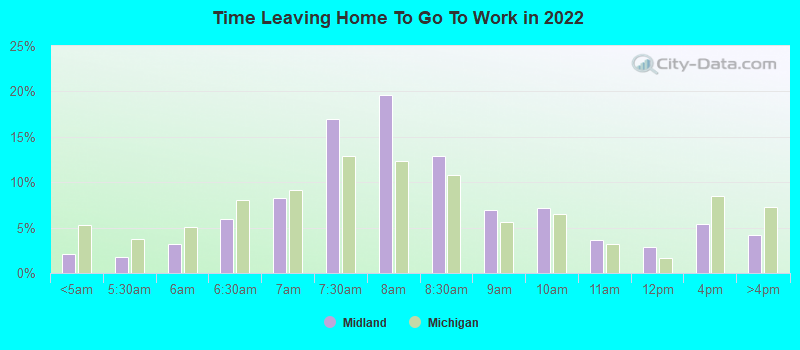
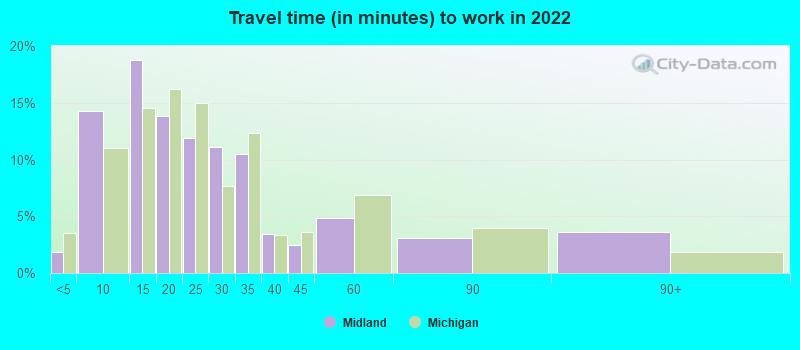
Travel time to work (commute)
Less than 5 minutes: 5245 to 9 minutes: 4,02410 to 14 minutes: 4,13915 to 19 minutes: 2,08520 to 24 minutes: 1,25325 to 29 minutes: 99830 to 34 minutes: 1,47435 to 39 minutes: 53540 to 44 minutes: 77145 to 59 minutes: 30860 to 89 minutes: 50690 or more minutes: 724
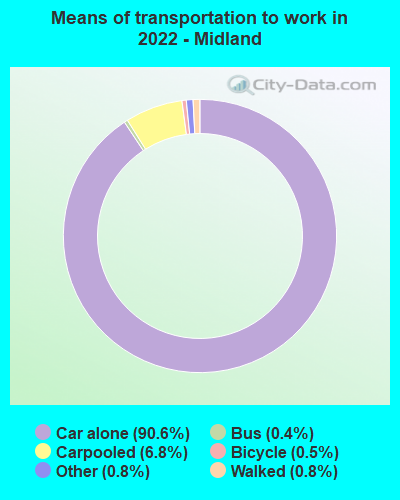
Means of transportation to work:
Drove a car alone: 26,625 (81.9%)Carpooled: 2,027 (6.2%)Bus : 93 (0.3%)Long-distance train or commuter rail : 3 (0.0%)Ferryboat: 2 (0.0%)Taxi: 296 (0.9%)Bicycle: 160 (0.5%)Walked: 237 (0.7%)Worked at home: 2,527 (7.8%)
Unemployment by race in 2022
Unemployment rate for White non-Hispanic residents 3.9% Males3.8% FemalesUnemployment rate for Black residents 8.8% Males8.1% FemalesUnemployment rate for Asian residents 1.7% MalesUnemployment rate for other race residents 10.0% FemalesUnemployment rate for Hispanic or Latino residents 4.0% Females
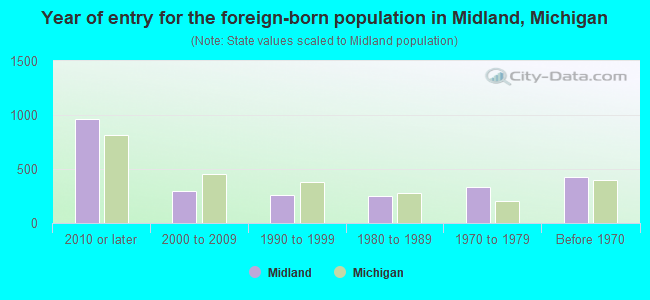
Year of entry for the foreign-born population in Midland, Michigan
965 2010 or later 293 2000 to 2009 259 1990 to 1999 254 1980 to 1989 332 1970 to 1979 425 Before 1970
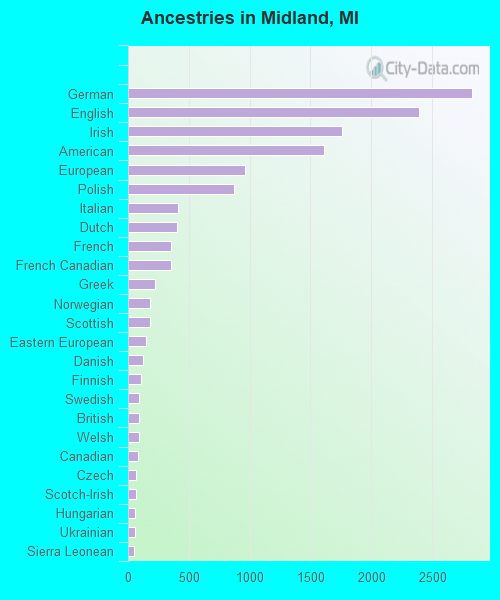
First ancestries reported:
German: 2,827 (16.8%)
English: 2,392 (14.2%)
Irish: 1,762 (10.5%)
American: 1,610 (9.6%)
European: 959 (5.7%)
Polish: 872 (5.2%)
Italian: 410 (2.4%)
Dutch: 403 (2.4%)
French: 357 (2.1%)
French Canadian: 354 (2.1%)
Greek: 218 (1.3%)
Norwegian: 185 (1.1%)
Scottish: 182 (1.1%)
Eastern European: 152 (0.9%)
Danish: 125 (0.7%)
Finnish: 105 (0.6%)
Swedish: 91 (0.5%)
British: 87 (0.5%)
Welsh: 87 (0.5%)
Canadian: 82 (0.5%)
Czech: 67 (0.4%)
Scotch-Irish: 62 (0.4%)
Hungarian: 60 (0.4%)
Ukrainian: 59 (0.4%)
Sierra Leonean: 53 (0.3%)
Belgian: 41 (0.2%)
Lebanese: 31 (0.2%)
Ghanaian: 28 (0.2%)
Lithuanian: 23 (0.1%)
Armenian: 19 (0.1%)
Pennsylvania German: 18 (0.1%)
Iranian: 17 (0.1%)
Russian: 15 (0.09%)
Scandinavian: 15 (0.09%)
Albanian: 15 (0.09%)
Romanian: 14 (0.08%)
Northern European: 14 (0.08%)
Slavic: 13 (0.08%)
Syrian: 12 (0.07%)
Slovak: 7 (0.04%)
Czechoslovakian: 6 (0.04%)
Jamaican: 6 (0.04%) Most common places of birth for foreign-born residents (%): India Midland:
17.7% (327)Michigan:
11.1% (77,240)
China, excluding Hong Kong and Taiwan Midland:
10.7% (199)Michigan:
4.9% (34,295)
Canada Midland:
9.8% (181)Michigan:
5.0% (35,052)
Mexico Midland:
5.6% (104)Michigan:
10.9% (75,965)
Korea Midland:
4.0% (74)Michigan:
3.0% (20,884)
Vietnam Midland:
3.3% (62)Michigan:
1.8% (12,679)
Taiwan Midland:
3.3% (61)Michigan:
0.6% (4,450)
Philippines Midland:
3.1% (58)Michigan:
2.8% (19,112)
Germany Midland:
2.9% (54)Michigan:
2.3% (16,126)
Argentina Midland:
2.9% (53)Michigan:
0.2% (1,346)
Pakistan Midland:
2.8% (52)Michigan:
1.5% (10,596)
France Midland:
2.2% (40)Michigan:
0.4% (2,568)
England Midland:
2.1% (39)Michigan:
0.9% (6,424)
Ghana Midland:
1.9% (35)Michigan:
0.3% (1,811)
United Kingdom, excluding England and Scotland Midland:
1.8% (34)Michigan:
0.8% (5,492)
Colombia Midland:
1.8% (34)Michigan:
0.6% (3,969)
Cuba Midland:
1.8% (33)Michigan:
0.9% (6,481)
Netherlands Midland:
1.7% (31)Michigan:
0.5% (3,681)
Hong Kong Midland:
1.6% (29)Michigan:
0.2% (1,685)
Place of birth for U.S.-born residents:
This state: 30,397Other state: 9,673Northeast: 2,311Midwest: 3,695South: 2,671West: 1,072 85.1% of Midland residents lived in the same house 1 years ago.
Out of people who lived in different houses, 29.0% lived in this county.
Out of people who lived in different counties, 54.0% lived in Michigan.
Midland:
85.1%State average:
88.4%
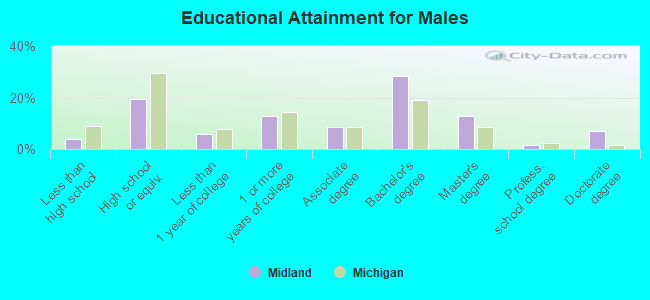
Education attainment for males 25 years and older:
No schooling: 54Nursery to 4th grade: 05th and 6th grade: 07th and 8th grade: 99th grade: 12410th grade: 8711th grade: 13412th grade, no diploma: 174High school graduate (or equivalency): 2,829Less than 1 year of college: 826Some college more than 1 year, no degree: 1,856Associate degree: 1,238Bachelor's degree: 4,096Master's degree: 1,832Professional school degree: 202Doctorate degree: 1,023
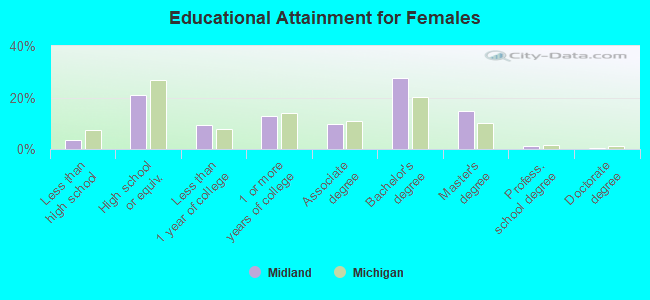
Education attainment for females 25 years and older:
No schooling: 76Nursery to 4th grade: 105th and 6th grade: 127th and 8th grade: 489th grade: 8010th grade: 1211th grade: 12312th grade, no diploma: 172High school graduate (or equivalency): 3,390Less than 1 year of college: 1,491Some college more than 1 year, no degree: 2,047Associate degree: 1,562Bachelor's degree: 4,418Master's degree: 2,395Professional school degree: 205Doctorate degree: 84
Housing units in structures:
One, detached: 12,681One, attached: 1,094Two: 4463 or 4: 3575 to 9: 1,31810 to 19: 1,03420 to 49: 53750 or more: 1,046Mobile homes: 571Median worth of mobile homes: $26,450
Housing units lacking complete plumbing facilities in 2022: 0.9%Housing units lacking complete kitchen facilities in 2022: 1.8%House/condo owner moved in on average 9 years ago
Renter moved in on average 1 years ago
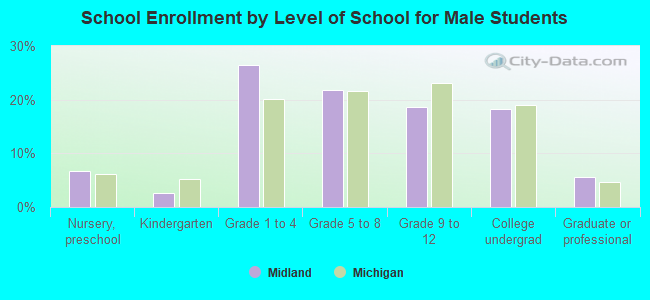
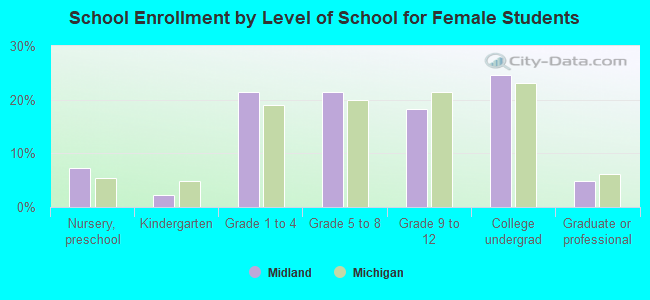
Private vs. public school enrollment:
Students in private schools in grades 1 to 8 (elementary and middle school): 456 Students in private schools in grades 9 to 12 (high school): 77 Students in private undergraduate colleges: 427