Housing density: 1,034 houses/condos per square mile
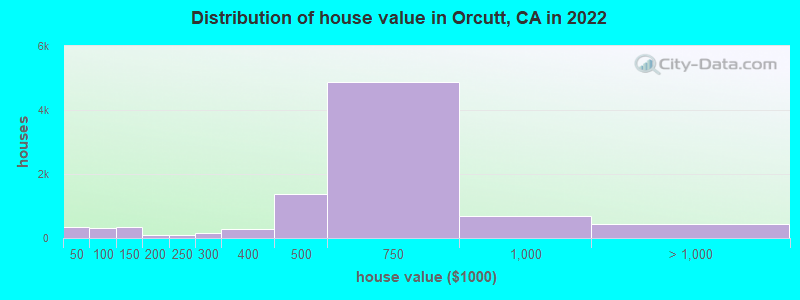
Median price asked for vacant for-sale houses and condos in 2022: $385,515.
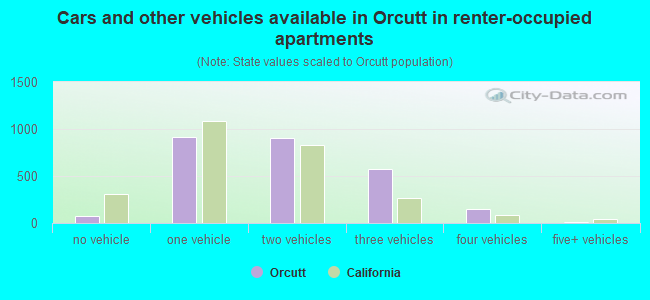
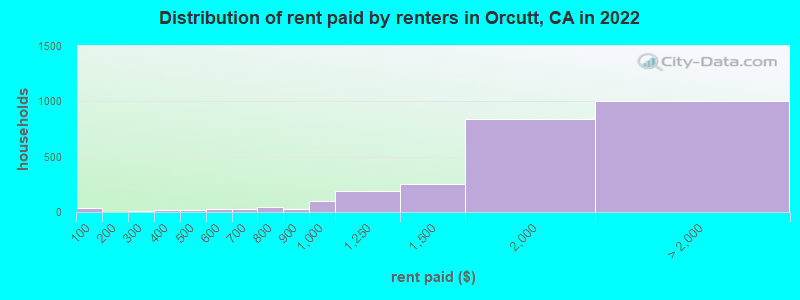
Median contract rent in 2022: $1,814 (lower quartile is $1,393, upper quartile is over $2,000)
Median rent asked for vacant for-rent units in 2022: $1,913
Median gross rent in Orcutt, CA in 2022: over $2,000
Housing units in Orcutt with a mortgage: 5,583 (303 second mortgage, 0 home equity loan, 273 both second mortgage and home equity loan) Houses without a mortgage: 74
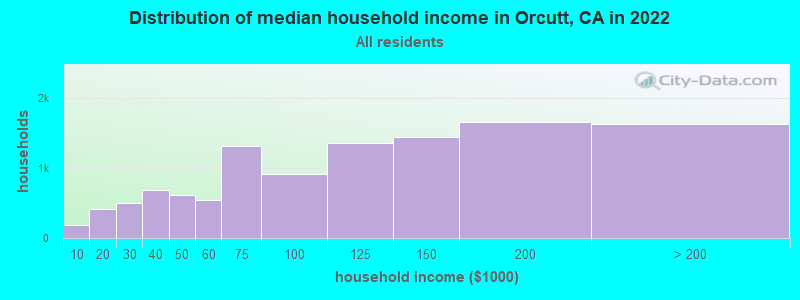
Median household income for houses/condos with a mortgage: $138,683
Median household income for apartments without a mortgage: $59,592
5,195 married couples with children.
1,280 single-parent households (618 men, 662 women).
81.7% of residents of Orcutt speak English at home.
14.1% of residents speak Spanish at home (76% speak English very well, 11% speak English well, 5% speak English not well, 7% don't speak English at all).
1.9% of residents speak other Indo-European language at home (90% speak English very well, 10% speak English well).
2.1% of residents speak Asian or Pacific Island language at home (68% speak English very well, 22% speak English well, 5% speak English not well, 4% don't speak English at all).
Foreign born population: 2,573 (8.3%)
(80.8% of them are naturalized citizens)
Percentage of workers working in this county: 86.8% Number of people working at home: 1,368 (9.5% of all workers)
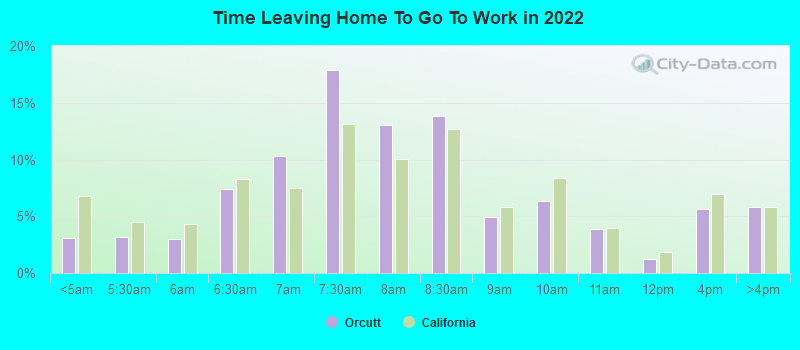
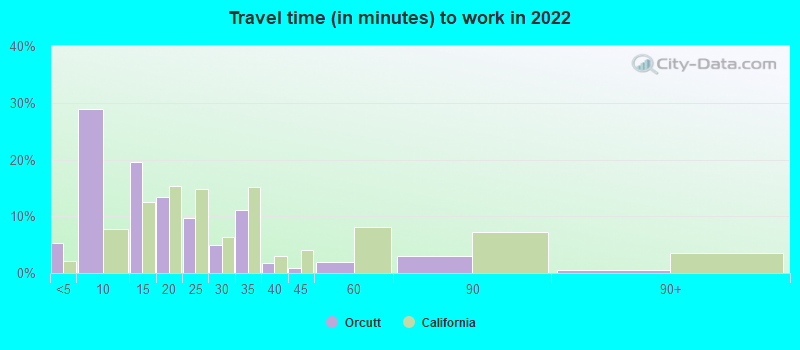
Travel time to work (commute)
Less than 5 minutes: 471
5 to 9 minutes: 2,119
10 to 14 minutes: 2,953
15 to 19 minutes: 2,587
20 to 24 minutes: 1,244
25 to 29 minutes: 591
30 to 34 minutes: 1,231
35 to 39 minutes: 88
40 to 44 minutes: 178
45 to 59 minutes: 575
60 to 89 minutes: 642
90 or more minutes: 221
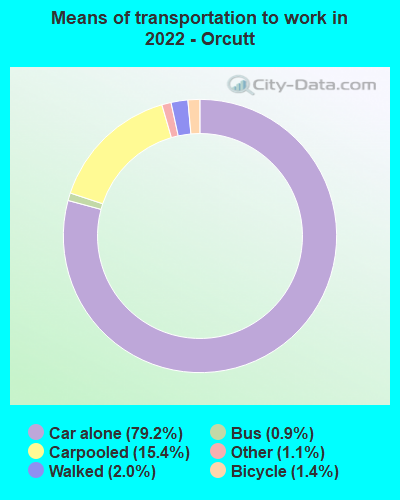
Means of transportation to work:
Drove a car alone: 2,459 (55.7%)
Carpooled: 441 (10.0%)
Bus: 31 (0.7%)
Taxi: 52 (1.2%)
Bicycle: 50 (1.1%)
Walked: 92 (2.1%)
Worked at home: 1,368 (31.0%)
Unemployment by race in 2022
Unemployment rate for White non-Hispanic residents
2.0%Males
2.4%Females
Unemployment rate for Black residents
0.7%Females
Unemployment rate for American Indian and Alaska Native residents
19.0%Males
Unemployment rate for other race residents
8.2%Males
2.9%Females
Unemployment rate for two or more race residents
5.7%Males
8.9%Females
Unemployment rate for Hispanic or Latino residents
6.9%Males
5.9%Females
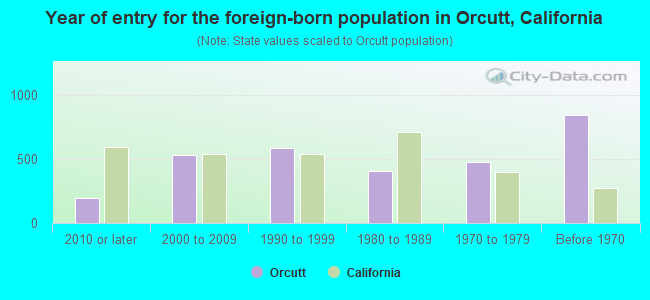
Year of entry for the foreign-born population in Orcutt, California
1982010 or later
5292000 to 2009
5871990 to 1999
4081980 to 1989
4761970 to 1979
841Before 1970
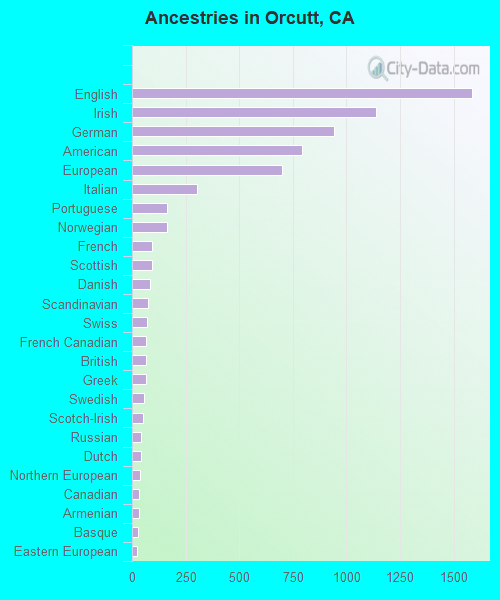
First ancestries reported:
English: 1,586 (10.7%)
Irish: 1,137 (7.7%)
German: 941 (6.3%)
American: 794 (5.4%)
European: 700 (4.7%)
Italian: 302 (2.0%)
Portuguese: 165 (1.1%)
Norwegian: 164 (1.1%)
French: 92 (0.6%)
Scottish: 92 (0.6%)
Danish: 85 (0.6%)
Scandinavian: 73 (0.5%)
Swiss: 68 (0.5%)
French Canadian: 65 (0.4%)
British: 65 (0.4%)
Greek: 63 (0.4%)
Swedish: 57 (0.4%)
Scotch-Irish: 52 (0.4%)
Russian: 44 (0.3%)
Dutch: 43 (0.3%)
Northern European: 37 (0.2%)
Canadian: 33 (0.2%)
Armenian: 31 (0.2%)
Basque: 26 (0.2%)
Eastern European: 23 (0.2%)
Lebanese: 18 (0.1%)
Lithuanian: 16 (0.1%)
Czechoslovakian: 15 (0.1%)
Czech: 15 (0.1%)
Slovak: 13 (0.09%)
Turkish: 10 (0.07%)
Maltese: 8 (0.05%)
Polish: 8 (0.05%)
Egyptian: 7 (0.05%)
Cajun: 7 (0.05%)
Belgian: 7 (0.05%)
Icelander: 6 (0.04%)
Welsh: 5 (0.03%)
African: 1 (0.01%)
Most common places of birth for foreign-born residents (%):
Mexico
Orcutt:
52.4% (1,422)
California:
37.2% (3,881,193)
Philippines
Orcutt:
9.7% (262)
California:
7.8% (818,297)
Germany
Orcutt:
3.6% (99)
California:
0.7% (73,304)
Canada
Orcutt:
3.6% (98)
California:
1.2% (127,477)
France
Orcutt:
2.3% (63)
California:
0.4% (40,224)
Thailand
Orcutt:
1.9% (52)
California:
0.6% (65,335)
Russia
Orcutt:
1.8% (50)
California:
0.7% (71,932)
Taiwan
Orcutt:
1.8% (50)
California:
1.7% (176,274)
Korea
Orcutt:
1.8% (50)
California:
3.0% (315,248)
Other Eastern Europe
Orcutt:
1.8% (48)
California:
0.2% (17,699)
England
Orcutt:
1.6% (44)
California:
0.6% (57,953)
Japan
Orcutt:
1.6% (43)
California:
1.0% (103,575)
Place of birth for U.S.-born residents:
This state: 21,880
Other state: 6,437
Northeast: 938
Midwest: 1,697
South: 1,796
West: 2,125
90.8% of Orcutt residents lived in the same house 1 years ago. Out of people who lived in different houses, 39.4% lived in this county. Out of people who lived in different counties, 80.3% lived in California.
Orcutt:
90.8%
State average:
88.9%
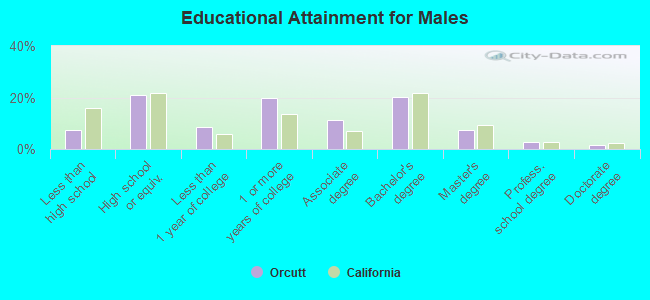
Education attainment for males 25 years and older:
No schooling: 202
Nursery to 4th grade: 4
5th and 6th grade: 40
7th and 8th grade: 50
9th grade: 102
10th grade: 57
11th grade: 80
12th grade, no diploma: 235
High school graduate (or equivalency): 2,200
Less than 1 year of college: 906
Some college more than 1 year, no degree: 2,083
Associate degree: 1,189
Bachelor's degree: 2,095
Master's degree: 784
Professional school degree: 288
Doctorate degree: 148
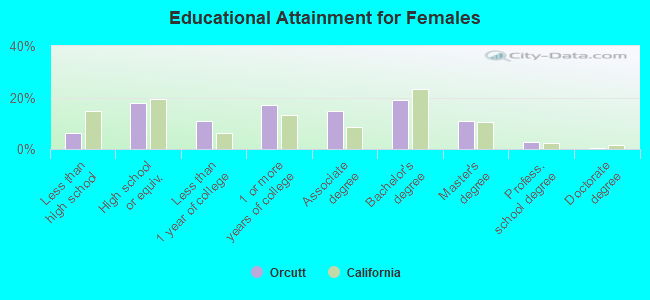
Education attainment for females 25 years and older:
No schooling: 104
Nursery to 4th grade: 21
5th and 6th grade: 33
7th and 8th grade: 6
9th grade: 116
10th grade: 75
11th grade: 121
12th grade, no diploma: 173
High school graduate (or equivalency): 1,912
Less than 1 year of college: 1,178
Some college more than 1 year, no degree: 1,819
Associate degree: 1,579
Bachelor's degree: 2,046
Master's degree: 1,172
Professional school degree: 273
Doctorate degree: 48
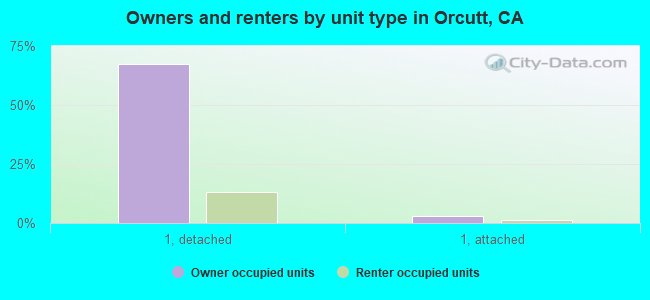
Housing units in structures:
One, detached: 9,039
One, attached: 757
Two: 99
3 or 4: 323
5 to 9: 241
10 to 19: 85
20 to 49: 92
50 or more: 104
Mobile homes: 934
Boats, RVs, vans, etc.: 9
Median worth of mobile homes: $109,858
Housing units lacking complete plumbing facilities in 2022: 0.1%
Housing units lacking complete kitchen facilities in 2022: 0.8%
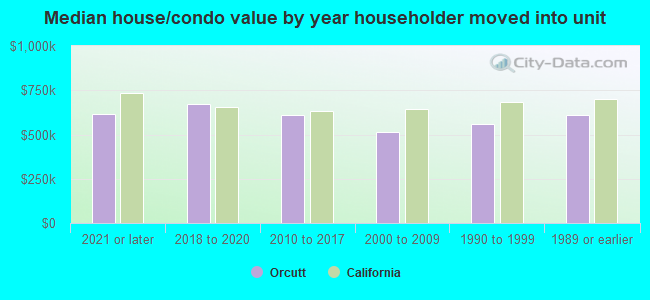
House/condo owner moved in on average 14 years ago