Housing density: 1,866 houses/condos per square mile
Median price asked for vacant for-sale houses and condos in 2022 in this county: $157,543.
Median contract rent in 2022: $1,508 (lower quartile is $1,232, upper quartile is $1,681)
Median rent asked for vacant for-rent units in 2022: $1,541
Median gross rent in South Gate, MD in 2022: $1,604
Housing units in South Gate with a mortgage: 4,389 (532 second mortgage, 526 home equity loan, 31 both second mortgage and home equity loan) Houses without a mortgage: 871
In family households: 446,432 (97,396 male householders, 41,866 female householders)
105,955 spouses, 153,971 children (143,390 natural, 3,378 adopted, 7,203 stepchildren), 11,866 grandchildren, 5,147 brothers or sisters, 5,066 parents, foster children, 7,373 other relatives, 13,819 non-relatives
In nonfamily households: 77,091 (27,830 male householders (20,470 living alone)), 32,286 female householders (26,725 living alone)), 16,975 nonrelatives
In group quarters: 14,133 (7,339 institutionalized population)
87,003 married couples with children.
24,525 single-parent households (5,795 men, 18,730 women).
89.0% of residents of South Gate speak English at home.
3.2% of residents speak Spanish at home (61% speak English very well, 15% speak English well, 23% speak English not well, 2% don't speak English at all).
3.0% of residents speak other Indo-European language at home (69% speak English very well, 21% speak English well, 9% speak English not well).
4.4% of residents speak Asian or Pacific Island language at home (34% speak English very well, 28% speak English well, 30% speak English not well, 7% don't speak English at all).
0.5% of residents speak other language at home (61% speak English very well, 33% speak English well, 5% speak English not well).
Foreign born population: 5,235 (15.0%)
(47.2% of them are naturalized citizens)
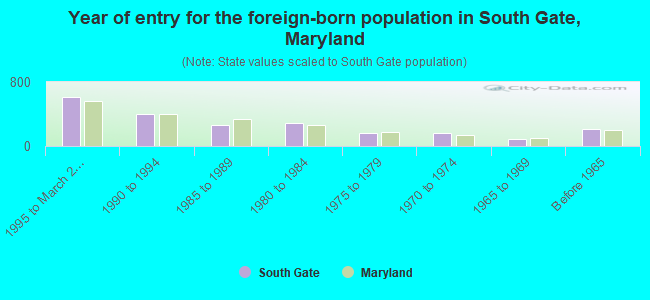
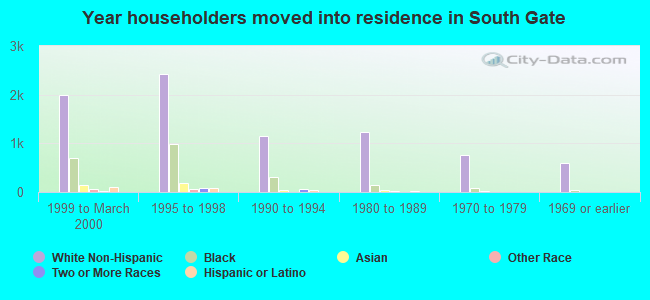
Year of entry for the foreign-born population in South Gate, Maryland
6131995 to March 2000
4001990 to 1994
2621985 to 1989
2841980 to 1984
1651975 to 1979
1601970 to 1974
861965 to 1969
214Before 1965
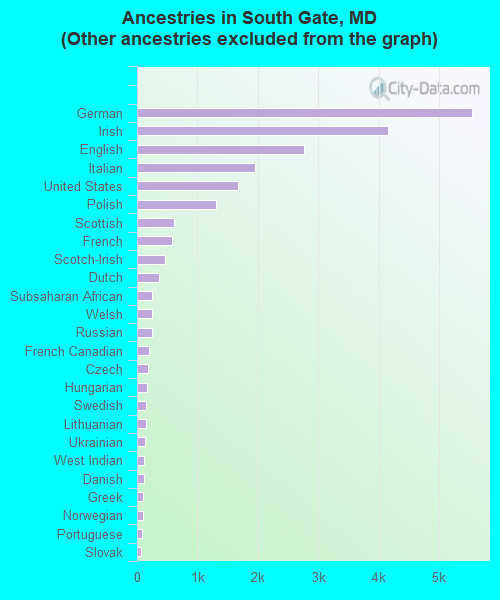
First ancestries reported:
Other: 8,980 (29.2%)
German: 5,552 (18.0%)
Irish: 4,161 (13.5%)
English: 2,766 (9.0%)
Italian: 1,959 (6.4%)
United States: 1,665 (5.4%)
Polish: 1,316 (4.3%)
Scottish: 617 (2.0%)
French: 575 (1.9%)
Scotch-Irish: 457 (1.5%)
Dutch: 361 (1.2%)
Subsaharan African: 255 (0.8%)
Welsh: 252 (0.8%)
Russian: 245 (0.8%)
French Canadian: 194 (0.6%)
Czech: 184 (0.6%)
Hungarian: 171 (0.6%)
Swedish: 142 (0.5%)
Lithuanian: 141 (0.5%)
Ukrainian: 132 (0.4%)
West Indian: 119 (0.4%)
Danish: 111 (0.4%)
Greek: 107 (0.3%)
Norwegian: 102 (0.3%)
Portuguese: 79 (0.3%)
Slovak: 67 (0.2%)
Arab: 44 (0.1%)
Swiss: 39 (0.1%)
Most common places of birth for foreign-born residents (%):
Korea
South Gate:
34.9% (762)
Maryland:
6.0% (31,249)
Philippines
South Gate:
6.6% (145)
Maryland:
4.1% (21,007)
Guatemala
South Gate:
5.4% (119)
Maryland:
2.0% (10,309)
India
South Gate:
5.0% (110)
Maryland:
6.2% (32,276)
United Kingdom
South Gate:
3.5% (77)
Maryland:
2.7% (14,206)
Jamaica
South Gate:
2.6% (56)
Maryland:
3.7% (18,988)
Panama
South Gate:
2.5% (54)
Maryland:
0.5% (2,850)
Egypt
South Gate:
2.4% (52)
Maryland:
0.5% (2,477)
Germany
South Gate:
2.3% (51)
Maryland:
2.8% (14,555)
China, excluding Hong Kong and Taiwan
South Gate:
2.2% (49)
Maryland:
4.4% (22,741)
Thailand
South Gate:
2.0% (44)
Maryland:
0.6% (2,987)
Other Northern Africa
South Gate:
2.0% (43)
Maryland:
0.5% (2,526)
Other Western Africa
South Gate:
1.8% (40)
Maryland:
1.7% (8,678)
Colombia
South Gate:
1.6% (34)
Maryland:
1.1% (5,594)
Iran
South Gate:
1.5% (33)
Maryland:
1.9% (9,733)
Place of birth for U.S.-born residents:
This state: 16,497
Other state: 9,396
Northeast: 3,211
Midwest: 1,456
South: 3,961
West: 768
49% of South Gate residents lived in the same house 5 years ago. Out of people who lived in different houses, 61% lived in this county. Out of people who lived in different counties, 54% lived in Maryland.
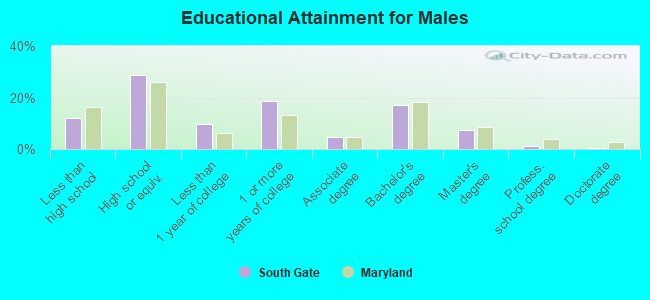
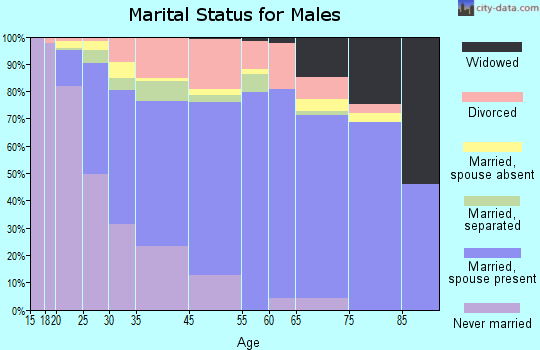
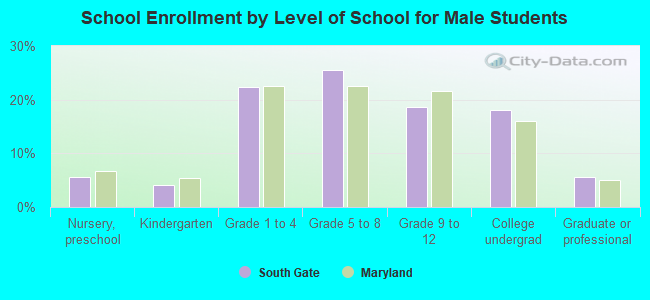
Education attainment for males 25 years and older:
No schooling: 67
Nursery to 4th grade: 48
5th and 6th grade: 40
7th and 8th grade: 163
9th grade: 138
10th grade: 164
11th grade: 198
12th grade, no diploma: 252
High school graduate (or equivalency): 2,567
Less than 1 year of college: 853
Some college more than 1 year, no degree: 1,661
Associate degree: 413
Bachelor's degree: 1,527
Master's degree: 666
Professional school degree: 104
Doctorate degree: 40
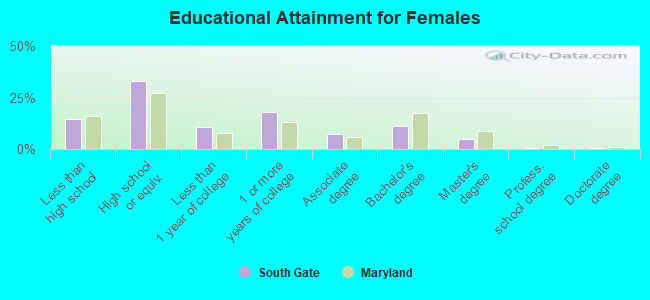
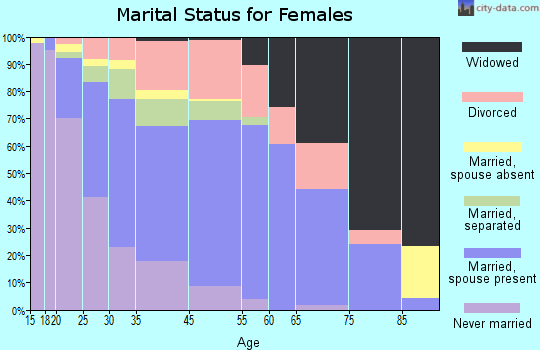
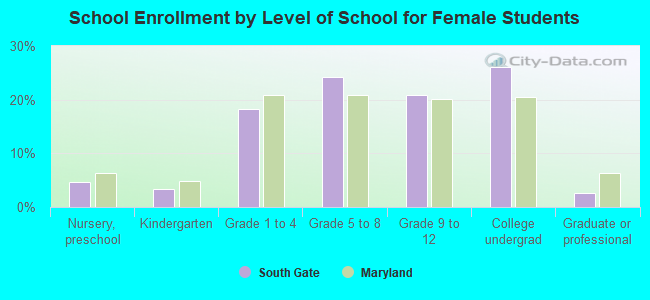
Education attainment for females 25 years and older:
No schooling: 52
Nursery to 4th grade: 22
5th and 6th grade: 109
7th and 8th grade: 205
9th grade: 192
10th grade: 208
11th grade: 153
12th grade, no diploma: 460
High school graduate (or equivalency): 3,120
Less than 1 year of college: 997
Some college more than 1 year, no degree: 1,691
Associate degree: 678
Bachelor's degree: 1,076
Master's degree: 462
Professional school degree: 33
Doctorate degree: 42
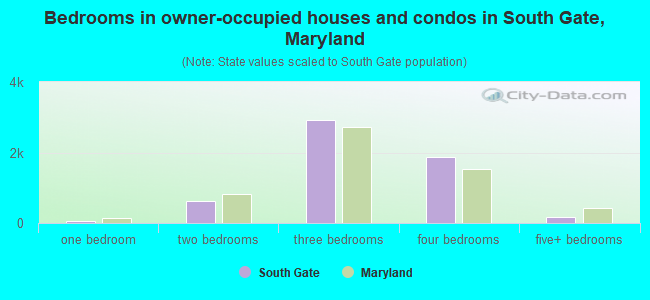
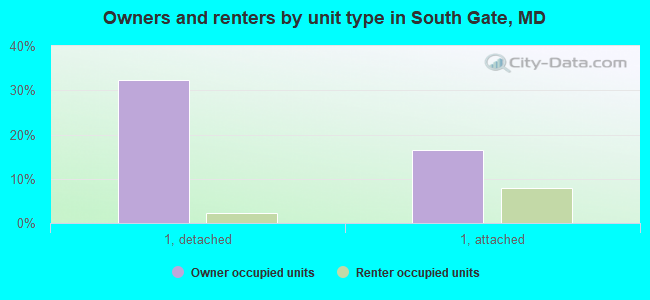
Housing units in structures:
One, detached: 3,973
One, attached: 2,826
Two: 46
3 or 4: 176
5 to 9: 1,026
10 to 19: 3,158
20 to 49: 345
50 or more: 89
Mobile homes: 134
Median worth of mobile homes: $74,862
Housing units lacking complete plumbing facilities: 0.4%