Tualatin, OR (Oregon) Houses and Residents
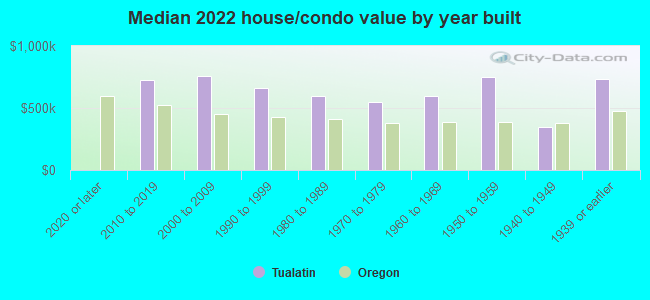
Estimated median house or condo value in 2022: $640,220 (it was $190,900 in 2000 )
Tualatin:
$640,220Oregon:
$475,600
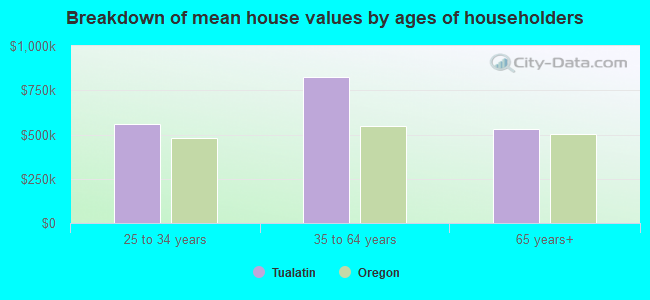
Lower value quartile - upper value quartile: $476,884 - $731,269Mean price in 2022: Detached houses: $662,934 Here:
$662,934State:
$562,872
Townhouses or other attached units: $314,207 Here:
$314,207State:
$463,029
In 2-unit structures: $259,034 Here:
$259,034State:
$505,105
In 3-to-4-unit structures: $165,523 Here:
$165,523State:
$419,673
In 5-or-more-unit structures: $156,692 Here:
$156,692State:
$420,389
Mobile homes: $67,198 Here:
$67,198State:
$214,044
Total population: 26,907 (Urban population: 22,551, Rural population: 36 (all nonfarm) )
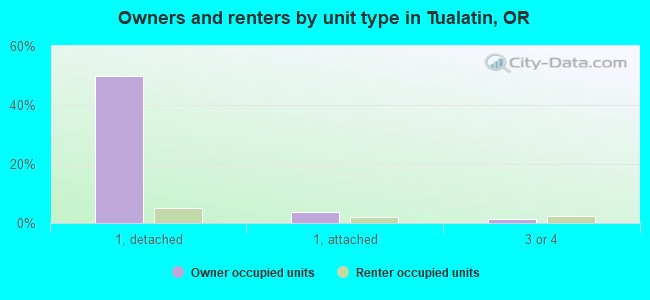
Houses: 11,716 (11,180 occupied: 6,193 owner occupied, 5,056 renter occupied )
% of renters here:
45%State:
37%
Housing density: 1,505 houses/condos per square mile
Median price asked for vacant for-sale houses and condos in 2022: $296,897.
Median contract rent in 2022: $1,499 (lower quartile is $1,233, upper quartile is $1,795)
Median rent asked for vacant for-rent units in 2022: $1,557
Median gross rent in Tualatin, OR in 2022: $1,666
Housing units in Tualatin with a mortgage: 4,429 (506 second mortgage, 24 home equity loan, 437 both second mortgage and home equity loan )Houses without a mortgage: 91
Median household income for houses/condos with a mortgage: $144,902
Median household income for apartments without a mortgage: $117,326
Median monthly housing costs: $1,694
Data:
Median house or condo value ($)
Median house or condo value ($ change since 2000)
Median house or condo value ($) - White
Median house or condo value ($) - Black or African American
Median house or condo value ($) - Asian
Median house or condo value ($) - Hispanic or Latino
Median house or condo value ($) - American Indian and Alaska Native
Median house or condo value ($) - Multirace
Median house or condo value ($) - Other Race
Median price asked for mobile homes ($)
Household density (households per square mile)
Mean house or condo value by units in structure - 1, detached ($)
Mean house or condo value by units in structure - 1, attached ($)
Mean house or condo value by units in structure - 2 ($)
Mean house or condo value by units in structure by units in structure - 3 or 4 ($)
Mean house or condo value by units in structure - 5 or more ($)
Mean house or condo value by units in structure - Boat, RV, van, etc. ($)
Mean house or condo value by units in structure - Mobile home ($)
Median contract rent ($)
Median contract rent - Lower quartile ($)
Median contract rent - Upper quartile ($)
Median gross rent ($)
Urban houses (%)
Rural houses (%)
Houses occupied (%)
Houses occupied (% change since 2000)
Houses owner occupied (%)
Houses owner occupied (% change since 2000)
Houses renter occupied (%)
Houses renter occupied (% change since 2000)
Vacant housing units - For rent (%)
Vacant housing units - For rent (% change since 2000)
Vacant housing units - For sale only (%)
Vacant housing units - For sale only (% change since 2000)
Vacant housing units - Rented or sold, not occupied (%)
Vacant housing units - Rented or sold, not occupied (% change since 2000)
Vacant housing units - For seasonal, recreational, or occasional use (%)
Vacant housing units - For seasonal, recreational, or occasional use (% change since 2000)
Vacant housing units - For migrant workers (%)
Vacant housing units - For migrant workers (% change since 2000)
Vacant housing units - Other vacant (%)
Vacant housing units - Other vacant (% change since 2000)
Median monthly housing costs ($)
Median household income for houses/condos with a mortgage ($)
Median household income for houses/condos without a mortgage ($)
Median household income ($)
Median household income ($) - White
Median household income ($) - Black or African American
Median household income ($) - Asian
Median household income ($) - Hispanic or Latino
Median household income ($) - American Indian and Alaska Native
Median household income ($) - Multirace
Median household income ($) - Other Race
Mortgage status - with mortgage (%)
Mortgage status - with second mortgage (%)
Mortgage status - with home equity loan (%)
Mortgage status - with both second mortgage and home equity loan (%)
Mortgage status - without a mortgage (%)
Median year house/condo built
Median year apartment built
Household type by relationship - Male householder living alone (%)
Household type by relationship - Male householder not living alone (%)
Household type by relationship - Female householder living alone (%)
Household type by relationship - Female householder not living alone (%)
Household type by relationship - Opposite-Sex spouse (%)
Household type by relationship - Same-Sex spouse (%)
Household type by relationship - Opposite-Sex unmarried partner (%)
Household type by relationship - Same-Sex unmarried partner (%)
Household type by relationship - In group quarters (%)
Size of family households - 2-person household (%)
Size of family households - 3-person household (%)
Size of family households - 4-person household (%)
Size of family households - 5-person household (%)
Size of family households - 6-person household (%)
Size of family households - 7-or-more-person household (%)
Size of nonfamily households - 1-person household (%)
Size of nonfamily households - 2-person household (%)
Size of nonfamily households - 3-person household (%)
Size of nonfamily households - 4-person household (%)
Size of nonfamily households - 5-person household (%)
Size of nonfamily households - 6-person household (%)
Size of nonfamily households - 7-or-moreperson household (%)
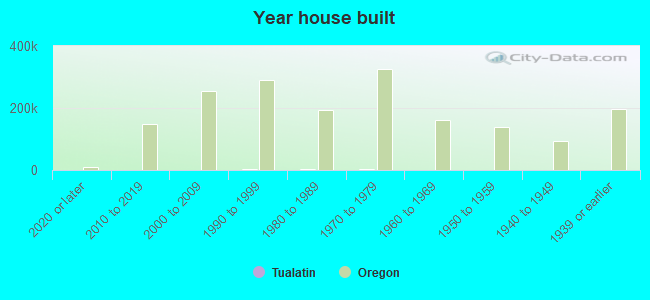
Year house built - Built 2010 or later (%)
Year house built - Built 2000 to 2009 (%)
Year house built - Built 1990 to 1999 (%)
Year house built - Built 1980 to 1989 (%)
Year house built - Built 1970 to 1979 (%)
Year house built - Built 1960 to 1969 (%)
Year house built - Built 1950 to 1959 (%)
Year house built - Built 1940 to 1949 (%)
Year house built - Built 1939 or earlier (%)
Median number of rooms in houses and condos
Median number of rooms in apartments
Median number of bedrooms in owner occupied houses
Mean number of bedrooms in owner occupied houses
Median number of bedrooms in renter occupied houses
Mean number of bedrooms in renter occupied houses
Median number of vehichles in owner occupied houses
Mean number of vehichles in owner occupied houses
Median number of vehichles in renter occupied houses
Mean number of vehichles in renter occupied houses
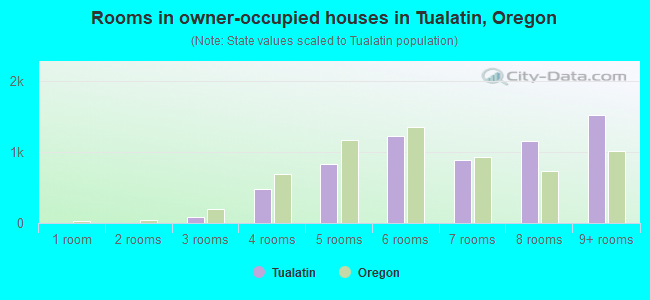
Rooms in owner-occupied houses - 1 room (%)
Rooms in owner-occupied houses - 2 rooms (%)
Rooms in owner-occupied houses - 3 rooms (%)
Rooms in owner-occupied houses - 4 rooms (%)
Rooms in owner-occupied houses - 5 rooms (%)
Rooms in owner-occupied houses - 6 rooms (%)
Rooms in owner-occupied houses - 7 rooms (%)
Rooms in owner-occupied houses - 8 rooms (%)
Rooms in owner-occupied houses - 9+ rooms (%)
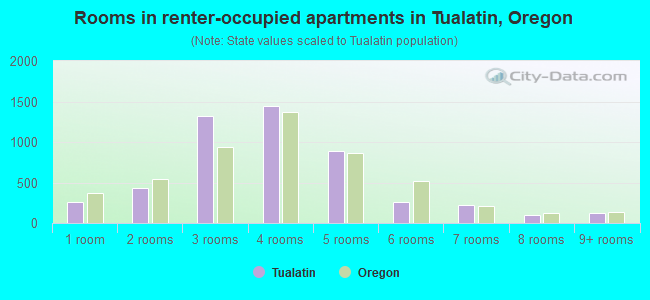
Rooms in renter-occupied houses - 1 room (%)
Rooms in renter-occupied houses - 2 rooms (%)
Rooms in renter-occupied houses - 3 rooms (%)
Rooms in renter-occupied houses - 4 rooms (%)
Rooms in renter-occupied houses - 5 rooms (%)
Rooms in renter-occupied houses - 6 rooms (%)
Rooms in renter-occupied houses - 7 rooms (%)
Rooms in renter-occupied houses - 8 rooms (%)
Rooms in renter-occupied houses - 9+ rooms (%)
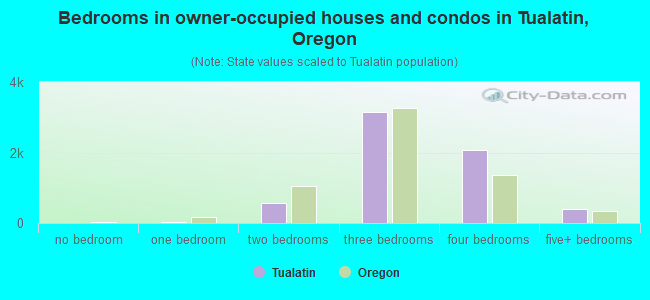
Bedrooms in owner-occupied houses - no bedrooms (%)
Bedrooms in owner-occupied houses - 1 bedroom (%)
Bedrooms in owner-occupied houses - 2 bedrooms (%)
Bedrooms in owner-occupied houses - 3 bedrooms (%)
Bedrooms in owner-occupied houses - 4 bedrooms (%)
Bedrooms in owner-occupied houses - 5+ bedrooms (%)
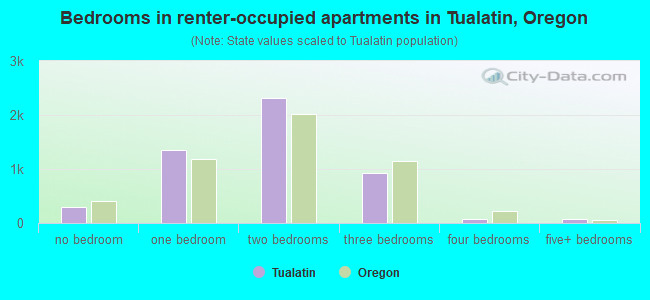
Bedrooms in renter-occupied houses - no bedrooms (%)
Bedrooms in renter-occupied houses - 1 bedroom (%)
Bedrooms in renter-occupied houses - 2 bedrooms (%)
Bedrooms in renter-occupied houses - 3 bedrooms (%)
Bedrooms in renter-occupied houses - 4 bedrooms (%)
Bedrooms in renter-occupied houses - 5+ bedrooms (%)
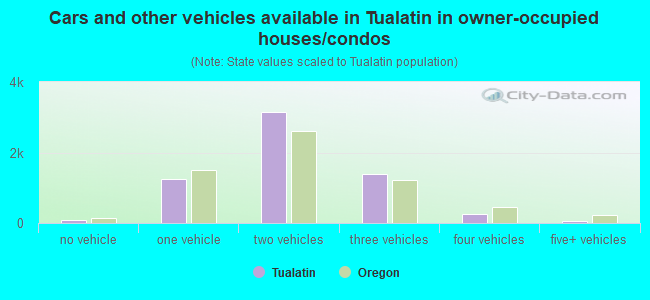
Vehicles available in owner-occupied houses - no vehicle available (%)
Vehicles available in owner-occupied houses - 1 vehicle available(%)
Vehicles available in owner-occupied houses - 2 Vehicles available (%)
Vehicles available in owner-occupied houses - 3 Vehicles available (%)
Vehicles available in owner-occupied houses - 4 Vehicles available (%)
Vehicles available in owner-occupied houses - 5+ Vehicles available (%)
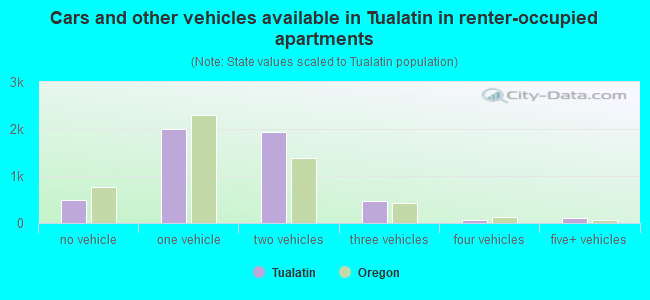
Vehicles available in renter-occupied houses - no vehicle available (%)
Vehicles available in renter-occupied houses - 1 vehicle available (%)
Vehicles available in renter-occupied houses - 2 Vehicles available (%)
Vehicles available in renter-occupied houses - 3 Vehicles available (%)
Vehicles available in renter-occupied houses - 4 Vehicles available (%)
Vehicles available in renter-occupied houses - 5+ Vehicles available (%)
Housing units in structures - 1, detached (%)
Housing units in structures - 1, attached (%)
Housing units in structures - 2 (%)
Housing units in structures - 3 or 4 (%)
Housing units in structures - 5 to 9 (%)
Housing units in structures - 10 to 19 (%)
Housing units in structures - 20 to 49 (%)
Housing units in structures - 50 or more (%)
Housing units in structures - Mobile home (%)
Housing units in structures - Boat, RV, van, etc. (%)
Housing units in structures - Owners - 1, detached (%)
Housing units in structures - Owners - 1, attached (%)
Housing units in structures - Owners - 2 (%)
Housing units in structures - Owners - 3 or 4 (%)
Housing units in structures - Owners - 5 to 9 (%)
Housing units in structures - Owners - 10 to 19 (%)
Housing units in structures - Owners - 20 to 49 (%)
Housing units in structures - Owners - 50 or more (%)
Housing units in structures - Owners - Mobile home (%)
Housing units in structures - Owners - Boat, RV, van, etc. (%)
Housing units in structures - Renters - 1, detached (%)
Housing units in structures - Renters - 1, attached (%)
Housing units in structures - Renters - 2 (%)
Housing units in structures - Renters - 3 or 4 (%)
Housing units in structures - Renters - 5 to 9 (%)
Housing units in structures - Renters - 10 to 19 (%)
Housing units in structures - Renters - 20 to 49 (%)
Housing units in structures - Renters - 50 or more (%)
Housing units in structures - Renters - Mobile home (%)
Housing units in structures - Renters - Boat, RV, van, etc. (%)
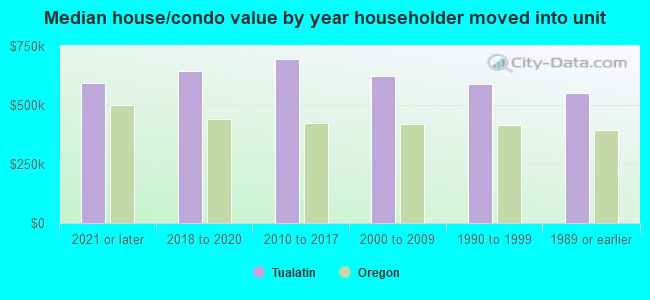
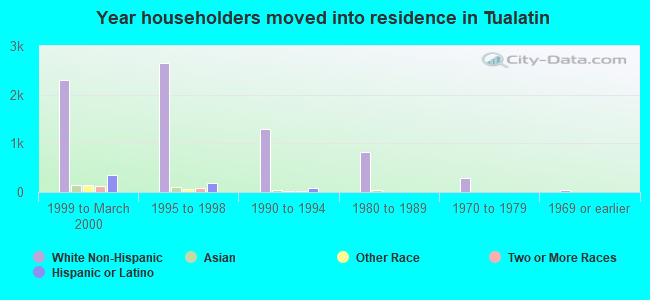
House/condo owner moved in on average (years ago)
Renter moved in on average (years ago)
Year householder moved into unit - Moved in 1999 to March 2000 (%)
Year householder moved into unit - Moved in 1999 to March 2000 (%) - White
Year householder moved into unit - Moved in 1999 to March 2000 (%) - Black or African American
Year householder moved into unit - Moved in 1999 to March 2000 (%) - Asian
Year householder moved into unit - Moved in 1999 to March 2000 (%) - Hispanic or Latino
Year householder moved into unit - Moved in 1999 to March 2000 (%) - American Indian and Alaska Native
Year householder moved into unit - Moved in 1999 to March 2000 (%) - Multirace
Year householder moved into unit - Moved in 1999 to March 2000 (%) - Other Race
Year householder moved into unit - Moved in 1995 to 1998 (%)
Year householder moved into unit - Moved in 1995 to 1998 (%) - White
Year householder moved into unit - Moved in 1995 to 1998 (%) - Black or African American
Year householder moved into unit - Moved in 1995 to 1998 (%) - Asian
Year householder moved into unit - Moved in 1995 to 1998 (%) - Hispanic or Latino
Year householder moved into unit - Moved in 1995 to 1998 (%) - American Indian and Alaska Native
Year householder moved into unit - Moved in 1995 to 1998 (%) - Multirace
Year householder moved into unit - Moved in 1995 to 1998 (%) - Other Race
Year householder moved into unit - Moved in 1990 to 1994 (%)
Year householder moved into unit - Moved in 1990 to 1994 (%) - White
Year householder moved into unit - Moved in 1990 to 1994 (%) - Black or African American
Year householder moved into unit - Moved in 1990 to 1994 (%) - Asian
Year householder moved into unit - Moved in 1990 to 1994 (%) - Hispanic or Latino
Year householder moved into unit - Moved in 1990 to 1994 (%) - American Indian and Alaska Native
Year householder moved into unit - Moved in 1990 to 1994 (%) - Multirace
Year householder moved into unit - Moved in 1990 to 1994 (%) - Other Race
Year householder moved into unit - Moved in 1980 to 1989 (%)
Year householder moved into unit - Moved in 1980 to 1989 (%) - White
Year householder moved into unit - Moved in 1980 to 1989 (%) - Black or African American
Year householder moved into unit - Moved in 1980 to 1989 (%) - Asian
Year householder moved into unit - Moved in 1980 to 1989 (%) - Hispanic or Latino
Year householder moved into unit - Moved in 1980 to 1989 (%) - American Indian and Alaska Native
Year householder moved into unit - Moved in 1980 to 1989 (%) - Multirace
Year householder moved into unit - Moved in 1980 to 1989 (%) - Other Race
Year householder moved into unit - Moved in 1970 to 1979 (%)
Year householder moved into unit - Moved in 1970 to 1979 (%) - White
Year householder moved into unit - Moved in 1970 to 1979 (%) - Black or African American
Year householder moved into unit - Moved in 1970 to 1979 (%) - Asian
Year householder moved into unit - Moved in 1970 to 1979 (%) - Hispanic or Latino
Year householder moved into unit - Moved in 1970 to 1979 (%) - American Indian and Alaska Native
Year householder moved into unit - Moved in 1970 to 1979 (%) - Multirace
Year householder moved into unit - Moved in 1970 to 1979 (%) - Other Race
Year householder moved into unit - Moved in 1969 or earlier (%)
Year householder moved into unit - Moved in 1969 or earlier (%) - White
Year householder moved into unit - Moved in 1969 or earlier (%) - Black or African American
Year householder moved into unit - Moved in 1969 or earlier (%) - Asian
Year householder moved into unit - Moved in 1969 or earlier (%) - Hispanic or Latino
Year householder moved into unit - Moved in 1969 or earlier (%) - American Indian and Alaska Native
Year householder moved into unit - Moved in 1969 or earlier (%) - Multirace
Year householder moved into unit - Moved in 1969 or earlier (%) - Other Race
Housing units lacking complete plumbing facilities (%)
Housing units lacking complete kitchen facilities (%)
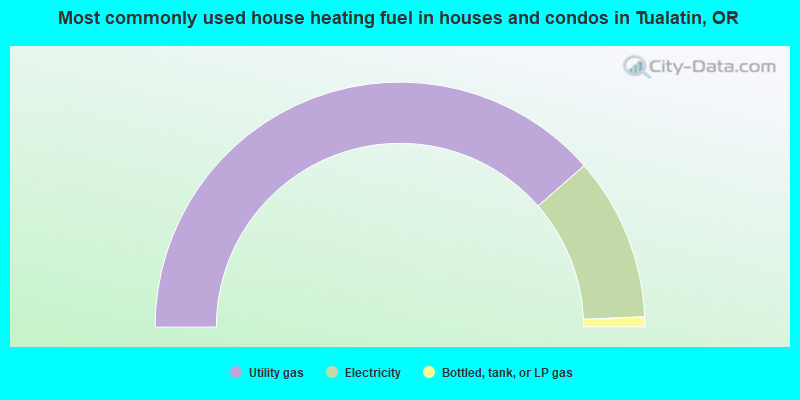
House heating fuel used in houses and condos - Utility gas (%)
House heating fuel used in houses and condos - Bottled, tank, or LP gas (%)
House heating fuel used in houses and condos - Electricity (%)
House heating fuel used in houses and condos - Fuel oil, kerosene, etc. (%)
House heating fuel used in houses and condos - Coal or coke (%)
House heating fuel used in houses and condos - Wood (%)
House heating fuel used in houses and condos - Solar energy (%)
House heating fuel used in houses and condos - Other fuel (%)
House heating fuel used in houses and condos - No fuel used (%)
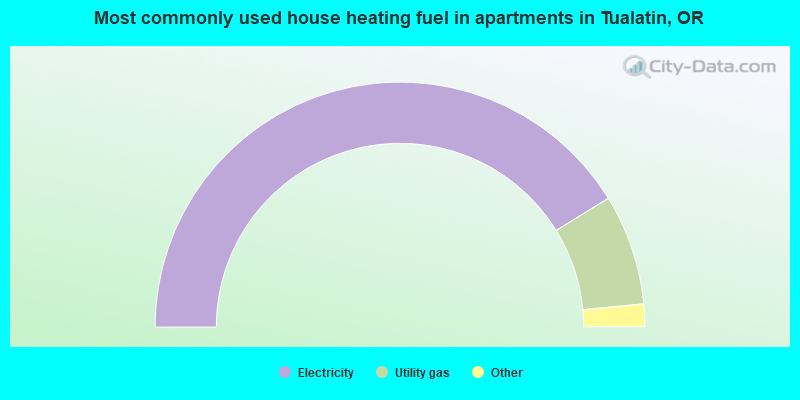
House heating fuel used in apartments - Utility gas (%)
House heating fuel used in apartments - Bottled, tank, or LP gas (%)
House heating fuel used in apartments - Electricity (%)
House heating fuel used in apartments - Fuel oil, kerosene, etc. (%)
House heating fuel used in apartments - Coal or coke (%)
House heating fuel used in apartments - Wood (%)
House heating fuel used in apartments - Solar energy (%)
House heating fuel used in apartments - Other fuel (%)
House heating fuel used in apartments - No fuel used (%)
Latest news about housing in Tualatin, OR collected exclusively by city-data.com from local newspapers, TV, and radio stations
Median year house/condo built: 1991Median year apartment built: 1992Household type by relationship:
Households: 27,833
Male householders: 5,290 (1,423 living alone ), Female householders: 5,629 (1,398 living alone )5,812 spouses (5,739 opposite-sex spouses ), 921 unmarried partners , (879 opposite-sex unmarried partners ), 7,798 children (7,365 natural , 115 adopted , 317 stepchildren ), 300 grandchildren , 126 brothers or sisters , 241 parents , 7 foster children , 226 other relatives , 1,261 non-relatives In group quarters: 218
Size of family households: 3,000 2-persons , 1,903 3-persons , 1,211 4-persons , 710 5-persons , 147 6-persons , 30 7-or-more-persons .
Size of nonfamily households: 3,051 1-person , 1,011 2-persons , 157 3-persons , 16 4-persons , 43 5-persons , 17 7-or-more-persons .
4,517 married couples with children. single-parent households (272 men , 1,088 women ).
75.7% of residents of Tualatin speak English at home. of residents speak Spanish at home (82% speak English very well , 8% speak English well , 8% speak English not well , 1% don't speak English at all ).of residents speak other Indo-European language at home (82% speak English very well , 15% speak English well , 3% speak English not well ).of residents speak Asian or Pacific Island language at home (59% speak English very well , 28% speak English well , 11% speak English not well , 1% don't speak English at all ).of residents speak other language at home (54% speak English very well , 35% speak English well , 12% speak English not well ).
Foreign born population: 3,319 (11.9%)of them are naturalized citizens )
Median number of rooms in houses and condos:
Median number of rooms in apartments
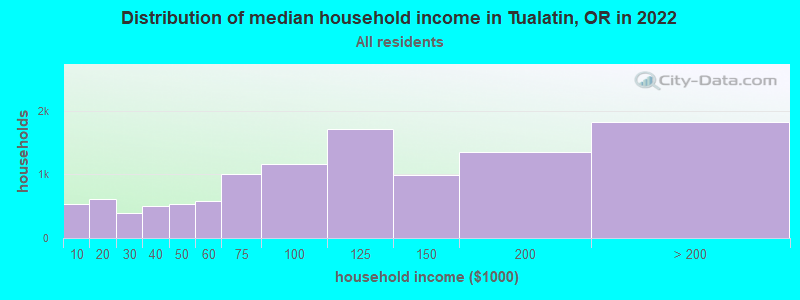
Tualatin, OR household income distribution 531 Less than $10,000618 $10,000 to $19,999398 $20,000 to $29,999503 $30,000 to $39,999530 $40,000 to $49,999587 $50,000 to $59,9991,009 $60,000 to $74,9991,158 $75,000 to $99,9991,710 $100,000 to $124,999996 $125,000 to $149,9991,353 $150,000 to $199,9991,823 $200,000 or more
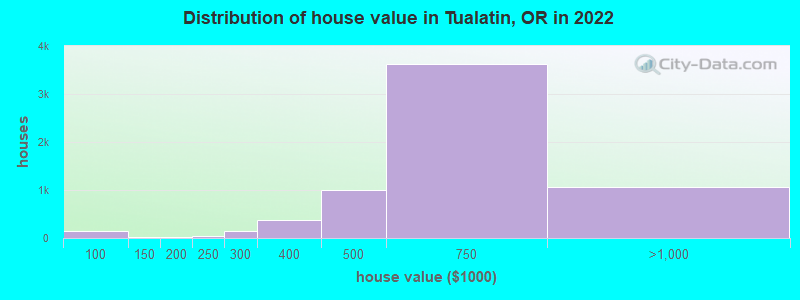
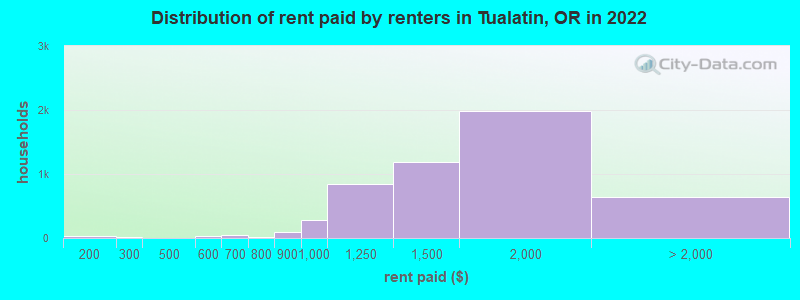
Home value of owner - occupied houses in 2022 in Tualatin, OR 9 Less than $10,00019 $40,000 to $49,99924 $50,000 to $59,99970 $60,000 to $69,9994 $80,000 to $89,99926 $90,000 to $99,99910 $100,000 to $124,99928 $175,000 to $199,99947 $200,000 to $249,999150 $250,000 to $299,999377 $300,000 to $399,999992 $400,000 to $499,9993,614 $500,000 to $749,9991,029 $750,000 to $999,99924 $1,000,000 to $1,499,9998 $1,500,000 to $1,999,999Rent paid by renters in 2022 in Tualatin, OR 5 Less than $10028 $150 to $1999 $250 to $29914 $500 to $5499 $550 to $5998 $600 to $64942 $650 to $69922 $700 to $74985 $800 to $899278 $900 to $999842 $1,000 to $1,2491,180 $1,250 to $1,4991,980 $1,500 to $1,999300 $2,000 to $2,499102 $2,500 to $2,99917 $3,000 to $3,49928 $3,500 or more185 No cash rent
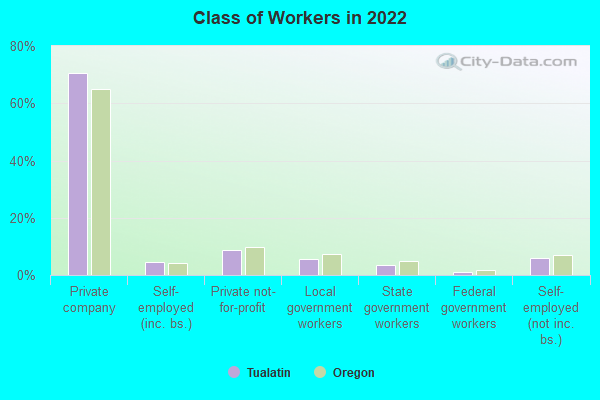
Percentage of workers working in this county: 72.0%Number of people working at home: 3,264 (21.8% of all workers )
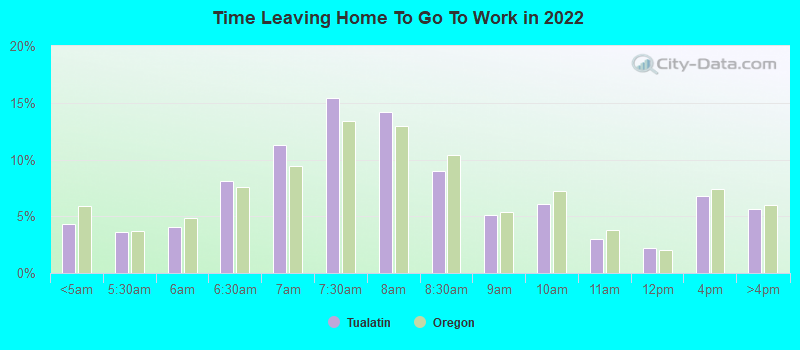
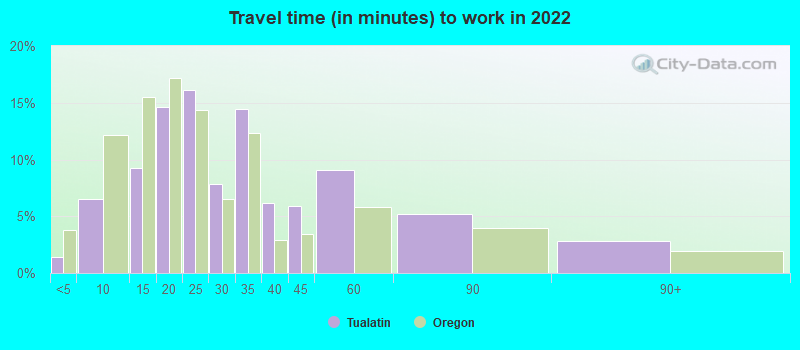
Travel time to work (commute)
Less than 5 minutes: 2275 to 9 minutes: 1,68810 to 14 minutes: 1,90415 to 19 minutes: 1,55720 to 24 minutes: 1,71625 to 29 minutes: 86330 to 34 minutes: 1,61635 to 39 minutes: 50740 to 44 minutes: 49545 to 59 minutes: 64160 to 89 minutes: 18790 or more minutes: 99
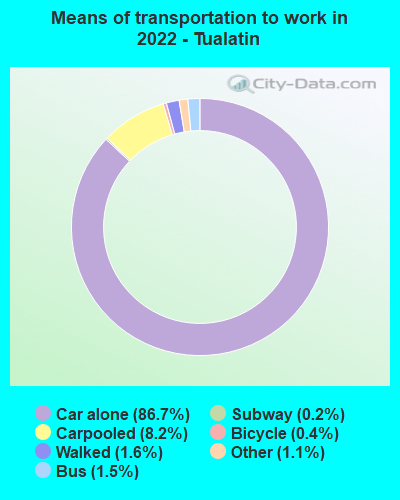
Means of transportation to work:
Drove a car alone: 23,042 (75.0%)Carpooled: 1,920 (6.2%)Bus : 343 (1.1%)Subway or elevated rail : 11 (0.0%)Long-distance train or commuter rail : 23 (0.1%)Ferryboat: 27 (0.1%)Taxi: 374 (1.2%)Bicycle: 60 (0.2%)Walked: 508 (1.7%)Worked at home: 3,264 (10.6%)
Unemployment by race in 2022
Unemployment rate for White non-Hispanic residents 2.6% Males1.1% FemalesUnemployment rate for American Indian and Alaska Native residents 5.5% MalesUnemployment rate for other race residents 1.0% Males0.8% FemalesUnemployment rate for two or more race residents 10.0% Males7.4% FemalesUnemployment rate for Hispanic or Latino residents 6.5% Males5.3% Females
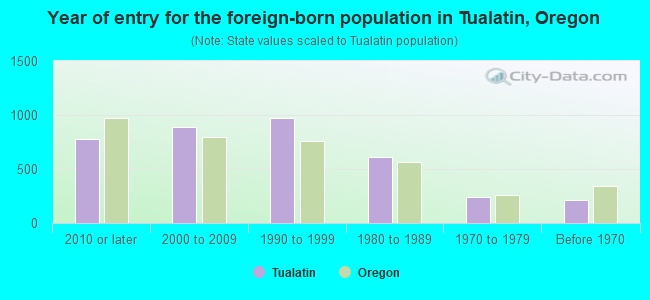
Year of entry for the foreign-born population in Tualatin, Oregon
776 2010 or later 888 2000 to 2009 970 1990 to 1999 607 1980 to 1989 245 1970 to 1979 212 Before 1970
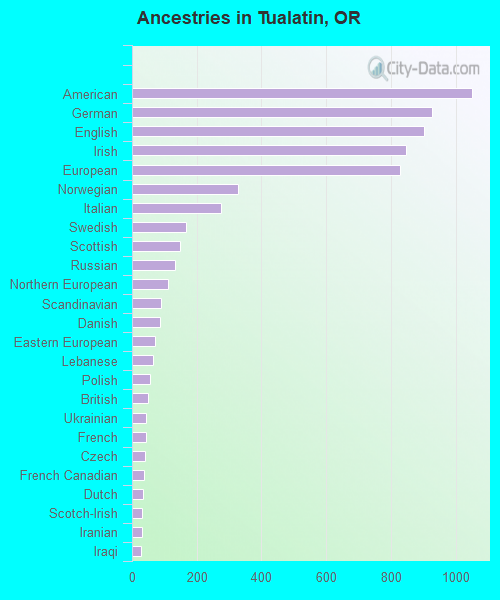
First ancestries reported:
American: 1,051 (8.4%)
German: 928 (7.4%)
English: 903 (7.2%)
Irish: 846 (6.8%)
European: 829 (6.6%)
Norwegian: 327 (2.6%)
Italian: 276 (2.2%)
Swedish: 167 (1.3%)
Scottish: 147 (1.2%)
Russian: 132 (1.1%)
Northern European: 110 (0.9%)
Scandinavian: 89 (0.7%)
Danish: 87 (0.7%)
Eastern European: 72 (0.6%)
Lebanese: 65 (0.5%)
Polish: 57 (0.5%)
British: 50 (0.4%)
Ukrainian: 44 (0.4%)
French: 43 (0.3%)
Czech: 40 (0.3%)
French Canadian: 37 (0.3%)
Dutch: 34 (0.3%)
Scotch-Irish: 31 (0.2%)
Iranian: 30 (0.2%)
Iraqi: 28 (0.2%)
Portuguese: 27 (0.2%)
Estonian: 24 (0.2%)
Hungarian: 24 (0.2%)
Celtic: 19 (0.2%)
Swiss: 17 (0.1%)
Finnish: 16 (0.1%)
Canadian: 15 (0.1%)
Jamaican: 14 (0.1%)
African: 13 (0.1%)
Welsh: 12 (0.10%)
Icelander: 11 (0.09%)
Palestinian: 10 (0.08%)
Serbian: 10 (0.08%)
Pennsylvania German: 9 (0.07%)
Moroccan: 9 (0.07%)
Basque: 8 (0.06%)
Slavic: 7 (0.06%)
Australian: 6 (0.05%)
Romanian: 5 (0.04%)
Greek: 5 (0.04%)
Israeli: 5 (0.04%)
Lithuanian: 5 (0.04%)
Brazilian: 4 (0.03%)
Ethiopian: 3 (0.02%)
Most common places of birth for foreign-born residents (%): Mexico Tualatin:
46.9% (1,566)Oregon:
33.9% (140,109)
Philippines Tualatin:
6.8% (228)Oregon:
3.5% (14,530)
Guatemala Tualatin:
5.9% (197)Oregon:
1.7% (7,103)
Venezuela Tualatin:
5.8% (192)Oregon:
0.4% (1,568)
China, excluding Hong Kong and Taiwan Tualatin:
5.0% (166)Oregon:
5.2% (21,429)
Vietnam Tualatin:
4.6% (153)Oregon:
5.5% (22,563)
Ecuador Tualatin:
3.3% (109)Oregon:
0.2% (794)
Iraq Tualatin:
2.8% (93)Oregon:
0.7% (3,094)
Canada Tualatin:
2.5% (83)Oregon:
3.7% (15,229)
Germany Tualatin:
2.4% (81)Oregon:
1.9% (8,005)
India Tualatin:
2.2% (75)Oregon:
4.7% (19,604)
Fiji Tualatin:
1.7% (57)Oregon:
0.4% (1,762)
Place of birth for U.S.-born residents:
This state: 11,423Other state: 12,415Northeast: 1,176Midwest: 2,075South: 1,527West: 7,590 85.3% of Tualatin residents lived in the same house 1 years ago.
Out of people who lived in different houses, 24.4% lived in this county.
Out of people who lived in different counties, 74.6% lived in Oregon.
Tualatin:
85.3%State average:
85.5%
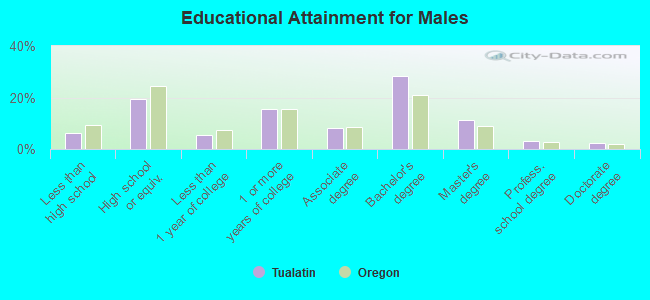
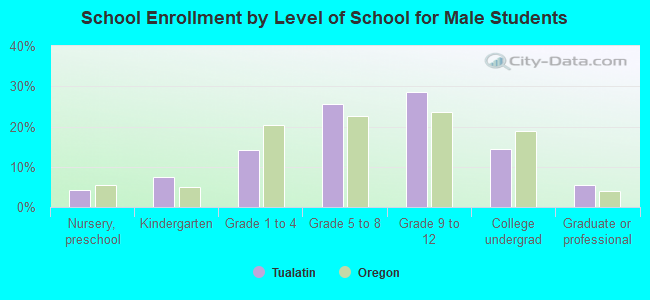
Education attainment for males 25 years and older:
No schooling: 296Nursery to 4th grade: 345th and 6th grade: 167th and 8th grade: 639th grade: 1810th grade: 2111th grade: 512th grade, no diploma: 152High school graduate (or equivalency): 1,879Less than 1 year of college: 535Some college more than 1 year, no degree: 1,510Associate degree: 799Bachelor's degree: 2,725Master's degree: 1,075Professional school degree: 287Doctorate degree: 215
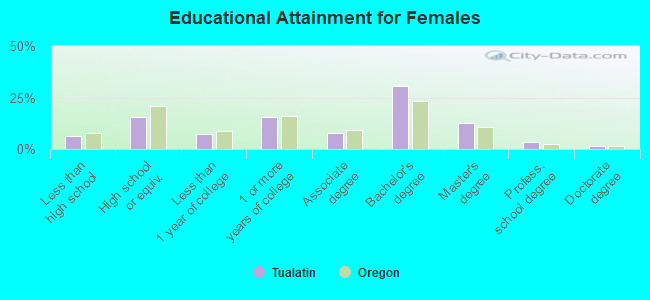
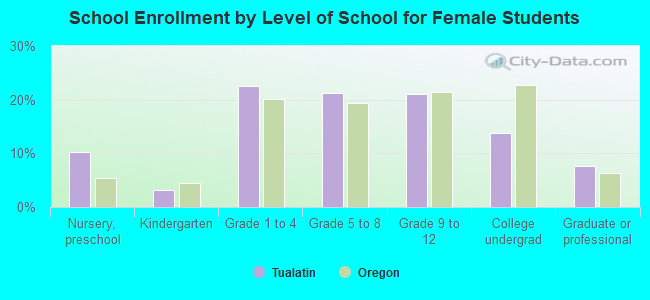
Education attainment for females 25 years and older:
No schooling: 95Nursery to 4th grade: 05th and 6th grade: 2147th and 8th grade: 509th grade: 2210th grade: 1711th grade: 4912th grade, no diploma: 167High school graduate (or equivalency): 1,517Less than 1 year of college: 697Some college more than 1 year, no degree: 1,517Associate degree: 762Bachelor's degree: 3,029Master's degree: 1,237Professional school degree: 317Doctorate degree: 143
Housing units in structures:
One, detached: 5,881One, attached: 926Two: 2503 or 4: 1,0115 to 9: 1,03810 to 19: 95920 to 49: 26050 or more: 1,187Mobile homes: 131Boats, RVs, vans, etc.: 69Median worth of mobile homes: $78,656
Housing units lacking complete plumbing facilities in 2022: 1.2%Housing units lacking complete kitchen facilities in 2022: 1.9%House/condo owner moved in on average 12 years ago
Renter moved in on average 4 years ago
Private vs. public school enrollment:
Students in private schools in grades 1 to 8 (elementary and middle school): 290 Students in private schools in grades 9 to 12 (high school): 69 Students in private undergraduate colleges: 147