West Burlington, IA (Iowa) Houses and Residents
| West Burlington: | $146,379 |
| Iowa: | $194,600 |
Total population: 3,051 (Urban population: 2,916 (all inside urban clusters), Rural population: 217 (all nonfarm))
Houses: 1,346 (1,286 occupied: 676 owner occupied, 630 renter occupied)
| % of renters here: | 48% |
| State: | 28% |
Housing density: 268 houses/condos per square mile
Median price asked for vacant for-sale houses and condos in 2022 in this county: $141,789.
Median contract rent in 2022: $653 (lower quartile is $529, upper quartile is $910)
Median rent asked for vacant for-rent units in 2022: $640
Median gross rent in West Burlington, IA in 2022: $813
Housing units in West Burlington with a mortgage: 423 (24 second mortgage, 0 home equity loan, 25 both second mortgage and home equity loan)
Houses without a mortgage: 0
Median household income for houses/condos with a mortgage: $72,920
Median household income for apartments without a mortgage: $55,826
Median monthly housing costs: $891
Compare current foreclosures near West Burlington, IA:
| Photo | Address | Area | Beds / Baths | Price | Details |
|---|---|---|---|---|---|

|
#1
146th Ave
West Burlington, IA 52655
|
2,088 sq. feet
|
1 baths 4 beds |
show details | |

|
#2
116th St
West Burlington, IA 52655
|
- sq. feet
|
- baths - beds |
show details | |

|
#3
Washington Rd, Trlr 166
West Burlington, IA 52655
|
- sq. feet
|
- baths - beds |
show details | |

|
#4
N Chestnut St
New London, IA 52645
|
1,100 sq. feet
|
1 baths 2 beds |
$119,900
|
show details |

|
#5
Avenue B
Fort Madison, IA 52627
|
1,469 sq. feet
|
1 baths 3 beds |
$149,500
|
show details |

|
#6
Sycamore St
Burlington, IA 52601
|
1,475 sq. feet
|
1 baths 3 beds |
$24,900
|
show details |

|
#7
Ash St
Burlington, IA 52601
|
1,104 sq. feet
|
1 baths 3 beds |
show details | |

|
#8
S 10th St
Burlington, IA 52601
|
1,987 sq. feet
|
2 baths 5 beds |
show details | |

|
#9
Summer St
Burlington, IA 52601
|
1,432 sq. feet
|
1 baths 3 beds |
show details | |

|
#10
S 10th St
Burlington, IA 52601
|
- sq. feet
|
- baths - beds |
$19,900
|
show details |
| Photo | Address | Area | Beds / Baths | Price | Details |
|---|---|---|---|---|---|

|
#11
Angular St
Burlington, IA 52601
|
1,593 sq. feet
|
1 baths 3 beds |
show details | |

|
#12
Avenue D
Fort Madison, IA 52627
|
1,868 sq. feet
|
2 baths 3 beds |
show details | |

|
#13
150th St
Danville, IA 52623
|
1,512 sq. feet
|
2 baths 3 beds |
show details | |

|
#14
173rd Ave
Middletown, IA 52638
|
2,689 sq. feet
|
1 baths 4 beds |
show details | |

|
#15
Avenue D
Fort Madison, IA 52627
|
1,033 sq. feet
|
1 baths 1 beds |
show details | |

|
#16
Parkway Dr
Burlington, IA 52601
|
864 sq. feet
|
1 baths 2 beds |
show details | |

|
#17
Clay St
Burlington, IA 52601
|
1,848 sq. feet
|
1 baths 3 beds |
show details | |

|
#18
Remey Ave
Burlington, IA 52601
|
1,281 sq. feet
|
1 baths 2 beds |
show details | |

|
#19
S 12th St
Burlington, IA 52601
|
816 sq. feet
|
1 baths 3 beds |
show details | |

|
#20
S 9th St
Burlington, IA 52601
|
1,963 sq. feet
|
2 baths 2 beds |
show details |
| Photo | Address | Area | Beds / Baths | Price | Details |
|---|---|---|---|---|---|

|
#21
Monarch Dr
Burlington, IA 52601
|
2,062 sq. feet
|
2 baths 3 beds |
show details | |

|
#22
Spring St
Burlington, IA 52601
|
1,480 sq. feet
|
1 baths 3 beds |
show details | |

|
#23
Sunnyside Ave
Burlington, IA 52601
|
1,455 sq. feet
|
1 baths 3 beds |
show details | |

|
#24
N Gertrude St
Burlington, IA 52601
|
960 sq. feet
|
1 baths 3 beds |
show details | |

|
#25
West Ave
Burlington, IA 52601
|
1,705 sq. feet
|
1 baths 3 beds |
show details | |

|
#26
Evergreen Dr
Burlington, IA 52601
|
1,412 sq. feet
|
1 baths 3 beds |
show details | |

|
#27
N 6th St
Burlington, IA 52601
|
2,092 sq. feet
|
1 baths 4 beds |
show details | |

|
#28
S Garfield Ave
Burlington, IA 52601
|
- sq. feet
|
- baths - beds |
show details | |

|
#29
Valley St
Burlington, IA 52601
|
- sq. feet
|
- baths - beds |
show details | |

|
#30
Dmc Highway 99, Trlr 100
Burlington, IA 52601
|
- sq. feet
|
- baths - beds |
show details |
| Photo | Address | Area | Beds / Baths | Price | Details |
|---|---|---|---|---|---|

|
#31
Agency St Apt 32
Burlington, IA 52601
|
- sq. feet
|
- baths - beds |
show details | |

|
#32
S State Highway 164
Oquawka, IL 61469
|
- sq. feet
|
- baths - beds |
show details | |

|
#33
N 3rd St Apt 3
Burlington, IA 52601
|
- sq. feet
|
- baths - beds |
show details | |

|
#34
S 6th St
Burlington, IA 52601
|
- sq. feet
|
- baths - beds |
show details | |

|
#35
E County Road 3000
Dallas City, IL 62330
|
- sq. feet
|
- baths - beds |
show details | |

|
#36
Avenue F Apt 4
Fort Madison, IA 52627
|
- sq. feet
|
- baths - beds |
show details | |

|
#37
S 8th St
Burlington, IA 52601
|
- sq. feet
|
- baths - beds |
show details | |

|
#38
Storms Ct
Fort Madison, IA 52627
|
- sq. feet
|
- baths - beds |
show details | |

|
#39
Avenue G
Fort Madison, IA 52627
|
- sq. feet
|
- baths - beds |
show details | |

|
#40
Avenue G
Fort Madison, IA 52627
|
- sq. feet
|
- baths - beds |
show details |
| Photo | Address | Area | Beds / Baths | Price | Details |
|---|---|---|---|---|---|

|
#41
Country Club Ln
Fort Madison, IA 52627
|
- sq. feet
|
- baths - beds |
show details | |

|
#42
Avenue E
Fort Madison, IA 52627
|
- sq. feet
|
- baths - beds |
show details | |

|
#43
S State Route 94
Stronghurst, IL 61480
|
- sq. feet
|
- baths - beds |
show details | |

|
#44
Madison Ave
Burlington, IA 52601
|
- sq. feet
|
- baths - beds |
show details | |

|
#45
R Ln
Fort Madison, IA 52627
|
- sq. feet
|
- baths - beds |
show details | |

|
Check over 1 million property listings on Foreclosure.com!
|
browse all offers | |||


 | Moving to Burlington IA (16 replies) |
| Nervous About Move to Burlington, Iowa (7 replies) |
| Questions About Burlington/West Burlington (1 reply) |
| Burlington, IA (Need a little advice) (33 replies) |
| Could you please tell me what life in Middletown, IA is like... (6 replies) |
| May Be Relocating to IA (Fort Madison vs Burlington) (21 replies) |
Median year apartment built: 1969
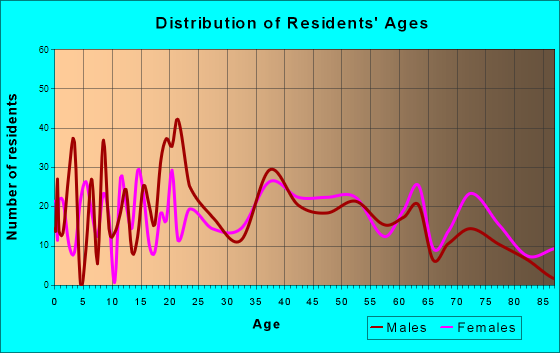
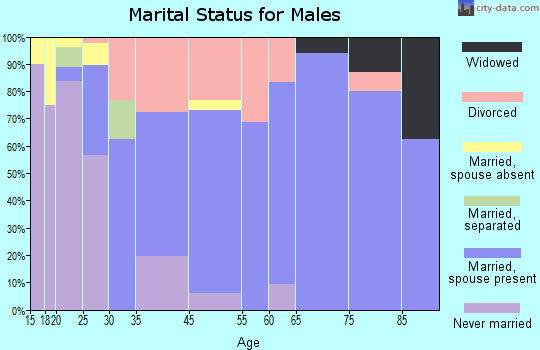
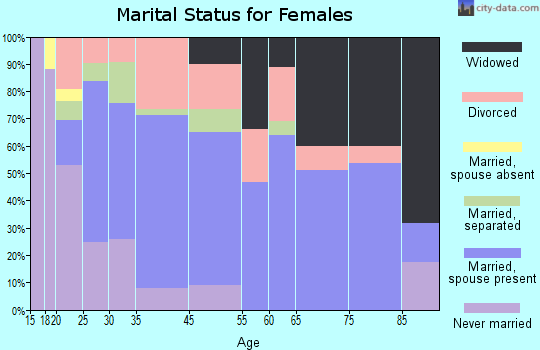
Household type by relationship:
Households: 3,195- Male householders: 581 (212 living alone), Female householders: 690 (254 living alone)
411 spouses (411 opposite-sex spouses), 93 unmarried partners, (93 opposite-sex unmarried partners), 854 children (813 natural, 0 adopted, 40 stepchildren), 0 grandchildren, 21 brothers or sisters, 4 parents, 158 foster children, 0 other relatives, 100 non-relatives
- In group quarters: 281
Size of family households: 278 2-persons, 124 3-persons, 191 4-persons, 66 5-persons, 7 7-or-more-persons.
Size of nonfamily households: 486 1-person, 139 2-persons, 10 4-persons.
360 married couples with children.
166 single-parent households (0 men, 166 women).
97.4% of residents of West Burlington speak English at home.
0.6% of residents speak Spanish at home (100% speak English well).
1.2% of residents speak other Indo-European language at home (75% speak English very well, 25% speak English well).
0.5% of residents speak other language at home (100% speak English very well).
Foreign born population: 56 (1.8%)
(32.1% of them are naturalized citizens)
| Here: | 6.2 |
| State: | 6.8 |
| Here: | 4.1 |
| State: | 4.2 |

- Bedrooms in owner-occupied houses and condos in West Burlington, Iowa
- 0no bedroom
- 51 bedroom
- 2232 bedrooms
- 3603 bedrooms
- 644 bedrooms
- 255+ bedrooms

- Bedrooms in renter-occupied apartments in West Burlington, Iowa
- 0no bedroom
- 2421 bedroom
- 2092 bedrooms
- 1783 bedrooms
- 04 bedrooms
- 05+ bedrooms

- Cars and other vehicles available in West Burlington in owner-occupied houses/condos
- 5no vehicle
- 1761 vehicle
- 1912 vehicles
- 1273 vehicles
- 304 vehicles
- 1485+ vehicles

- Cars and other vehicles available in West Burlington in renter-occupied apartments
- 113no vehicle
- 4091 vehicle
- 282 vehicles
- 373 vehicles
- 434 vehicles
- 05+ vehicles

- Rooms in owner-occupied houses in West Burlington, Iowa
- 01 room
- 02 rooms
- 253 rooms
- 764 rooms
- 905 rooms
- 2396 rooms
- 547 rooms
- 1068 rooms
- 879+ rooms

- Rooms in renter-occupied apartments in West Burlington, Iowa
- 01 room
- 262 rooms
- 1613 rooms
- 2104 rooms
- 1875 rooms
- 326 rooms
- 77 rooms
- 08 rooms
- 79+ rooms


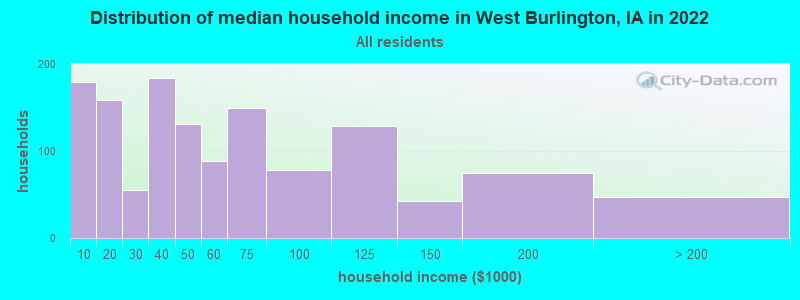
West Burlington, IA household income distribution

- 179Less than $10,000
- 159$10,000 to $19,999
- 55$20,000 to $29,999
- 184$30,000 to $39,999
- 131$40,000 to $49,999
- 88$50,000 to $59,999
- 149$60,000 to $74,999
- 78$75,000 to $99,999
- 129$100,000 to $124,999
- 42$125,000 to $149,999
- 75$150,000 to $199,999
- 47$200,000 or more
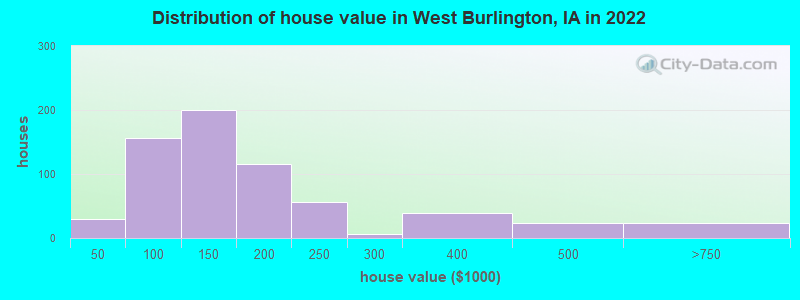
Home value of owner - occupied houses in 2022 in West Burlington, IA
-
- 8$10,000 to $14,999
- 20$25,000 to $29,999
- 4$50,000 to $59,999
- 48$60,000 to $69,999
- 61$70,000 to $79,999
- 17$80,000 to $89,999
- 24$90,000 to $99,999
- 63$100,000 to $124,999
- 136$125,000 to $149,999
- 76$150,000 to $174,999
- 38$175,000 to $199,999
- 56$200,000 to $249,999
- 7$250,000 to $299,999
- 39$300,000 to $399,999
- 22$400,000 to $499,999
- 24$500,000 to $749,999
Rent paid by renters in 2022 in West Burlington, IA
-
- 8$200 to $249
- 13$250 to $299
- 24$300 to $349
- 22$400 to $449
- 36$450 to $499
- 62$500 to $549
- 48$550 to $599
- 65$600 to $649
- 68$650 to $699
- 21$700 to $749
- 70$750 to $799
- 70$900 to $999
- 66$1,000 to $1,249
- 11$2,500 to $2,999
- 21No cash rent


Percentage of workers working in this county: 79.1%
Number of people working at home: 40 (2.8% of all workers)

Travel time to work (commute)
- Less than 5 minutes: 118
- 5 to 9 minutes: 364
- 10 to 14 minutes: 351
- 15 to 19 minutes: 322
- 20 to 24 minutes: 55
- 25 to 29 minutes: 42
- 30 to 34 minutes: 72
- 35 to 39 minutes: 8
- 40 to 44 minutes: 0
- 45 to 59 minutes: 11
- 60 to 89 minutes: 18
- 90 or more minutes: 9
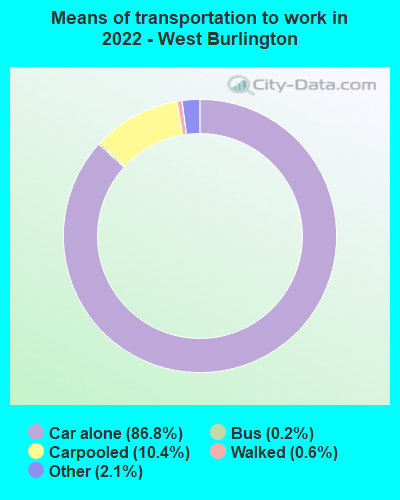
Means of transportation to work:
- Drove a car alone: 5,166 (84.2%)
- Carpooled: 652 (10.6%)
- Bus: 13 (0.2%)
- Taxi: 116 (1.9%)
- Walked: 34 (0.6%)
- Worked at home: 40 (0.7%)

- Unemployment by race in 2022
- Unemployment rate for White non-Hispanic residents
- 0.9%Males
- 2.0%Females
- Unemployment rate for Black residents
- 2.0%Males

- Year of entry for the foreign-born population in West Burlington, Iowa
- 402010 or later
- 02000 to 2009
- 01990 to 1999
- 71980 to 1989
- 01970 to 1979
- 47Before 1970

First ancestries reported:
- German: 313 (22.8%)
- Norwegian: 148 (10.8%)
- English: 108 (7.9%)
- American: 90 (6.6%)
- Irish: 84 (6.1%)
- Armenian: 37 (2.7%)
- African: 35 (2.5%)
- European: 30 (2.2%)
- Dutch: 26 (1.9%)
- Scottish: 18 (1.3%)
- Swedish: 12 (0.9%)
- Welsh: 9 (0.7%)
- Scotch-Irish: 7 (0.5%)
- Canadian: 6 (0.4%)
- Nigerian: 3 (0.2%)
Most common places of birth for foreign-born residents (%):
| West Burlington: | 37.0% (20) |
| Iowa: | 1.4% (2,525) |
| West Burlington: | 37.0% (20) |
| Iowa: | 0.7% (1,326) |
| West Burlington: | 18.5% (10) |
| Iowa: | 0.0% (74) |
| West Burlington: | 7.4% (4) |
| Iowa: | 0.7% (1,204) |
Place of birth for U.S.-born residents:
- This state: 2,474
- Other state: 655
- Northeast: 0
- Midwest: 392
- South: 149
- West: 113
82.2% of West Burlington residents lived in the same house 1 years ago.
Out of people who lived in different houses, 38.4% lived in this county.
Out of people who lived in different counties, 39.2% lived in Iowa.
| West Burlington: | 82.2% |
| State average: | 87.2% |
Education attainment for males 25 years and older:
- No schooling: 6
- Nursery to 4th grade: 0
- 5th and 6th grade: 0
- 7th and 8th grade: 10
- 9th grade: 0
- 10th grade: 19
- 11th grade: 5
- 12th grade, no diploma: 44
- High school graduate (or equivalency): 281
- Less than 1 year of college: 71
- Some college more than 1 year, no degree: 63
- Associate degree: 89
- Bachelor's degree: 273
- Master's degree: 66
- Professional school degree: 21
- Doctorate degree: 0

Education attainment for females 25 years and older:
- No schooling: 6
- Nursery to 4th grade: 0
- 5th and 6th grade: 0
- 7th and 8th grade: 0
- 9th grade: 0
- 10th grade: 14
- 11th grade: 2
- 12th grade, no diploma: 21
- High school graduate (or equivalency): 396
- Less than 1 year of college: 181
- Some college more than 1 year, no degree: 129
- Associate degree: 149
- Bachelor's degree: 103
- Master's degree: 44
- Professional school degree: 31
- Doctorate degree: 0

Housing units in structures:
- One, detached: 795
- One, attached: 80
- Two: 11
- 3 or 4: 73
- 5 to 9: 54
- 10 to 19: 77
- 20 to 49: 66
- 50 or more: 103
- Mobile homes: 83
Median worth of mobile homes: $32,376
House/condo owner moved in on average 13 years ago
Renter moved in on average 4 years ago

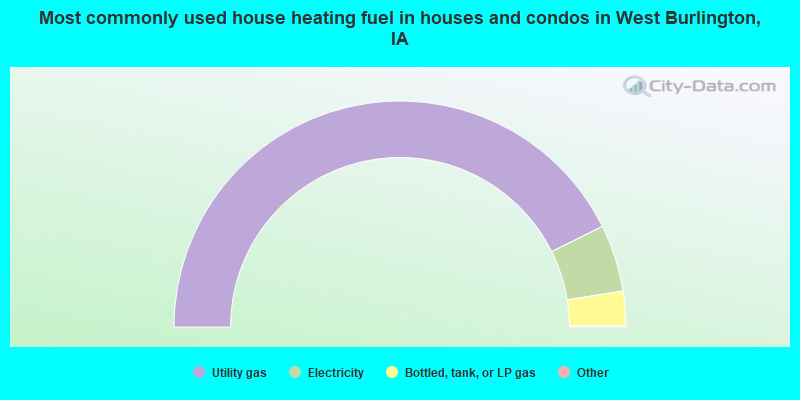
- 85.5%Utility gas
- 9.6%Electricity
- 4.9%Bottled, tank, or LP gas

- 53.0%Utility gas
- 45.3%Electricity
- 1.6%Bottled, tank, or LP gas
Private vs. public school enrollment:
| Here: | 0.0% |
| Iowa: | 10.6% |
| Here: | 0.0% |
| Iowa: | 7.9% |
| Here: | 13.4% |
| Iowa: | 23.9% |


