West Sacramento, CA (California) Houses and Residents
| West Sacramento: | $490,751 |
| California: | $715,900 |
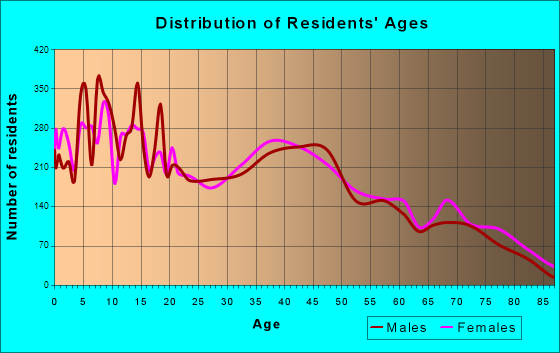
Total population: 51,847 (Urban population: 31,142, Rural population: 462 (all nonfarm))
Houses: 20,444 (19,431 occupied: 11,163 owner occupied, 8,118 renter occupied)
| % of renters here: | 42% |
| State: | 44% |
Housing density: 976 houses/condos per square mile
Median price asked for vacant for-sale houses and condos in 2022: $611,821.
Median contract rent in 2022: $1,289 (lower quartile is $896, upper quartile is $1,849)
Median rent asked for vacant for-rent units in 2022: $1,415
Median gross rent in West Sacramento, CA in 2022: $1,450
Housing units in West Sacramento with a mortgage: 8,588 (684 second mortgage, 22 home equity loan, 464 both second mortgage and home equity loan)
Houses without a mortgage: 64
Median household income for houses/condos with a mortgage: $136,648
Median household income for apartments without a mortgage: $73,330
Median monthly housing costs: $1,701
Compare current foreclosures in West Sacramento, CA:
| Photo | Address | Area | Beds / Baths | Price | Details |
|---|---|---|---|---|---|

|
#1
Claudia Ct
West Sacramento, CA 95691
|
- sq. feet
|
2 baths 3 beds |
$40,177
|
show details |

|
#2
Chelan Rd
West Sacramento, CA 95691
|
- sq. feet
|
3 baths 4 beds |
show details | |

|
#3
Merkley Ave
West Sacramento, CA 95691
|
- sq. feet
|
- baths - beds |
$18,785
|
show details |

|
#4
Kegle Dr
West Sacramento, CA 95605
|
- sq. feet
|
1 baths 2 beds |
show details | |

|
#5
Garnet St
West Sacramento, CA 95691
|
- sq. feet
|
2 baths 3 beds |
show details | |

|
#6
San Salvador St
West Sacramento, CA 95691
|
- sq. feet
|
- baths - beds |
show details | |

|
#7
Jennings Ct
West Sacramento, CA 95691
|
- sq. feet
|
- baths - beds |
show details | |

|
#8
Glide Ave Spc 46
West Sacramento, CA 95691
|
- sq. feet
|
- baths - beds |
show details | |

|
#9
Quail Rd
West Sacramento, CA 95691
|
- sq. feet
|
- baths - beds |
show details | |

|
#10
Merkley Ave
West Sacramento, CA 95691
|
- sq. feet
|
- baths - beds |
show details |
| Photo | Address | Area | Beds / Baths | Price | Details |
|---|---|---|---|---|---|

|
#11
Bryte Ave
West Sacramento, CA 95605
|
- sq. feet
|
- baths - beds |
show details | |

|
#12
5th St # 212
West Sacramento, CA 95605
|
- sq. feet
|
- baths - beds |
show details | |

|
#13
4th St Apt 16
West Sacramento, CA 95605
|
- sq. feet
|
- baths - beds |
show details | |

|
#14
7th St Apt 210
West Sacramento, CA 95605
|
- sq. feet
|
- baths - beds |
show details | |

|
#15
Highland Dr
West Sacramento, CA 95691
|
- sq. feet
|
- baths - beds |
show details | |

|
#16
Madrone Ave
West Sacramento, CA 95691
|
- sq. feet
|
- baths - beds |
show details | |

|
#17
Lake Rd Spc 136
West Sacramento, CA 95691
|
- sq. feet
|
- baths - beds |
show details | |

|
#18
9th Ave
West Sacramento, CA 95691
|
- sq. feet
|
- baths - beds |
show details | |

|
#19
Falcon Ct
West Sacramento, CA 95691
|
- sq. feet
|
- baths - beds |
show details | |

|
#20
Sacramento Ave Unit 78
West Sacramento, CA 95605
|
- sq. feet
|
- baths - beds |
show details |
| Photo | Address | Area | Beds / Baths | Price | Details |
|---|---|---|---|---|---|

|
#21
Denise Ct
West Sacramento, CA 95691
|
- sq. feet
|
- baths - beds |
show details | |

|
#22
Longspur Ln
West Sacramento, CA 95691
|
- sq. feet
|
- baths - beds |
show details | |

|
#23
Circle St
West Sacramento, CA 95691
|
- sq. feet
|
- baths - beds |
show details | |

|
#24
Orchard Way Unit 10
West Sacramento, CA 95691
|
- sq. feet
|
- baths - beds |
show details | |

|
#25
Savannah Ln Apt 1718
West Sacramento, CA 95691
|
- sq. feet
|
- baths - beds |
show details | |

|
#26
Henshaw Rd
West Sacramento, CA 95691
|
- sq. feet
|
- baths - beds |
show details | |

|
#27
Liverpool St
West Sacramento, CA 95691
|
- sq. feet
|
- baths - beds |
show details | |

|
#28
Carolina Ave
West Sacramento, CA 95691
|
- sq. feet
|
- baths - beds |
show details | |

|
#29
Berry Creek Rd
West Sacramento, CA 95691
|
- sq. feet
|
- baths - beds |
show details | |

|
#30
Coyote Rd
West Sacramento, CA 95691
|
- sq. feet
|
- baths - beds |
show details |
| Photo | Address | Area | Beds / Baths | Price | Details |
|---|---|---|---|---|---|

|
#31
Wake Island Ct
West Sacramento, CA 95691
|
- sq. feet
|
- baths - beds |
show details | |

|
#32
San Vincente Rd
West Sacramento, CA 95691
|
- sq. feet
|
- baths - beds |
show details | |

|
#33
Twitchell Island Rd
West Sacramento, CA 95691
|
- sq. feet
|
- baths - beds |
show details | |

|
#34
Isabella St
West Sacramento, CA 95691
|
- sq. feet
|
- baths - beds |
show details | |

|
#35
Chaparral Way
West Sacramento, CA 95691
|
- sq. feet
|
- baths - beds |
show details | |

|
#36
Rivermont St
West Sacramento, CA 95691
|
- sq. feet
|
- baths - beds |
show details | |

|
#37
Rogers St
West Sacramento, CA 95605
|
- sq. feet
|
- baths - beds |
show details | |

|
#38
Cat Island Rd
West Sacramento, CA 95691
|
- sq. feet
|
- baths - beds |
show details | |

|
#39
Squaw Rd
West Sacramento, CA 95691
|
- sq. feet
|
- baths - beds |
show details | |

|
#40
Stone Blvd
West Sacramento, CA 95691
|
- sq. feet
|
- baths - beds |
show details |
| Photo | Address | Area | Beds / Baths | Price | Details |
|---|---|---|---|---|---|

|
#41
Regatta Ln Apt 104
West Sacramento, CA 95605
|
- sq. feet
|
- baths - beds |
show details | |

|
#42
Union Square Rd
West Sacramento, CA 95691
|
- sq. feet
|
- baths - beds |
show details | |

|
Check over 1 million property listings on Foreclosure.com!
|
browse all offers | |||


 | Explain to me why highrise condos/apartments in Sacramento don't pencil out (87 replies) |
| Median Household Income Census Edition (33 replies) |
| The Los Angeles Homeless Containment Thread (9133 replies) |
| is it OK to rent "forever"? (150 replies) |
| Mayor wants to spread homeless in residential areas (18 replies) |
| Why Does Sacramento Get a Bad Rap? (261 replies) |
Median year apartment built: 1976
Household type by relationship:
Households: 55,403- Male householders: 9,066 (1,772 living alone), Female householders: 10,347 (2,465 living alone)
9,862 spouses (9,700 opposite-sex spouses), 1,657 unmarried partners, (1,565 opposite-sex unmarried partners), 18,146 children (17,372 natural, 365 adopted, 409 stepchildren), 1,056 grandchildren, 934 brothers or sisters, 1,011 parents, 43 foster children, 1,300 other relatives, 1,443 non-relatives
- In group quarters: 532
Size of family households: 4,490 2-persons, 2,553 3-persons, 3,153 4-persons, 1,475 5-persons, 413 6-persons, 933 7-or-more-persons.
Size of nonfamily households: 4,523 1-person, 1,650 2-persons, 120 3-persons, 64 4-persons.
9,074 married couples with children.
3,649 single-parent households (567 men, 3,082 women).
60.5% of residents of West Sacramento speak English at home.
21.7% of residents speak Spanish at home (56% speak English very well, 20% speak English well, 17% speak English not well, 6% don't speak English at all).
13.2% of residents speak other Indo-European language at home (52% speak English very well, 21% speak English well, 20% speak English not well, 7% don't speak English at all).
5.1% of residents speak Asian or Pacific Island language at home (57% speak English very well, 22% speak English well, 13% speak English not well, 7% don't speak English at all).
0.6% of residents speak other language at home (82% speak English very well, 2% speak English well, 11% speak English not well, 4% don't speak English at all).
Foreign born population: 12,453 (22.5%)
(59.4% of them are naturalized citizens)
| Here: | 5.9 |
| State: | 6.0 |
| Here: | 3.9 |
| State: | 3.9 |

- Bedrooms in owner-occupied houses and condos in West Sacramento, California
- 73no bedroom
- 2611 bedroom
- 1,9502 bedrooms
- 5,0013 bedrooms
- 3,0174 bedrooms
- 8625+ bedrooms

- Bedrooms in renter-occupied apartments in West Sacramento, California
- 626no bedroom
- 2,3271 bedroom
- 2,4462 bedrooms
- 1,9813 bedrooms
- 6264 bedrooms
- 1135+ bedrooms

- Cars and other vehicles available in West Sacramento in owner-occupied houses/condos
- 308no vehicle
- 2,7381 vehicle
- 4,7202 vehicles
- 2,2143 vehicles
- 8784 vehicles
- 3065+ vehicles

- Cars and other vehicles available in West Sacramento in renter-occupied apartments
- 1,192no vehicle
- 3,0751 vehicle
- 2,3802 vehicles
- 1,1513 vehicles
- 1674 vehicles
- 1535+ vehicles

- Rooms in owner-occupied houses in West Sacramento, California
- 311 room
- 932 rooms
- 3333 rooms
- 1,5194 rooms
- 2,1475 rooms
- 2,6596 rooms
- 1,6057 rooms
- 1,5108 rooms
- 1,2669+ rooms

- Rooms in renter-occupied apartments in West Sacramento, California
- 5791 room
- 8252 rooms
- 1,6553 rooms
- 2,1174 rooms
- 1,4225 rooms
- 7626 rooms
- 3497 rooms
- 2018 rooms
- 2079+ rooms


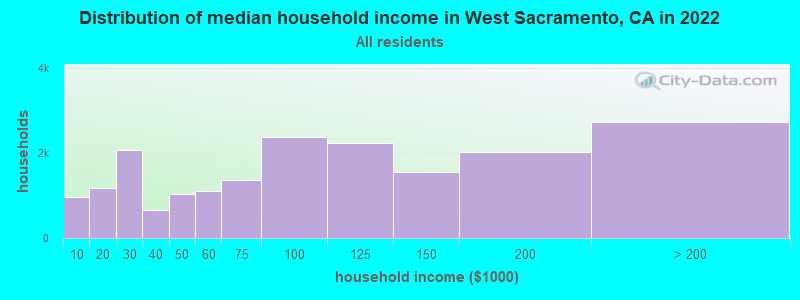
West Sacramento, CA household income distribution

- 955Less than $10,000
- 1,175$10,000 to $19,999
- 2,082$20,000 to $29,999
- 661$30,000 to $39,999
- 1,030$40,000 to $49,999
- 1,111$50,000 to $59,999
- 1,359$60,000 to $74,999
- 2,383$75,000 to $99,999
- 2,233$100,000 to $124,999
- 1,563$125,000 to $149,999
- 2,017$150,000 to $199,999
- 2,731$200,000 or more
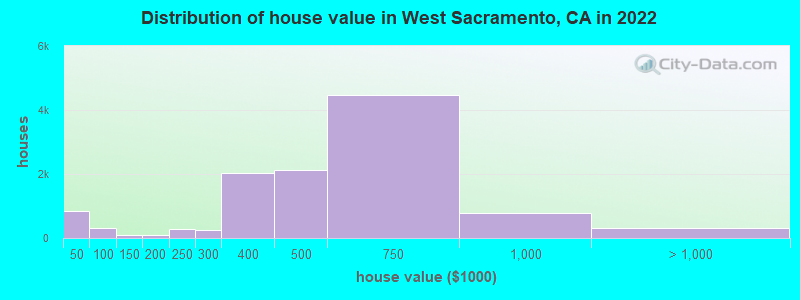
Home value of owner - occupied houses in 2022 in West Sacramento, CA
-
- 177Less than $10,000
- 19$10,000 to $14,999
- 44$15,000 to $19,999
- 214$20,000 to $24,999
- 26$25,000 to $29,999
- 271$30,000 to $34,999
- 16$35,000 to $39,999
- 72$40,000 to $49,999
- 7$50,000 to $59,999
- 28$60,000 to $69,999
- 160$70,000 to $79,999
- 21$80,000 to $89,999
- 15$90,000 to $99,999
- 79$100,000 to $124,999
- 20$125,000 to $149,999
- 102$150,000 to $174,999
- 271$200,000 to $249,999
- 259$250,000 to $299,999
- 2,039$300,000 to $399,999
- 2,111$400,000 to $499,999
- 4,459$500,000 to $749,999
- 773$750,000 to $999,999
- 185$1,000,000 to $1,499,999
- 66$1,500,000 to $1,999,999
- 55$2,000,000 or more
Rent paid by renters in 2022 in West Sacramento, CA
-
- 60$100 to $149
- 109$150 to $199
- 134$200 to $249
- 83$250 to $299
- 74$300 to $349
- 8$350 to $399
- 129$400 to $449
- 39$450 to $499
- 114$500 to $549
- 134$550 to $599
- 172$600 to $649
- 374$650 to $699
- 197$700 to $749
- 159$750 to $799
- 491$800 to $899
- 435$900 to $999
- 1,262$1,000 to $1,249
- 666$1,250 to $1,499
- 1,619$1,500 to $1,999
- 673$2,000 to $2,499
- 485$2,500 to $2,999
- 21$3,000 to $3,499
- 209No cash rent


Percentage of workers working in this county: 46.9%
Number of people working at home: 4,014 (14.9% of all workers)
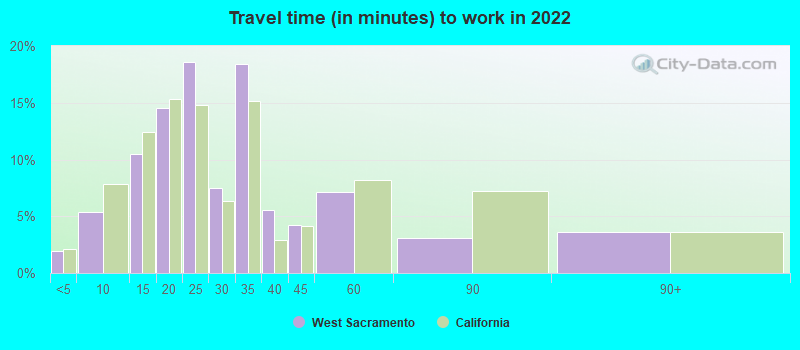
Travel time to work (commute)
- Less than 5 minutes: 435
- 5 to 9 minutes: 1,857
- 10 to 14 minutes: 3,429
- 15 to 19 minutes: 4,548
- 20 to 24 minutes: 4,569
- 25 to 29 minutes: 1,419
- 30 to 34 minutes: 2,589
- 35 to 39 minutes: 578
- 40 to 44 minutes: 766
- 45 to 59 minutes: 787
- 60 to 89 minutes: 1,286
- 90 or more minutes: 673
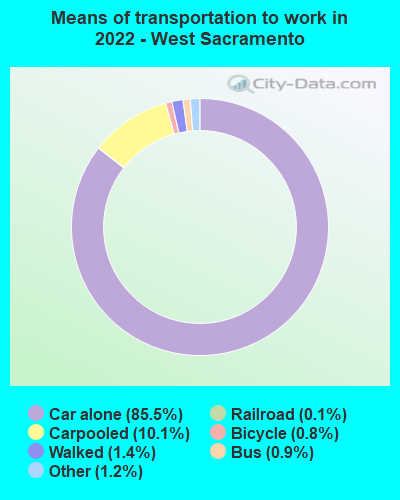
Means of transportation to work:
- Drove a car alone: 28,165 (75.1%)
- Carpooled: 4,418 (11.8%)
- Bus: 148 (0.4%)
- Long-distance train or commuter rail: 20 (0.1%)
- Light rail, streetcar or trolley: 37 (0.1%)
- Taxi: 448 (1.2%)
- Bicycle: 226 (0.6%)
- Walked: 420 (1.1%)
- Worked at home: 4,014 (10.7%)

- Unemployment by race in 2022
- Unemployment rate for White non-Hispanic residents
- 4.3%Males
- 4.1%Females
- Unemployment rate for Black residents
- 9.2%Males
- 8.1%Females
- Unemployment rate for American Indian and Alaska Native residents
- 33.8%Females
- Unemployment rate for Asian residents
- 3.9%Males
- 2.6%Females
- Unemployment rate for other race residents
- 2.3%Males
- 2.8%Females
- Unemployment rate for two or more race residents
- 11.1%Males
- 17.4%Females
- Unemployment rate for Hispanic or Latino residents
- 3.8%Males
- 11.9%Females

- Year of entry for the foreign-born population in West Sacramento, California
- 3,8932010 or later
- 3,2782000 to 2009
- 2,9631990 to 1999
- 1,9391980 to 1989
- 6751970 to 1979
- 794Before 1970
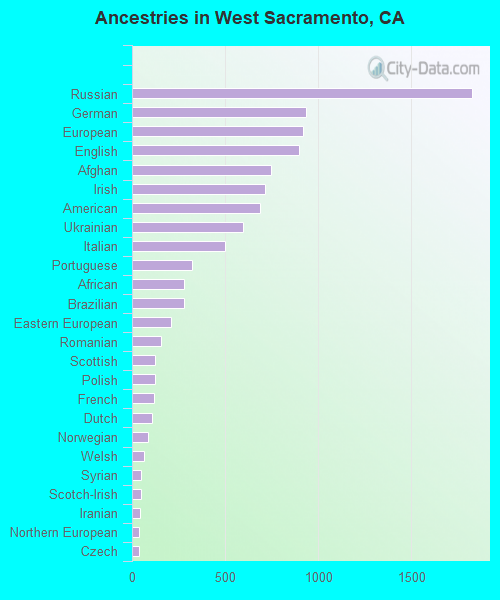
First ancestries reported:
- Russian: 1,826 (6.2%)
- German: 934 (3.2%)
- European: 919 (3.1%)
- English: 896 (3.0%)
- Afghan: 747 (2.5%)
- Irish: 715 (2.4%)
- American: 690 (2.3%)
- Ukrainian: 596 (2.0%)
- Italian: 497 (1.7%)
- Portuguese: 322 (1.1%)
- African: 278 (0.9%)
- Brazilian: 277 (0.9%)
- Eastern European: 207 (0.7%)
- Romanian: 155 (0.5%)
- Scottish: 124 (0.4%)
- Polish: 123 (0.4%)
- French: 118 (0.4%)
- Dutch: 110 (0.4%)
- Norwegian: 88 (0.3%)
- Welsh: 62 (0.2%)
- Syrian: 47 (0.2%)
- Scotch-Irish: 46 (0.2%)
- Iranian: 44 (0.1%)
- Northern European: 38 (0.1%)
- Czech: 35 (0.1%)
- Swedish: 30 (0.1%)
- British: 29 (0.10%)
- Lithuanian: 26 (0.09%)
- Pennsylvania German: 25 (0.08%)
- Armenian: 23 (0.08%)
- Haitian: 23 (0.08%)
- French Canadian: 20 (0.07%)
- Finnish: 20 (0.07%)
- Macedonian: 19 (0.06%)
- South African: 19 (0.06%)
- Belgian: 17 (0.06%)
- Yugoslavian: 17 (0.06%)
- Slavic: 16 (0.05%)
- Lebanese: 15 (0.05%)
- Swiss: 15 (0.05%)
- Greek: 12 (0.04%)
- Bulgarian: 10 (0.03%)
- Scandinavian: 9 (0.03%)
- Egyptian: 8 (0.03%)
- Albanian: 8 (0.03%)
- Danish: 6 (0.02%)
- Austrian: 6 (0.02%)
- Slovene: 6 (0.02%)
- Hungarian: 2 (0.01%)
Most common places of birth for foreign-born residents (%):
| West Sacramento: | 36.3% (4,672) |
| California: | 37.2% (3,881,193) |
| West Sacramento: | 8.4% (1,086) |
| California: | 0.7% (71,932) |
| West Sacramento: | 6.3% (813) |
| California: | 0.5% (53,260) |
| West Sacramento: | 5.2% (667) |
| California: | 5.2% (539,184) |
| West Sacramento: | 5.2% (663) |
| California: | 0.6% (60,761) |
| West Sacramento: | 3.6% (463) |
| California: | 6.6% (684,672) |
| West Sacramento: | 2.9% (377) |
| California: | 7.8% (818,297) |
| West Sacramento: | 2.8% (354) |
| California: | 4.9% (512,335) |
| West Sacramento: | 2.6% (333) |
| California: | 0.1% (6,648) |
| West Sacramento: | 2.4% (312) |
| California: | 0.5% (53,222) |
| West Sacramento: | 2.4% (306) |
| California: | 0.1% (5,897) |
| West Sacramento: | 2.0% (263) |
| California: | 4.2% (440,287) |
| West Sacramento: | 1.6% (208) |
| California: | 0.3% (33,937) |
| West Sacramento: | 1.6% (208) |
| California: | 3.0% (315,248) |
Place of birth for U.S.-born residents:
- This state: 35,412
- Other state: 6,798
- Northeast: 1,054
- Midwest: 1,389
- South: 1,959
- West: 2,501
91.3% of West Sacramento residents lived in the same house 1 years ago.
Out of people who lived in different houses, 27.6% lived in this county.
Out of people who lived in different counties, 90.2% lived in California.
| West Sacramento: | 91.3% |
| State average: | 88.9% |
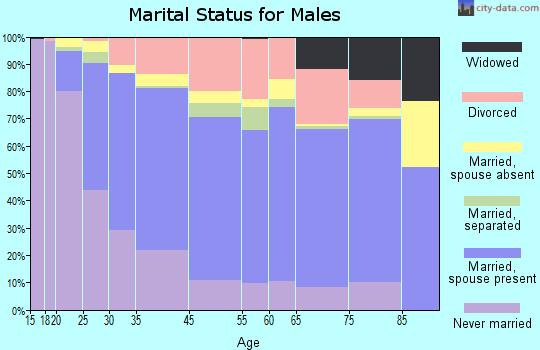
Education attainment for males 25 years and older:
- No schooling: 314
- Nursery to 4th grade: 206
- 5th and 6th grade: 497
- 7th and 8th grade: 143
- 9th grade: 408
- 10th grade: 216
- 11th grade: 218
- 12th grade, no diploma: 617
- High school graduate (or equivalency): 3,852
- Less than 1 year of college: 1,088
- Some college more than 1 year, no degree: 3,361
- Associate degree: 1,081
- Bachelor's degree: 3,235
- Master's degree: 1,045
- Professional school degree: 592
- Doctorate degree: 227

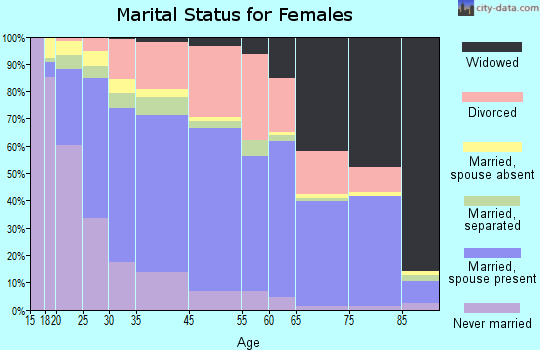
Education attainment for females 25 years and older:
- No schooling: 874
- Nursery to 4th grade: 167
- 5th and 6th grade: 424
- 7th and 8th grade: 205
- 9th grade: 337
- 10th grade: 180
- 11th grade: 51
- 12th grade, no diploma: 350
- High school graduate (or equivalency): 4,484
- Less than 1 year of college: 1,137
- Some college more than 1 year, no degree: 2,783
- Associate degree: 1,841
- Bachelor's degree: 3,794
- Master's degree: 997
- Professional school degree: 857
- Doctorate degree: 310

Housing units in structures:
- One, detached: 13,147
- One, attached: 1,119
- Two: 436
- 3 or 4: 770
- 5 to 9: 1,116
- 10 to 19: 847
- 20 to 49: 684
- 50 or more: 1,210
- Mobile homes: 1,111
Median worth of mobile homes: $37,377
Housing units lacking complete kitchen facilities in 2022: 1.1%
House/condo owner moved in on average 8 years ago
Renter moved in on average 4 years ago

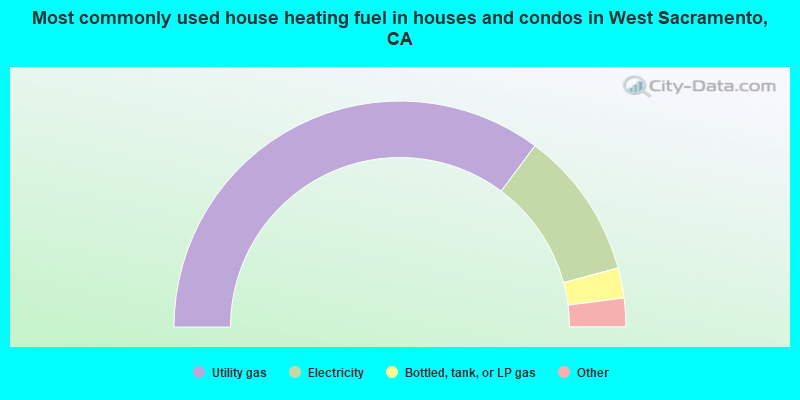
- 70.4%Utility gas
- 21.2%Electricity
- 4.3%Bottled, tank, or LP gas
- 2.9%Solar energy
- 0.7%Wood
- 0.4%No fuel used
- 0.2%Other fuel
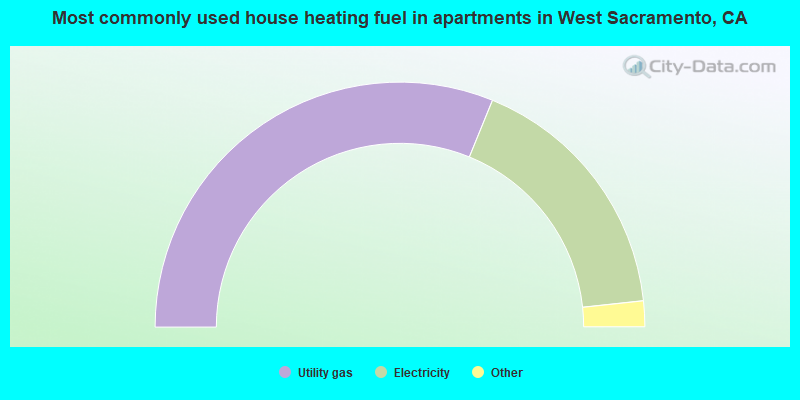
- 62.4%Utility gas
- 34.3%Electricity
- 2.4%No fuel used
- 0.6%Bottled, tank, or LP gas
- 0.3%Solar energy
- 0.1%Other fuel
Private vs. public school enrollment:
| Here: | 14.6% |
| California: | 10.5% |
| Here: | 7.1% |
| California: | 8.5% |
| Here: | 10.1% |
| California: | 15.9% |


