Farmersville, California Submit your own pictures of this city and show them to the world
OSM Map
General Map
Google Map
MSN Map
OSM Map
General Map
Google Map
MSN Map
OSM Map
General Map
Google Map
MSN Map
OSM Map
General Map
Google Map
MSN Map
Please wait while loading the map...
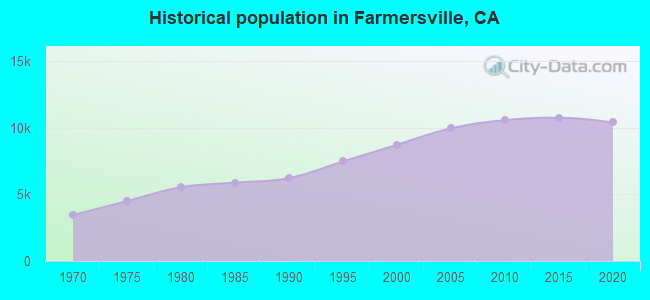
Population in 2022: 10,324 (100% urban, 0% rural). Population change since 2000: +18.2%Males: 5,190 Females: 5,134
March 2022 cost of living index in Farmersville: 88.3 (less than average, U.S. average is 100) Percentage of residents living in poverty in 2022: 24.6%for White Non-Hispanic residents , 12.2% for Black residents , 24.9% for Hispanic or Latino residents , 29.5% for other race residents , 16.1% for two or more races residents )Business Search - 14 Million verified businesses
Data:
Median household income ($)
Median household income (% change since 2000)
Household income diversity
Ratio of average income to average house value (%)
Ratio of average income to average rent
Median household income ($) - White
Median household income ($) - Black or African American
Median household income ($) - Asian
Median household income ($) - Hispanic or Latino
Median household income ($) - American Indian and Alaska Native
Median household income ($) - Multirace
Median household income ($) - Other Race
Median household income for houses/condos with a mortgage ($)
Median household income for apartments without a mortgage ($)
Races - White alone (%)
Races - White alone (% change since 2000)
Races - Black alone (%)
Races - Black alone (% change since 2000)
Races - American Indian alone (%)
Races - American Indian alone (% change since 2000)
Races - Asian alone (%)
Races - Asian alone (% change since 2000)
Races - Hispanic (%)
Races - Hispanic (% change since 2000)
Races - Native Hawaiian and Other Pacific Islander alone (%)
Races - Native Hawaiian and Other Pacific Islander alone (% change since 2000)
Races - Two or more races (%)
Races - Two or more races (% change since 2000)
Races - Other race alone (%)
Races - Other race alone (% change since 2000)
Racial diversity
Unemployment (%)
Unemployment (% change since 2000)
Unemployment (%) - White
Unemployment (%) - Black or African American
Unemployment (%) - Asian
Unemployment (%) - Hispanic or Latino
Unemployment (%) - American Indian and Alaska Native
Unemployment (%) - Multirace
Unemployment (%) - Other Race
Population density (people per square mile)
Population - Males (%)
Population - Females (%)
Population - Males (%) - White
Population - Males (%) - Black or African American
Population - Males (%) - Asian
Population - Males (%) - Hispanic or Latino
Population - Males (%) - American Indian and Alaska Native
Population - Males (%) - Multirace
Population - Males (%) - Other Race
Population - Females (%) - White
Population - Females (%) - Black or African American
Population - Females (%) - Asian
Population - Females (%) - Hispanic or Latino
Population - Females (%) - American Indian and Alaska Native
Population - Females (%) - Multirace
Population - Females (%) - Other Race
Coronavirus confirmed cases (Apr 28, 2024)
Deaths caused by coronavirus (Apr 28, 2024)
Coronavirus confirmed cases (per 100k population) (Apr 28, 2024)
Deaths caused by coronavirus (per 100k population) (Apr 28, 2024)
Daily increase in number of cases (Apr 28, 2024)
Weekly increase in number of cases (Apr 28, 2024)
Cases doubled (in days) (Apr 28, 2024)
Hospitalized patients (Apr 18, 2022)
Negative test results (Apr 18, 2022)
Total test results (Apr 18, 2022)
COVID Vaccine doses distributed (per 100k population) (Sep 19, 2023)
COVID Vaccine doses administered (per 100k population) (Sep 19, 2023)
COVID Vaccine doses distributed (Sep 19, 2023)
COVID Vaccine doses administered (Sep 19, 2023)
Likely homosexual households (%)
Likely homosexual households (% change since 2000)
Likely homosexual households - Lesbian couples (%)
Likely homosexual households - Lesbian couples (% change since 2000)
Likely homosexual households - Gay men (%)
Likely homosexual households - Gay men (% change since 2000)
Cost of living index
Median gross rent ($)
Median contract rent ($)
Median monthly housing costs ($)
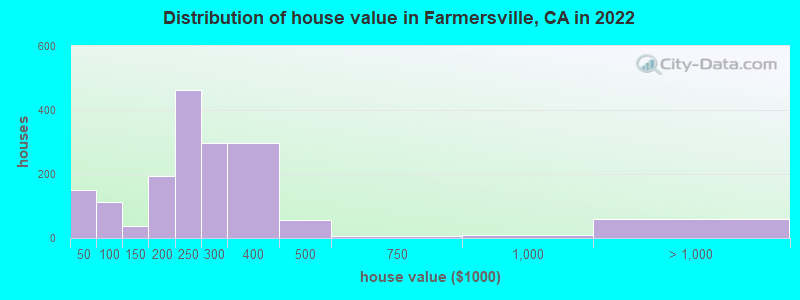
Median house or condo value ($)
Median house or condo value ($ change since 2000)
Mean house or condo value by units in structure - 1, detached ($)
Mean house or condo value by units in structure - 1, attached ($)
Mean house or condo value by units in structure - 2 ($)
Mean house or condo value by units in structure by units in structure - 3 or 4 ($)
Mean house or condo value by units in structure - 5 or more ($)
Mean house or condo value by units in structure - Boat, RV, van, etc. ($)
Mean house or condo value by units in structure - Mobile home ($)
Median house or condo value ($) - White
Median house or condo value ($) - Black or African American
Median house or condo value ($) - Asian
Median house or condo value ($) - Hispanic or Latino
Median house or condo value ($) - American Indian and Alaska Native
Median house or condo value ($) - Multirace
Median house or condo value ($) - Other Race
Median resident age
Resident age diversity
Median resident age - Males
Median resident age - Females
Median resident age - White
Median resident age - Black or African American
Median resident age - Asian
Median resident age - Hispanic or Latino
Median resident age - American Indian and Alaska Native
Median resident age - Multirace
Median resident age - Other Race
Median resident age - Males - White
Median resident age - Males - Black or African American
Median resident age - Males - Asian
Median resident age - Males - Hispanic or Latino
Median resident age - Males - American Indian and Alaska Native
Median resident age - Males - Multirace
Median resident age - Males - Other Race
Median resident age - Females - White
Median resident age - Females - Black or African American
Median resident age - Females - Asian
Median resident age - Females - Hispanic or Latino
Median resident age - Females - American Indian and Alaska Native
Median resident age - Females - Multirace
Median resident age - Females - Other Race
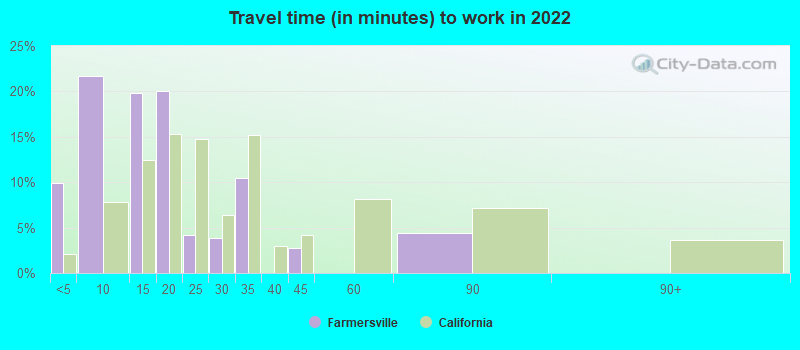
Commute - mean travel time to work (minutes)
Travel time to work - Less than 5 minutes (%)
Travel time to work - Less than 5 minutes (% change since 2000)
Travel time to work - 5 to 9 minutes (%)
Travel time to work - 5 to 9 minutes (% change since 2000)
Travel time to work - 10 to 19 minutes (%)
Travel time to work - 10 to 19 minutes (% change since 2000)
Travel time to work - 20 to 29 minutes (%)
Travel time to work - 20 to 29 minutes (% change since 2000)
Travel time to work - 30 to 39 minutes (%)
Travel time to work - 30 to 39 minutes (% change since 2000)
Travel time to work - 40 to 59 minutes (%)
Travel time to work - 40 to 59 minutes (% change since 2000)
Travel time to work - 60 to 89 minutes (%)
Travel time to work - 60 to 89 minutes (% change since 2000)
Travel time to work - 90 or more minutes (%)
Travel time to work - 90 or more minutes (% change since 2000)
Marital status - Never married (%)
Marital status - Now married (%)
Marital status - Separated (%)
Marital status - Widowed (%)
Marital status - Divorced (%)
Median family income ($)
Median family income (% change since 2000)
Median non-family income ($)
Median non-family income (% change since 2000)
Median per capita income ($)
Median per capita income (% change since 2000)
Median family income ($) - White
Median family income ($) - Black or African American
Median family income ($) - Asian
Median family income ($) - Hispanic or Latino
Median family income ($) - American Indian and Alaska Native
Median family income ($) - Multirace
Median family income ($) - Other Race
Median year house/condo built
Median year apartment built
Year house built - Built 2005 or later (%)
Year house built - Built 2000 to 2004 (%)
Year house built - Built 1990 to 1999 (%)
Year house built - Built 1980 to 1989 (%)
Year house built - Built 1970 to 1979 (%)
Year house built - Built 1960 to 1969 (%)
Year house built - Built 1950 to 1959 (%)
Year house built - Built 1940 to 1949 (%)
Year house built - Built 1939 or earlier (%)
Average household size
Household density (households per square mile)
Average household size - White
Average household size - Black or African American
Average household size - Asian
Average household size - Hispanic or Latino
Average household size - American Indian and Alaska Native
Average household size - Multirace
Average household size - Other Race
Occupied housing units (%)
Vacant housing units (%)
Owner occupied housing units (%)
Renter occupied housing units (%)
Vacancy status - For rent (%)
Vacancy status - For sale only (%)
Vacancy status - Rented or sold, not occupied (%)
Vacancy status - For seasonal, recreational, or occasional use (%)
Vacancy status - For migrant workers (%)
Vacancy status - Other vacant (%)
Residents with income below the poverty level (%)
Residents with income below 50% of the poverty level (%)
Children below poverty level (%)
Poor families by family type - Married-couple family (%)
Poor families by family type - Male, no wife present (%)
Poor families by family type - Female, no husband present (%)
Poverty status for native-born residents (%)
Poverty status for foreign-born residents (%)
Poverty among high school graduates not in families (%)
Poverty among people who did not graduate high school not in families (%)
Residents with income below the poverty level (%) - White
Residents with income below the poverty level (%) - Black or African American
Residents with income below the poverty level (%) - Asian
Residents with income below the poverty level (%) - Hispanic or Latino
Residents with income below the poverty level (%) - American Indian and Alaska Native
Residents with income below the poverty level (%) - Multirace
Residents with income below the poverty level (%) - Other Race
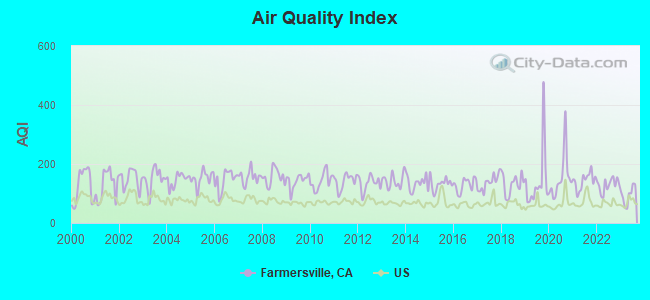
Air pollution - Air Quality Index (AQI)
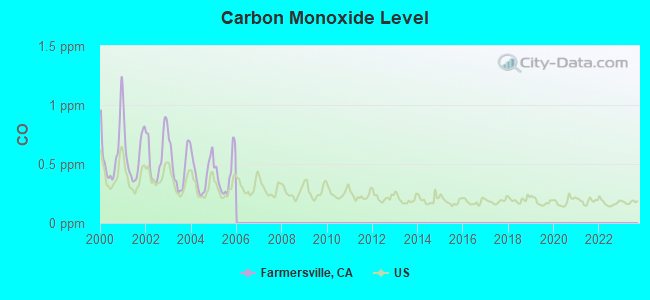
Air pollution - CO
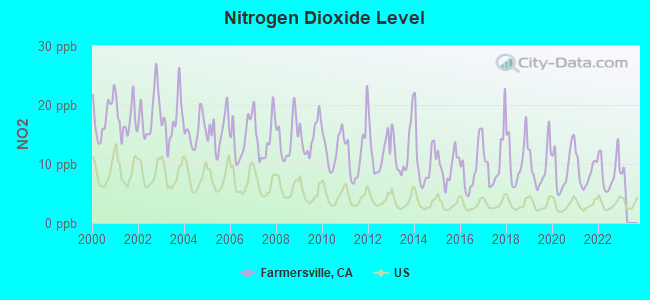
Air pollution - NO2
Air pollution - SO2
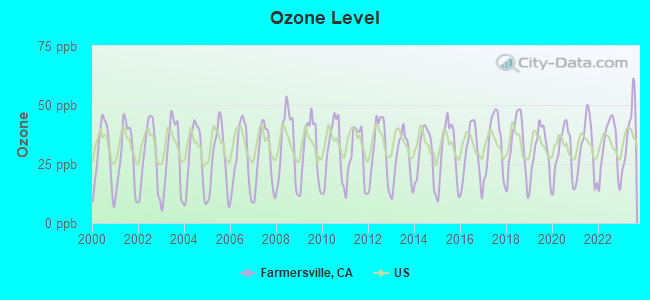
Air pollution - Ozone
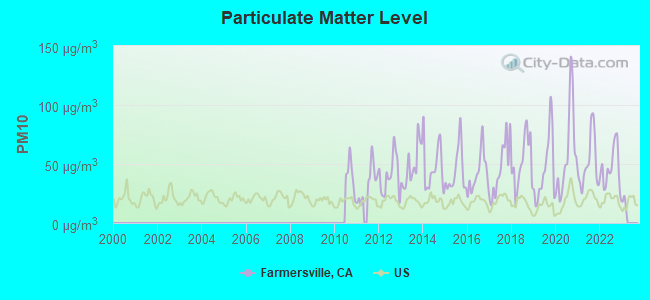
Air pollution - PM10
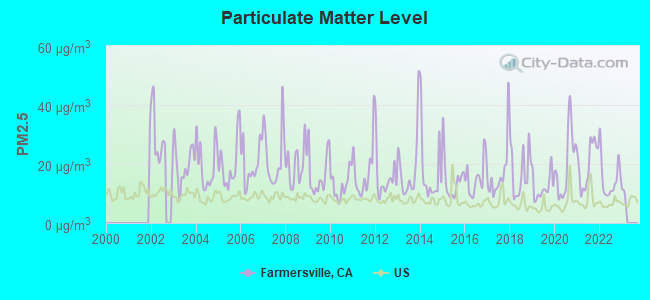
Air pollution - PM25
Air pollution - Pb
Crime - Murders per 100,000 population
Crime - Rapes per 100,000 population
Crime - Robberies per 100,000 population
Crime - Assaults per 100,000 population
Crime - Burglaries per 100,000 population
Crime - Thefts per 100,000 population
Crime - Auto thefts per 100,000 population
Crime - Arson per 100,000 population
Crime - City-data.com crime index
Crime - Violent crime index
Crime - Property crime index
Crime - Murders per 100,000 population (5 year average)
Crime - Rapes per 100,000 population (5 year average)
Crime - Robberies per 100,000 population (5 year average)
Crime - Assaults per 100,000 population (5 year average)
Crime - Burglaries per 100,000 population (5 year average)
Crime - Thefts per 100,000 population (5 year average)
Crime - Auto thefts per 100,000 population (5 year average)
Crime - Arson per 100,000 population (5 year average)
Crime - City-data.com crime index (5 year average)
Crime - Violent crime index (5 year average)
Crime - Property crime index (5 year average)
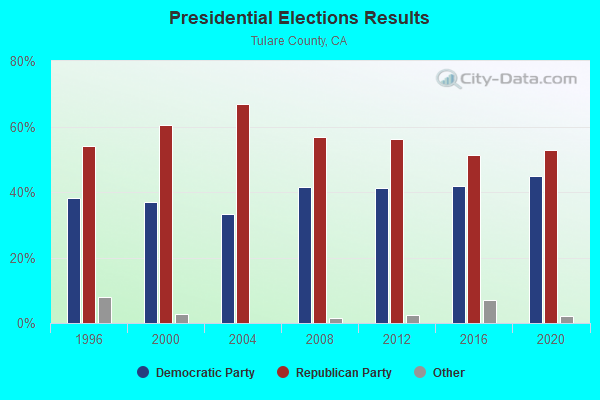
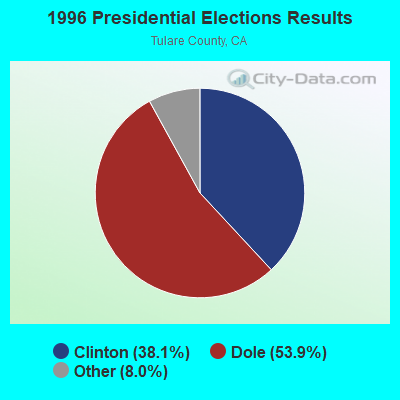
1996 Presidential Elections Results (%) - Democratic Party (Clinton)
1996 Presidential Elections Results (%) - Republican Party (Dole)
1996 Presidential Elections Results (%) - Other
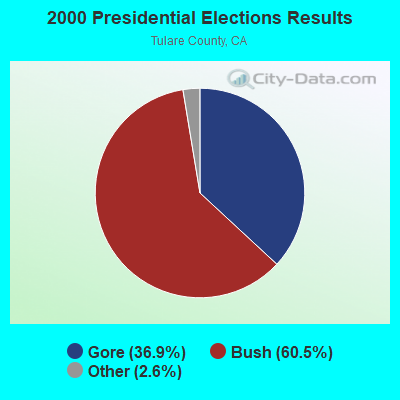
2000 Presidential Elections Results (%) - Democratic Party (Gore)
2000 Presidential Elections Results (%) - Republican Party (Bush)
2000 Presidential Elections Results (%) - Other
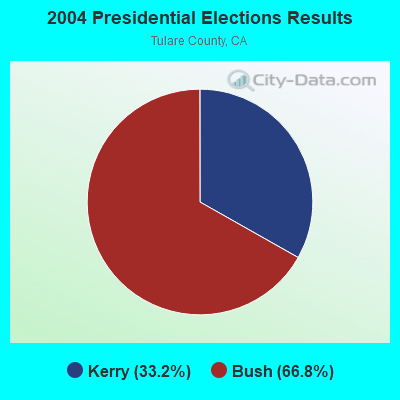
2004 Presidential Elections Results (%) - Democratic Party (Kerry)
2004 Presidential Elections Results (%) - Republican Party (Bush)
2004 Presidential Elections Results (%) - Other
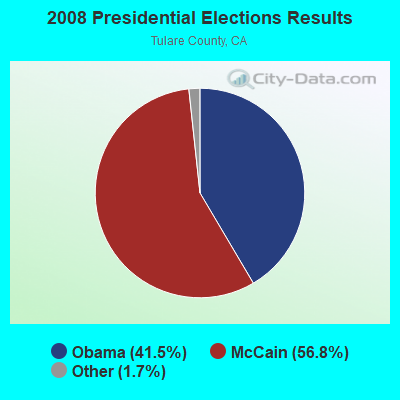
2008 Presidential Elections Results (%) - Democratic Party (Obama)
2008 Presidential Elections Results (%) - Republican Party (McCain)
2008 Presidential Elections Results (%) - Other
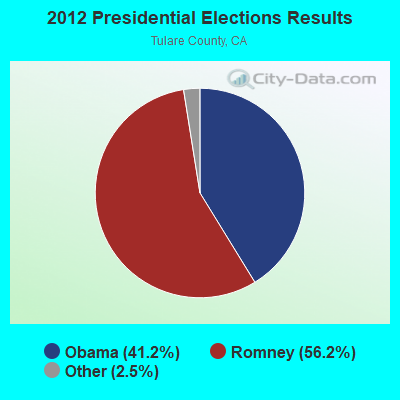
2012 Presidential Elections Results (%) - Democratic Party (Obama)
2012 Presidential Elections Results (%) - Republican Party (Romney)
2012 Presidential Elections Results (%) - Other
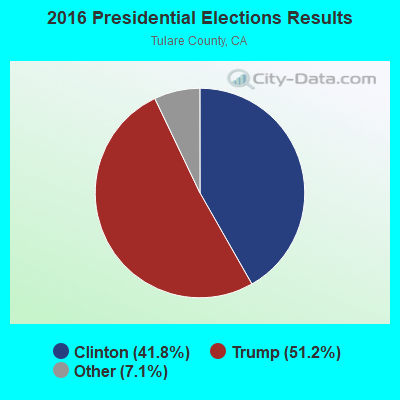
2016 Presidential Elections Results (%) - Democratic Party (Clinton)
2016 Presidential Elections Results (%) - Republican Party (Trump)
2016 Presidential Elections Results (%) - Other
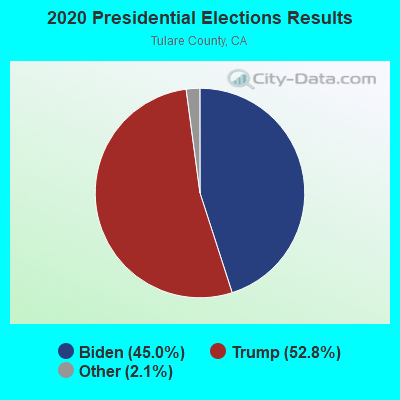
2020 Presidential Elections Results (%) - Democratic Party (Biden)
2020 Presidential Elections Results (%) - Republican Party (Trump)
2020 Presidential Elections Results (%) - Other
Ancestries Reported - Arab (%)
Ancestries Reported - Czech (%)
Ancestries Reported - Danish (%)
Ancestries Reported - Dutch (%)
Ancestries Reported - English (%)
Ancestries Reported - French (%)
Ancestries Reported - French Canadian (%)
Ancestries Reported - German (%)
Ancestries Reported - Greek (%)
Ancestries Reported - Hungarian (%)
Ancestries Reported - Irish (%)
Ancestries Reported - Italian (%)
Ancestries Reported - Lithuanian (%)
Ancestries Reported - Norwegian (%)
Ancestries Reported - Polish (%)
Ancestries Reported - Portuguese (%)
Ancestries Reported - Russian (%)
Ancestries Reported - Scotch-Irish (%)
Ancestries Reported - Scottish (%)
Ancestries Reported - Slovak (%)
Ancestries Reported - Subsaharan African (%)
Ancestries Reported - Swedish (%)
Ancestries Reported - Swiss (%)
Ancestries Reported - Ukrainian (%)
Ancestries Reported - United States (%)
Ancestries Reported - Welsh (%)
Ancestries Reported - West Indian (%)
Ancestries Reported - Other (%)
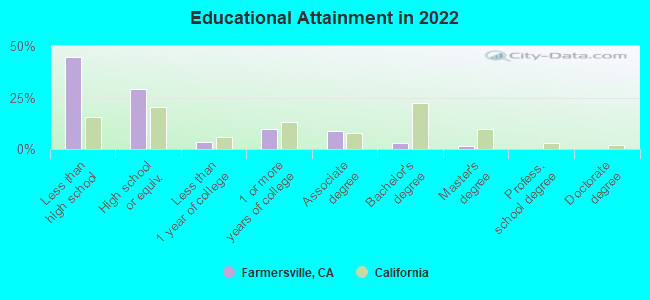
Educational Attainment - No schooling completed (%)
Educational Attainment - Less than high school (%)
Educational Attainment - High school or equivalent (%)
Educational Attainment - Less than 1 year of college (%)
Educational Attainment - 1 or more years of college (%)
Educational Attainment - Associate degree (%)
Educational Attainment - Bachelor's degree (%)
Educational Attainment - Master's degree (%)
Educational Attainment - Professional school degree (%)
Educational Attainment - Doctorate degree (%)
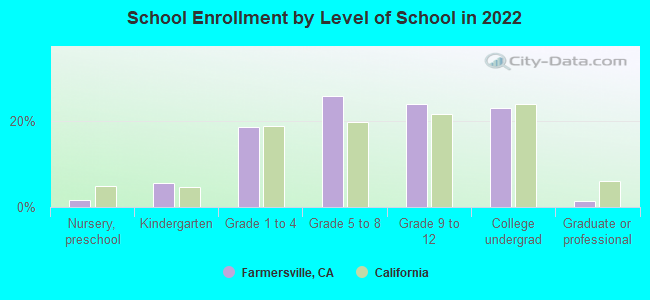
School Enrollment - Nursery, preschool (%)
School Enrollment - Kindergarten (%)
School Enrollment - Grade 1 to 4 (%)
School Enrollment - Grade 5 to 8 (%)
School Enrollment - Grade 9 to 12 (%)
School Enrollment - College undergrad (%)
School Enrollment - Graduate or professional (%)
School Enrollment - Not enrolled in school (%)
School enrollment - Public schools (%)
School enrollment - Private schools (%)
School enrollment - Not enrolled (%)
Median number of rooms in houses and condos
Median number of rooms in apartments
Housing units lacking complete plumbing facilities (%)
Housing units lacking complete kitchen facilities (%)
Density of houses
Urban houses (%)
Rural houses (%)
Households with people 60 years and over (%)
Households with people 65 years and over (%)
Households with people 75 years and over (%)
Households with one or more nonrelatives (%)
Households with no nonrelatives (%)
Population in households (%)
Family households (%)
Nonfamily households (%)
Population in families (%)
Family households with own children (%)
Median number of bedrooms in owner occupied houses
Mean number of bedrooms in owner occupied houses
Median number of bedrooms in renter occupied houses
Mean number of bedrooms in renter occupied houses
Median number of vehichles in owner occupied houses
Mean number of vehichles in owner occupied houses
Median number of vehichles in renter occupied houses
Mean number of vehichles in renter occupied houses
Mortgage status - with mortgage (%)
Mortgage status - with second mortgage (%)
Mortgage status - with home equity loan (%)
Mortgage status - with both second mortgage and home equity loan (%)
Mortgage status - without a mortgage (%)
Average family size
Average family size - White
Average family size - Black or African American
Average family size - Asian
Average family size - Hispanic or Latino
Average family size - American Indian and Alaska Native
Average family size - Multirace
Average family size - Other Race
Geographical mobility - Same house 1 year ago (%)
Geographical mobility - Moved within same county (%)
Geographical mobility - Moved from different county within same state (%)
Geographical mobility - Moved from different state (%)
Geographical mobility - Moved from abroad (%)
Place of birth - Born in state of residence (%)
Place of birth - Born in other state (%)
Place of birth - Native, outside of US (%)
Place of birth - Foreign born (%)
Housing units in structures - 1, detached (%)
Housing units in structures - 1, attached (%)
Housing units in structures - 2 (%)
Housing units in structures - 3 or 4 (%)
Housing units in structures - 5 to 9 (%)
Housing units in structures - 10 to 19 (%)
Housing units in structures - 20 to 49 (%)
Housing units in structures - 50 or more (%)
Housing units in structures - Mobile home (%)
Housing units in structures - Boat, RV, van, etc. (%)
House/condo owner moved in on average (years ago)
Renter moved in on average (years ago)
Year householder moved into unit - Moved in 1999 to March 2000 (%)
Year householder moved into unit - Moved in 1995 to 1998 (%)
Year householder moved into unit - Moved in 1990 to 1994 (%)
Year householder moved into unit - Moved in 1980 to 1989 (%)
Year householder moved into unit - Moved in 1970 to 1979 (%)
Year householder moved into unit - Moved in 1969 or earlier (%)
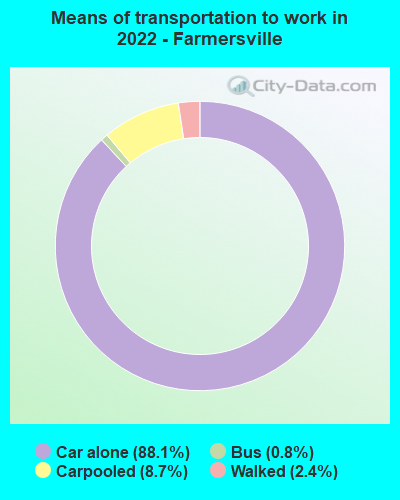
Means of transportation to work - Drove car alone (%)
Means of transportation to work - Carpooled (%)
Means of transportation to work - Public transportation (%)
Means of transportation to work - Bus or trolley bus (%)
Means of transportation to work - Streetcar or trolley car (%)
Means of transportation to work - Subway or elevated (%)
Means of transportation to work - Railroad (%)
Means of transportation to work - Ferryboat (%)
Means of transportation to work - Taxicab (%)
Means of transportation to work - Motorcycle (%)
Means of transportation to work - Bicycle (%)
Means of transportation to work - Walked (%)
Means of transportation to work - Other means (%)
Working at home (%)
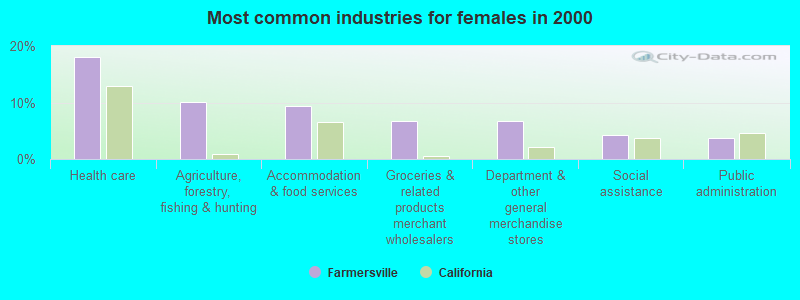
Industry diversity
Most Common Industries - Agriculture, forestry, fishing and hunting, and mining (%)
Most Common Industries - Agriculture, forestry, fishing and hunting (%)
Most Common Industries - Mining, quarrying, and oil and gas extraction (%)
Most Common Industries - Construction (%)
Most Common Industries - Manufacturing (%)
Most Common Industries - Wholesale trade (%)
Most Common Industries - Retail trade (%)
Most Common Industries - Transportation and warehousing, and utilities (%)
Most Common Industries - Transportation and warehousing (%)
Most Common Industries - Utilities (%)
Most Common Industries - Information (%)
Most Common Industries - Finance and insurance, and real estate and rental and leasing (%)
Most Common Industries - Finance and insurance (%)
Most Common Industries - Real estate and rental and leasing (%)
Most Common Industries - Professional, scientific, and management, and administrative and waste management services (%)
Most Common Industries - Professional, scientific, and technical services (%)
Most Common Industries - Management of companies and enterprises (%)
Most Common Industries - Administrative and support and waste management services (%)
Most Common Industries - Educational services, and health care and social assistance (%)
Most Common Industries - Educational services (%)
Most Common Industries - Health care and social assistance (%)
Most Common Industries - Arts, entertainment, and recreation, and accommodation and food services (%)
Most Common Industries - Arts, entertainment, and recreation (%)
Most Common Industries - Accommodation and food services (%)
Most Common Industries - Other services, except public administration (%)
Most Common Industries - Public administration (%)
Occupation diversity
Most Common Occupations - Management, business, science, and arts occupations (%)
Most Common Occupations - Management, business, and financial occupations (%)
Most Common Occupations - Management occupations (%)
Most Common Occupations - Business and financial operations occupations (%)
Most Common Occupations - Computer, engineering, and science occupations (%)
Most Common Occupations - Computer and mathematical occupations (%)
Most Common Occupations - Architecture and engineering occupations (%)
Most Common Occupations - Life, physical, and social science occupations (%)
Most Common Occupations - Education, legal, community service, arts, and media occupations (%)
Most Common Occupations - Community and social service occupations (%)
Most Common Occupations - Legal occupations (%)
Most Common Occupations - Education, training, and library occupations (%)
Most Common Occupations - Arts, design, entertainment, sports, and media occupations (%)
Most Common Occupations - Healthcare practitioners and technical occupations (%)
Most Common Occupations - Health diagnosing and treating practitioners and other technical occupations (%)
Most Common Occupations - Health technologists and technicians (%)
Most Common Occupations - Service occupations (%)
Most Common Occupations - Healthcare support occupations (%)
Most Common Occupations - Protective service occupations (%)
Most Common Occupations - Fire fighting and prevention, and other protective service workers including supervisors (%)
Most Common Occupations - Law enforcement workers including supervisors (%)
Most Common Occupations - Food preparation and serving related occupations (%)
Most Common Occupations - Building and grounds cleaning and maintenance occupations (%)
Most Common Occupations - Personal care and service occupations (%)
Most Common Occupations - Sales and office occupations (%)
Most Common Occupations - Sales and related occupations (%)
Most Common Occupations - Office and administrative support occupations (%)
Most Common Occupations - Natural resources, construction, and maintenance occupations (%)
Most Common Occupations - Farming, fishing, and forestry occupations (%)
Most Common Occupations - Construction and extraction occupations (%)
Most Common Occupations - Installation, maintenance, and repair occupations (%)
Most Common Occupations - Production, transportation, and material moving occupations (%)
Most Common Occupations - Production occupations (%)
Most Common Occupations - Transportation occupations (%)
Most Common Occupations - Material moving occupations (%)
People in Group quarters - Institutionalized population (%)
People in Group quarters - Correctional institutions (%)
People in Group quarters - Federal prisons and detention centers (%)
People in Group quarters - Halfway houses (%)
People in Group quarters - Local jails and other confinement facilities (including police lockups) (%)
People in Group quarters - Military disciplinary barracks (%)
People in Group quarters - State prisons (%)
People in Group quarters - Other types of correctional institutions (%)
People in Group quarters - Nursing homes (%)
People in Group quarters - Hospitals/wards, hospices, and schools for the handicapped (%)
People in Group quarters - Hospitals/wards and hospices for chronically ill (%)
People in Group quarters - Hospices or homes for chronically ill (%)
People in Group quarters - Military hospitals or wards for chronically ill (%)
People in Group quarters - Other hospitals or wards for chronically ill (%)
People in Group quarters - Hospitals or wards for drug/alcohol abuse (%)
People in Group quarters - Mental (Psychiatric) hospitals or wards (%)
People in Group quarters - Schools, hospitals, or wards for the mentally retarded (%)
People in Group quarters - Schools, hospitals, or wards for the physically handicapped (%)
People in Group quarters - Institutions for the deaf (%)
People in Group quarters - Institutions for the blind (%)
People in Group quarters - Orthopedic wards and institutions for the physically handicapped (%)
People in Group quarters - Wards in general hospitals for patients who have no usual home elsewhere (%)
People in Group quarters - Wards in military hospitals for patients who have no usual home elsewhere (%)
People in Group quarters - Juvenile institutions (%)
People in Group quarters - Long-term care (%)
People in Group quarters - Homes for abused, dependent, and neglected children (%)
People in Group quarters - Residential treatment centers for emotionally disturbed children (%)
People in Group quarters - Training schools for juvenile delinquents (%)
People in Group quarters - Short-term care, detention or diagnostic centers for delinquent children (%)
People in Group quarters - Type of juvenile institution unknown (%)
People in Group quarters - Noninstitutionalized population (%)
People in Group quarters - College dormitories (includes college quarters off campus) (%)
People in Group quarters - Military quarters (%)
People in Group quarters - On base (%)
People in Group quarters - Barracks, unaccompanied personnel housing (UPH), (Enlisted/Officer), ;and similar group living quarters for military personnel (%)
People in Group quarters - Transient quarters for temporary residents (%)
People in Group quarters - Military ships (%)
People in Group quarters - Group homes (%)
People in Group quarters - Homes or halfway houses for drug/alcohol abuse (%)
People in Group quarters - Homes for the mentally ill (%)
People in Group quarters - Homes for the mentally retarded (%)
People in Group quarters - Homes for the physically handicapped (%)
People in Group quarters - Other group homes (%)
People in Group quarters - Religious group quarters (%)
People in Group quarters - Dormitories (%)
People in Group quarters - Agriculture workers' dormitories on farms (%)
People in Group quarters - Job Corps and vocational training facilities (%)
People in Group quarters - Other workers' dormitories (%)
People in Group quarters - Crews of maritime vessels (%)
People in Group quarters - Other nonhousehold living situations (%)
People in Group quarters - Other noninstitutional group quarters (%)
Residents speaking English at home (%)
Residents speaking English at home - Born in the United States (%)
Residents speaking English at home - Native, born elsewhere (%)
Residents speaking English at home - Foreign born (%)
Residents speaking Spanish at home (%)
Residents speaking Spanish at home - Born in the United States (%)
Residents speaking Spanish at home - Native, born elsewhere (%)
Residents speaking Spanish at home - Foreign born (%)
Residents speaking other language at home (%)
Residents speaking other language at home - Born in the United States (%)
Residents speaking other language at home - Native, born elsewhere (%)
Residents speaking other language at home - Foreign born (%)
Class of Workers - Employee of private company (%)
Class of Workers - Self-employed in own incorporated business (%)
Class of Workers - Private not-for-profit wage and salary workers (%)
Class of Workers - Local government workers (%)
Class of Workers - State government workers (%)
Class of Workers - Federal government workers (%)
Class of Workers - Self-employed workers in own not incorporated business and Unpaid family workers (%)
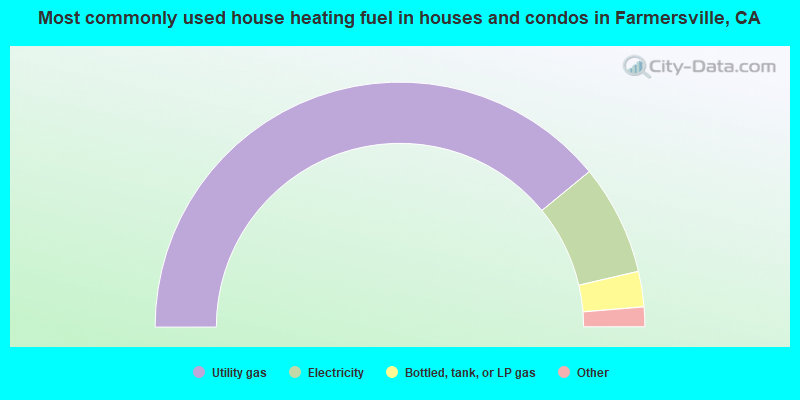
House heating fuel used in houses and condos - Utility gas (%)
House heating fuel used in houses and condos - Bottled, tank, or LP gas (%)
House heating fuel used in houses and condos - Electricity (%)
House heating fuel used in houses and condos - Fuel oil, kerosene, etc. (%)
House heating fuel used in houses and condos - Coal or coke (%)
House heating fuel used in houses and condos - Wood (%)
House heating fuel used in houses and condos - Solar energy (%)
House heating fuel used in houses and condos - Other fuel (%)
House heating fuel used in houses and condos - No fuel used (%)
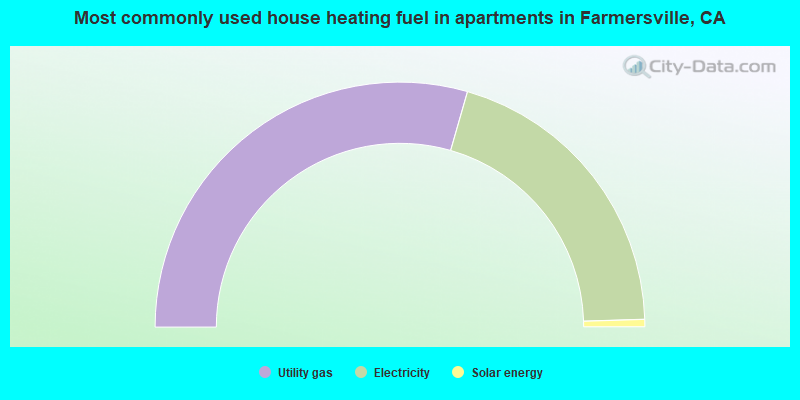
House heating fuel used in apartments - Utility gas (%)
House heating fuel used in apartments - Bottled, tank, or LP gas (%)
House heating fuel used in apartments - Electricity (%)
House heating fuel used in apartments - Fuel oil, kerosene, etc. (%)
House heating fuel used in apartments - Coal or coke (%)
House heating fuel used in apartments - Wood (%)
House heating fuel used in apartments - Solar energy (%)
House heating fuel used in apartments - Other fuel (%)
House heating fuel used in apartments - No fuel used (%)
Armed forces status - In Armed Forces (%)
Armed forces status - Civilian (%)
Armed forces status - Civilian - Veteran (%)
Armed forces status - Civilian - Nonveteran (%)
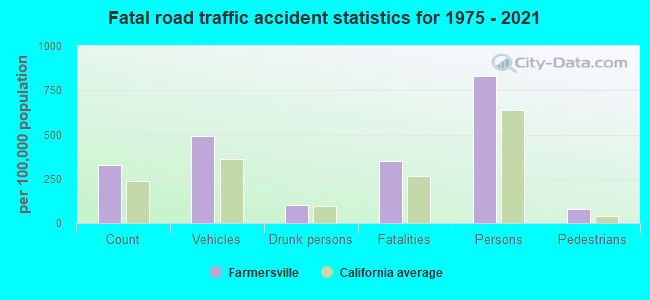
Fatal accidents locations in years 2005-2021
Fatal accidents locations in 2005
Fatal accidents locations in 2006
Fatal accidents locations in 2007
Fatal accidents locations in 2008
Fatal accidents locations in 2009
Fatal accidents locations in 2010
Fatal accidents locations in 2011
Fatal accidents locations in 2012
Fatal accidents locations in 2013
Fatal accidents locations in 2014
Fatal accidents locations in 2015
Fatal accidents locations in 2016
Fatal accidents locations in 2017
Fatal accidents locations in 2018
Fatal accidents locations in 2019
Fatal accidents locations in 2020
Fatal accidents locations in 2021
Alcohol use - People drinking some alcohol every month (%)
Alcohol use - People not drinking at all (%)
Alcohol use - Average days/month drinking alcohol
Alcohol use - Average drinks/week
Alcohol use - Average days/year people drink much
Audiometry - Average condition of hearing (%)
Audiometry - People that can hear a whisper from across a quiet room (%)
Audiometry - People that can hear normal voice from across a quiet room (%)
Audiometry - Ears ringing, roaring, buzzing (%)
Audiometry - Had a job exposure to loud noise (%)
Audiometry - Had off-work exposure to loud noise (%)
Blood Pressure & Cholesterol - Has high blood pressure (%)
Blood Pressure & Cholesterol - Checking blood pressure at home (%)
Blood Pressure & Cholesterol - Frequently checking blood cholesterol (%)
Blood Pressure & Cholesterol - Has high cholesterol level (%)
Consumer Behavior - Money monthly spent on food at supermarket/grocery store
Consumer Behavior - Money monthly spent on food at other stores
Consumer Behavior - Money monthly spent on eating out
Consumer Behavior - Money monthly spent on carryout/delivered foods
Consumer Behavior - Income spent on food at supermarket/grocery store (%)
Consumer Behavior - Income spent on food at other stores (%)
Consumer Behavior - Income spent on eating out (%)
Consumer Behavior - Income spent on carryout/delivered foods (%)
Current Health Status - General health condition (%)
Current Health Status - Blood donors (%)
Current Health Status - Has blood ever tested for HIV virus (%)
Current Health Status - Left-handed people (%)
Dermatology - People using sunscreen (%)
Diabetes - Diabetics (%)
Diabetes - Had a blood test for high blood sugar (%)
Diabetes - People taking insulin (%)
Diet Behavior & Nutrition - Diet health (%)
Diet Behavior & Nutrition - Milk product consumption (# of products/month)
Diet Behavior & Nutrition - Meals not home prepared (#/week)
Diet Behavior & Nutrition - Meals from fast food or pizza place (#/week)
Diet Behavior & Nutrition - Ready-to-eat foods (#/month)
Diet Behavior & Nutrition - Frozen meals/pizza (#/month)
Drug Use - People that ever used marijuana or hashish (%)
Drug Use - Ever used hard drugs (%)
Drug Use - Ever used any form of cocaine (%)
Drug Use - Ever used heroin (%)
Drug Use - Ever used methamphetamine (%)
Health Insurance - People covered by health insurance (%)
Kidney Conditions-Urology - Avg. # of times urinating at night
Medical Conditions - People with asthma (%)
Medical Conditions - People with anemia (%)
Medical Conditions - People with psoriasis (%)
Medical Conditions - People with overweight (%)
Medical Conditions - Elderly people having difficulties in thinking or remembering (%)
Medical Conditions - People who ever received blood transfusion (%)
Medical Conditions - People having trouble seeing even with glass/contacts (%)
Medical Conditions - People with arthritis (%)
Medical Conditions - People with gout (%)
Medical Conditions - People with congestive heart failure (%)
Medical Conditions - People with coronary heart disease (%)
Medical Conditions - People with angina pectoris (%)
Medical Conditions - People who ever had heart attack (%)
Medical Conditions - People who ever had stroke (%)
Medical Conditions - People with emphysema (%)
Medical Conditions - People with thyroid problem (%)
Medical Conditions - People with chronic bronchitis (%)
Medical Conditions - People with any liver condition (%)
Medical Conditions - People who ever had cancer or malignancy (%)
Mental Health - People who have little interest in doing things (%)
Mental Health - People feeling down, depressed, or hopeless (%)
Mental Health - People who have trouble sleeping or sleeping too much (%)
Mental Health - People feeling tired or having little energy (%)
Mental Health - People with poor appetite or overeating (%)
Mental Health - People feeling bad about themself (%)
Mental Health - People who have trouble concentrating on things (%)
Mental Health - People moving or speaking slowly or too fast (%)
Mental Health - People having thoughts they would be better off dead (%)
Oral Health - Average years since last visit a dentist
Oral Health - People embarrassed because of mouth (%)
Oral Health - People with gum disease (%)
Oral Health - General health of teeth and gums (%)
Oral Health - Average days a week using dental floss/device
Oral Health - Average days a week using mouthwash for dental problem
Oral Health - Average number of teeth
Pesticide Use - Households using pesticides to control insects (%)
Pesticide Use - Households using pesticides to kill weeds (%)
Physical Activity - People doing vigorous-intensity work activities (%)
Physical Activity - People doing moderate-intensity work activities (%)
Physical Activity - People walking or bicycling (%)
Physical Activity - People doing vigorous-intensity recreational activities (%)
Physical Activity - People doing moderate-intensity recreational activities (%)
Physical Activity - Average hours a day doing sedentary activities
Physical Activity - Average hours a day watching TV or videos
Physical Activity - Average hours a day using computer
Physical Functioning - People having limitations keeping them from working (%)
Physical Functioning - People limited in amount of work they can do (%)
Physical Functioning - People that need special equipment to walk (%)
Physical Functioning - People experiencing confusion/memory problems (%)
Physical Functioning - People requiring special healthcare equipment (%)
Prescription Medications - Average number of prescription medicines taking
Preventive Aspirin Use - Adults 40+ taking low-dose aspirin (%)
Reproductive Health - Vaginal deliveries (%)
Reproductive Health - Cesarean deliveries (%)
Reproductive Health - Deliveries resulted in a live birth (%)
Reproductive Health - Pregnancies resulted in a delivery (%)
Reproductive Health - Women breastfeeding newborns (%)
Reproductive Health - Women that had a hysterectomy (%)
Reproductive Health - Women that had both ovaries removed (%)
Reproductive Health - Women that have ever taken birth control pills (%)
Reproductive Health - Women taking birth control pills (%)
Reproductive Health - Women that have ever used Depo-Provera or injectables (%)
Reproductive Health - Women that have ever used female hormones (%)
Sexual Behavior - People 18+ that ever had sex (vaginal, anal, or oral) (%)
Sexual Behavior - Males 18+ that ever had vaginal sex with a woman (%)
Sexual Behavior - Males 18+ that ever performed oral sex on a woman (%)
Sexual Behavior - Males 18+ that ever had anal sex with a woman (%)
Sexual Behavior - Males 18+ that ever had any sex with a man (%)
Sexual Behavior - Females 18+ that ever had vaginal sex with a man (%)
Sexual Behavior - Females 18+ that ever performed oral sex on a man (%)
Sexual Behavior - Females 18+ that ever had anal sex with a man (%)
Sexual Behavior - Females 18+ that ever had any kind of sex with a woman (%)
Sexual Behavior - Average age people first had sex
Sexual Behavior - Average number of female sex partners in lifetime (males 18+)
Sexual Behavior - Average number of female vaginal sex partners in lifetime (males 18+)
Sexual Behavior - Average age people first performed oral sex on a woman (18+)
Sexual Behavior - Average number of woman performed oral sex on in lifetime (18+)
Sexual Behavior - Average number of male sex partners in lifetime (males 18+)
Sexual Behavior - Average number of male anal sex partners in lifetime (males 18+)
Sexual Behavior - Average age people first performed oral sex on a man (18+)
Sexual Behavior - Average number of male oral sex partners in lifetime (18+)
Sexual Behavior - People using protection when performing oral sex (%)
Sexual Behavior - Average number of times people have vaginal or anal sex a year
Sexual Behavior - People having sex without condom (%)
Sexual Behavior - Average number of male sex partners in lifetime (females 18+)
Sexual Behavior - Average number of male vaginal sex partners in lifetime (females 18+)
Sexual Behavior - Average number of female sex partners in lifetime (females 18+)
Sexual Behavior - Circumcised males 18+ (%)
Sleep Disorders - Average hours sleeping at night
Sleep Disorders - People that has trouble sleeping (%)
Smoking-Cigarette Use - People smoking cigarettes (%)
Taste & Smell - People 40+ having problems with smell (%)
Taste & Smell - People 40+ having problems with taste (%)
Taste & Smell - People 40+ that ever had wisdom teeth removed (%)
Taste & Smell - People 40+ that ever had tonsils teeth removed (%)
Taste & Smell - People 40+ that ever had a loss of consciousness because of a head injury (%)
Taste & Smell - People 40+ that ever had a broken nose or other serious injury to face or skull (%)
Taste & Smell - People 40+ that ever had two or more sinus infections (%)
Weight - Average height (inches)
Weight - Average weight (pounds)
Weight - Average BMI
Weight - People that are obese (%)
Weight - People that ever were obese (%)
Weight - People trying to lose weight (%)
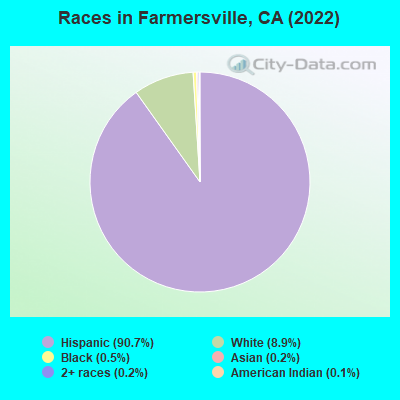
9,503 90.7% Hispanic 934 8.9% White alone 56 0.5% Black alone 26 0.2% Asian alone 24 0.2% Two or more races 15 0.1% American Indian alone 8 0.08% Native Hawaiian and Other
Officers per 1,000 residents here:
1.66California average:
2.30
Latest news from Farmersville, CA collected exclusively by city-data.com from local newspapers, TV, and radio stations
Ancestries: Irish (1.5%).
Current Local Time:
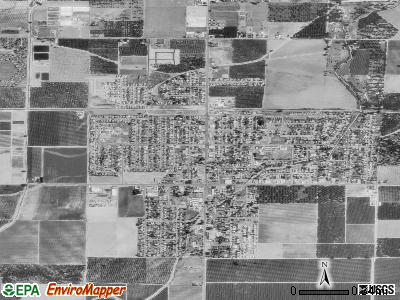
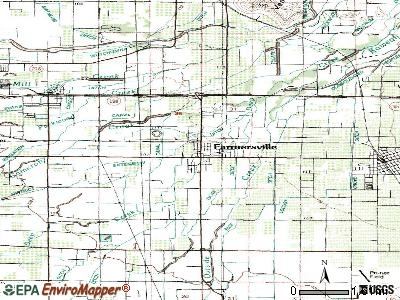
Land area: 1.88 square miles.
Population density: 5,501 people per square mile (average).
2,754 residents are foreign born (26.0% Latin America ).
This city:
26.3%California:
26.5%
Median real estate property taxes paid for housing units with mortgages in 2022: $1,323 (0.5%)Median real estate property taxes paid for housing units with no mortgage in 2022: $1,311 (0.6%)
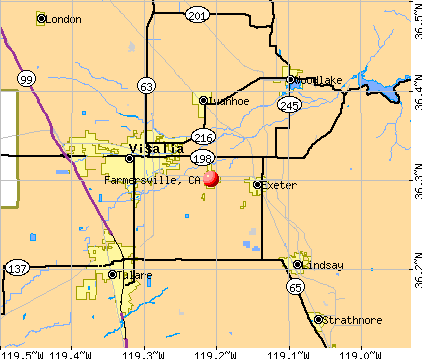
Nearest city with pop. 50,000+: Visalia, CA
Nearest city with pop. 200,000+: Fresno, CA
Nearest city with pop. 1,000,000+: Los Angeles, CA
Nearest cities:
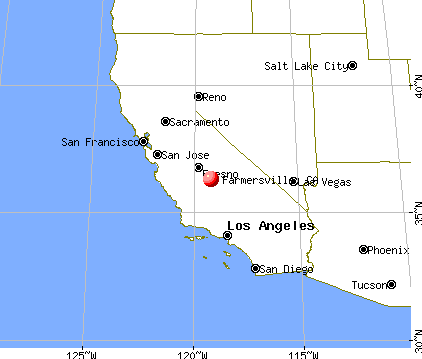
Latitude: 36.30 N, Longitude: 119.21 W
Daytime population change due to commuting: -2,944 (-28.1%)Workers who live and work in this city: 488 (11.4%)
Area code commonly used in this area: 559
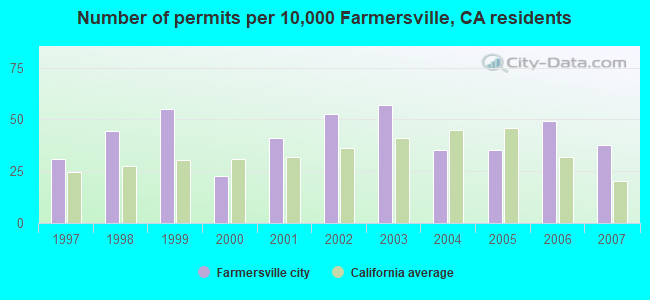
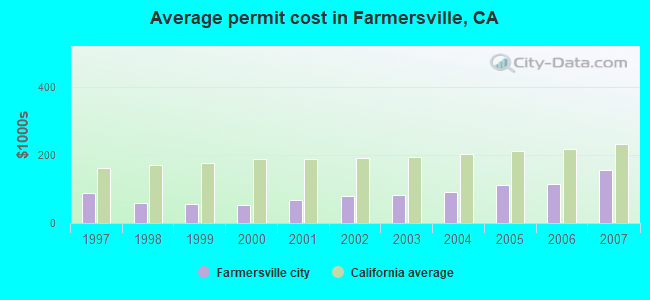
Single-family new house construction building permits:
2007: 33 buildings , average cost: $156,6002006: 43 buildings , average cost: $114,2002005: 31 buildings , average cost: $110,6002004: 31 buildings , average cost: $91,8002003: 50 buildings , average cost: $83,0002002: 46 buildings , average cost: $79,3002001: 36 buildings , average cost: $68,5002000: 20 buildings , average cost: $53,6001999: 48 buildings , average cost: $55,0001998: 39 buildings , average cost: $58,9001997: 27 buildings , average cost: $88,100Unemployment in December 2023: Here:
11.2%California:
5.1%
Population change in the 1990s: +2,337 (+36.5%).
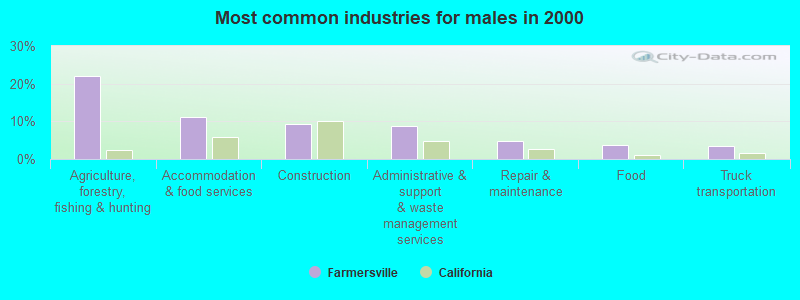
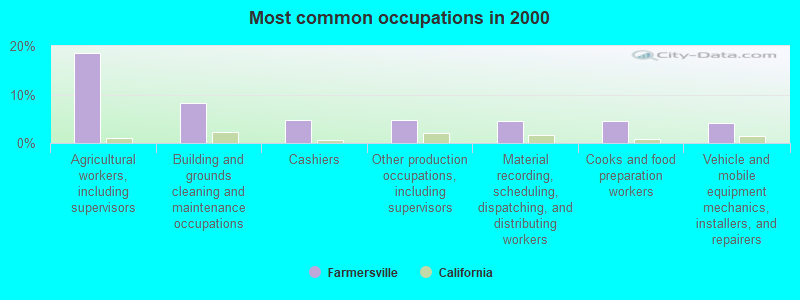
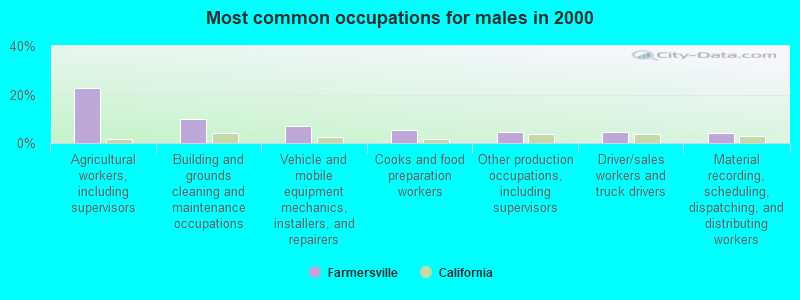
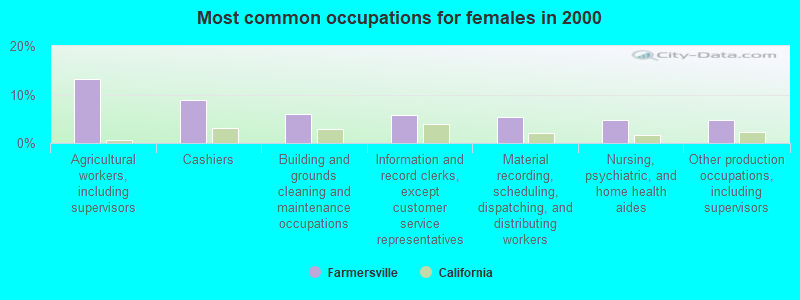
Most common occupations in Farmersville, CA (%)
Both Males Females
Agricultural workers, including supervisors (18.6%)
Building and grounds cleaning and maintenance occupations (8.3%)
Cashiers (4.8%)
Other production occupations, including supervisors (4.7%)
Material recording, scheduling, dispatching, and distributing workers (4.6%)
Cooks and food preparation workers (4.5%)
Vehicle and mobile equipment mechanics, installers, and repairers (4.1%)
Agricultural workers, including supervisors (22.6%)
Building and grounds cleaning and maintenance occupations (10.1%)
Vehicle and mobile equipment mechanics, installers, and repairers (7.1%)
Cooks and food preparation workers (5.5%)
Other production occupations, including supervisors (4.7%)
Driver/sales workers and truck drivers (4.3%)
Material recording, scheduling, dispatching, and distributing workers (4.0%)
Agricultural workers, including supervisors (13.2%)
Cashiers (8.8%)
Building and grounds cleaning and maintenance occupations (6.0%)
Information and record clerks, except customer service representatives (5.9%)
Material recording, scheduling, dispatching, and distributing workers (5.5%)
Nursing, psychiatric, and home health aides (4.8%)
Other production occupations, including supervisors (4.7%)
Earthquake activity:
Farmersville-area historical earthquake activity is significantly above California state average. It is 8521% greater than the overall U.S. average. On 7/21/1952 at 11:52:14, a magnitude 7.7 (7.7 UK, Class: Major, Intensity: VIII - XII) earthquake occurred 90.8 miles away from Farmersville center, causing $50,000,000 total damage On 11/4/1927 at 13:51:53, a magnitude 7.5 (7.5 UK) earthquake occurred 140.4 miles away from Farmersville center On 4/18/1906 at 13:12:21, a magnitude 7.9 (7.9 UK) earthquake occurred 239.8 miles away from Farmersville center, causing $524,000,000 total damage On 6/28/1992 at 11:57:34, a magnitude 7.6 (6.2 MB, 7.6 MS, 7.3 MW, Depth: 0.7 mi) earthquake occurred 210.4 miles away from Farmersville center, causing 3 deaths ( 1 shaking deaths, 2 other deaths) and 400 injuries, causing $100,000,000 total damage and $40,000,000 insured lossesOn 10/16/1999 at 09:46:44, a magnitude 7.4 (6.3 MB, 7.4 MS, 7.2 MW, 7.3 ML) earthquake occurred 199.2 miles away from Farmersville center On 12/21/1932 at 06:10:09, a magnitude 7.2 (7.2 UK) earthquake occurred 164.8 miles away from Farmersville center Magnitude types: body-wave magnitude (MB), local magnitude (ML), surface-wave magnitude (MS), moment magnitude (MW) Natural disasters: The number of natural disasters in Tulare County (14) is near the US average (15).Major Disasters (Presidential) Declared: 10Emergencies Declared: 2Floods: 8, Storms: 5, Winter Storms: 4, Freezes: 2, Landslides: 2, Drought: 1, Fire: 1, Hurricane: 1, Mudslide: 1, Other: 1 (Note: some incidents may be assigned to more than one category). Hospitals and medical centers in Farmersville: SIERRA VISTA RESIDENTIAL CARE (782 NORTH SHASTA) Other hospitals and medical centers near Farmersville: DAVITA-EXETER DIALYSIS (Dialysis Facility, about 3 miles away; EXETER, CA)
WECARE RESIDENTIAL CARE-MAPLE (Hospital, about 5 miles away; VISALIA, CA)
MEMORIAL HOSPITAL AT EXETER (Hospital, about 5 miles away; EXETER, CA)
REDWOOD SPRINGS HEALTHCARE CENTER (Nursing Home, about 5 miles away; VISALIA, CA)
VISALIA COMMUNITY HOSPITAL (Hospital, about 5 miles away; VISALIA, CA)
KAWEAH DELTA SKILLED NURSING CENTER (Nursing Home, about 5 miles away; VISALIA, CA)
DELTA CONV HOSP (Nursing Home, about 5 miles away; VISALIA, CA)
Colleges/universities with over 2000 students nearest to Farmersville:
College of the Sequoias (about 7 miles; Visalia, CA ; Full-time enrollment: 6,982)
San Joaquin Valley College-Visalia (about 11 miles; Visalia, CA ; FT enrollment: 2,386)
Porterville College (about 21 miles; Porterville, CA ; FT enrollment: 2,560)
Reedley College (about 26 miles; Reedley, CA ; FT enrollment: 8,144)
West Hills College-Lemoore (about 35 miles; Lemoore, CA ; FT enrollment: 2,314)
Fresno Pacific University (about 42 miles; Fresno, CA ; FT enrollment: 3,083)
Fresno City College (about 46 miles; Fresno, CA ; FT enrollment: 12,994)
Public high schools in Farmersville:
Public elementary/middle schools in Farmersville:
See full list of schools located in Farmersville Birthplace of: Russ Taff - Musisian, Jose Cuevas (soccer) - Professional soccer player.
Tulare County has a predicted average indoor radon screening level between 2 and 4 pCi/L (pico curies per liter) - Moderate Potential Average household size: This city:
4.1 peopleCalifornia:
2.9 people
Percentage of family households: This city:
87.2%Whole state:
68.7%
Percentage of households with unmarried partners: This city:
10.3%Whole state:
7.2%
Likely homosexual households (counted as self-reported same-sex unmarried-partner households)
Lesbian couples: 0.3% of all households Gay men: 0.1% of all households
13 people in other group homes in 2000people in nursing homes in 2000
Banks with branches in Farmersville (2011 data):
Bank of the Sierra: Farmersville Branch at 400 West Visalia Road, branch established on 2010/03/23. Info updated 2006/11/03: Bank assets: $1,332.3 mil, Deposits: $1,091.7 mil, headquarters in Porterville, CA, positive income , Commercial Lending Specialization, 26 total offices , Holding Company: Sierra Bancorp
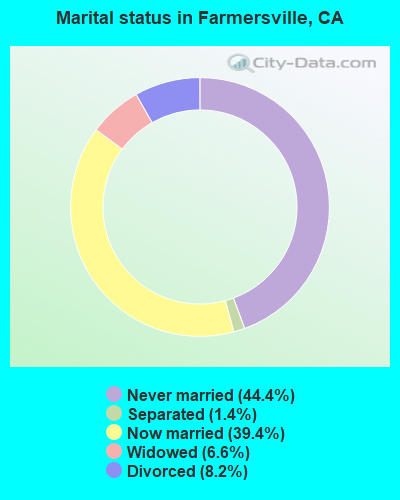
For population 15 years and over in Farmersville:
Never married: 44.4%Now married: 39.4%Separated: 1.4%Widowed: 6.6%Divorced: 8.2% For population 25 years and over in Farmersville:
High school or higher: 54.0%Bachelor's degree or higher: 4.5%Graduate or professional degree: 1.6%Unemployed: 16.0%Mean travel time to work (commute): 17.6 minutes
Education Gini index (Inequality in education) Here:
29.5California average:
15.5
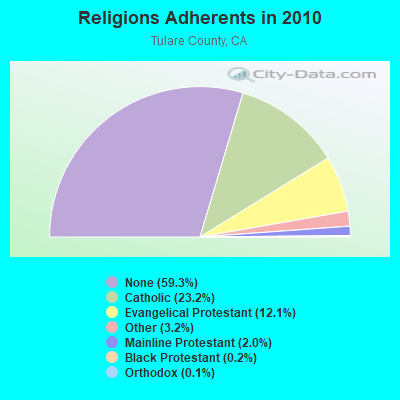
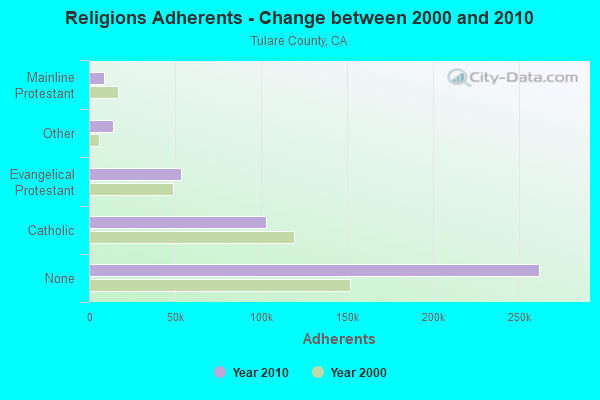
Religion statistics for Farmersville, CA (based on Tulare County data)
Religion Adherents Congregations Catholic 102,772 26 Evangelical Protestant 53,285 300 Other 13,983 37 Mainline Protestant 8,690 37 Black Protestant 757 5 Orthodox 650 2 None 262,042 -
Source: Clifford Grammich, Kirk Hadaway, Richard Houseal, Dale E.Jones, Alexei Krindatch, Richie Stanley and Richard H.Taylor. 2012. 2010 U.S.Religion Census: Religious Congregations & Membership Study. Association of Statisticians of American Religious Bodies. Jones, Dale E., et al. 2002. Congregations and Membership in the United States 2000. Nashville, TN: Glenmary Research Center. Graphs represent county-level data
Food Environment Statistics: Number of grocery stores : 119This county :
2.84 / 10,000 pop.California :
2.14 / 10,000 pop.
Number of supercenters and club stores : 3This county :
0.07 / 10,000 pop.California :
0.04 / 10,000 pop.
Number of convenience stores (no gas) : 32Here :
0.76 / 10,000 pop.California :
0.62 / 10,000 pop.
Number of convenience stores (with gas) : 89Here :
2.12 / 10,000 pop.California :
1.49 / 10,000 pop.
Number of full-service restaurants : 215Here :
5.13 / 10,000 pop.California :
7.42 / 10,000 pop.
Adult diabetes rate : Tulare County :
7.3%California :
7.3%
Adult obesity rate : This county :
28.2%California :
21.3%
Low-income preschool obesity rate : Tulare County :
16.9%State :
17.9%
Health and Nutrition: Healthy diet rate : Farmersville:
45.2%California:
49.4%
Average overall health of teeth and gums : Farmersville:
43.3%California:
48.0%
People feeling badly about themselves : Here:
23.6%California:
20.2%
People not drinking alcohol at all : This city:
10.9%California:
11.2%
Average hours sleeping at night : This city:
6.8California:
6.8
General health condition : Farmersville:
52.6%State:
56.4%
Average condition of hearing : This city:
80.6%California:
80.9%
More about Health and Nutrition of Farmersville, CA Residents
Local government employment and payroll (March 2022)
Function
Full-time employees
Monthly full-time payroll
Average yearly full-time wage
Part-time employees
Monthly part-time payroll
Police Protection - Officers
17 $120,462 $85,032 0 $0 Financial Administration
4 $32,273 $96,819 0 $0 Other Government Administration
3 $50,375 $201,500 4 $1,200 Firefighters
3 $15,105 $60,420 0 $0 Police - Other
2 $10,111 $60,666 0 $0 Water Supply
2 $9,573 $57,438 0 $0 Solid Waste Management
2 $19,147 $114,882 0 $0 Parks and Recreation
2 $17,698 $106,188 0 $0 Streets and Highways
1 $7,259 $87,108 0 $0 Sewerage
1 $8,995 $107,940 0 $0
Totals for Government
37 $290,999 $94,378 4 $1,200
Farmersville government finances - Expenditure in 2017 (per resident):
Construction - General - Other: $452,000 ($43.78)
Regular Highways: $408,000 ($39.52)Police Protection: $129,000 ($12.50)Housing and Community Development: $66,000 ($6.39)Current Operations - Police Protection: $1,921,000 ($186.07)
Parks and Recreation: $1,136,000 ($110.03)Regular Highways: $1,090,000 ($105.58)Sewerage: $785,000 ($76.04)Solid Waste Management: $727,000 ($70.42)Water Utilities: $694,000 ($67.22)Local Fire Protection: $574,000 ($55.60)Central Staff Services: $447,000 ($43.30)Health - Other: $88,000 ($8.52)Housing and Community Development: $34,000 ($3.29)General - Interest on Debt: $50,000 ($4.84)
Other Capital Outlay - Housing and Community Development: $98,000 ($9.49)
Local Fire Protection: $53,000 ($5.13)Water Utilities: $25,000 ($2.42)Parks and Recreation: $11,000 ($1.07)Sewerage: $9,000 ($0.87)
Farmersville government finances - Revenue in 2017 (per resident):
Charges - Sewerage: $1,881,000 ($182.20)
Solid Waste Management: $786,000 ($76.13)Other: $113,000 ($10.95)Parks and Recreation: $2,000 ($0.19)Federal Intergovernmental - Other: $928,000 ($89.89)
Housing and Community Development: $34,000 ($3.29)Miscellaneous - Special Assessments: $247,000 ($23.92)
Rents: $177,000 ($17.14)General Revenue - Other: $70,000 ($6.78)Fines and Forfeits: $35,000 ($3.39)Interest Earnings: $14,000 ($1.36)Revenue - Water Utilities: $623,000 ($60.34)
State Intergovernmental - Other: $1,419,000 ($137.45)
Highways: $214,000 ($20.73)General Local Government Support: $2,000 ($0.19)Tax - General Sales and Gross Receipts: $3,333,000 ($322.84)
Property: $1,259,000 ($121.95)Other: $127,000 ($12.30)Public Utilities Sales: $118,000 ($11.43)Occupation and Business License - Other: $70,000 ($6.78)Documentary and Stock Transfer: $10,000 ($0.97)Other License: $7,000 ($0.68)
Farmersville government finances - Debt in 2017 (per resident):
Long Term Debt - Beginning Outstanding - Unspecified Public Purpose: $1,257,000 ($121.76)
Outstanding Unspecified Public Purpose: $1,257,000 ($121.76)
Farmersville government finances - Cash and Securities in 2017 (per resident):
Bond Funds - Cash and Securities: $127,000 ($12.30)
Other Funds - Cash and Securities: $15,195,000 ($1471.81)
3.84% of this county's 2021 resident taxpayers lived in other counties in 2020 ($53,510 average adjusted gross income )
Here:
3.84%California average:
5.19%
0.01% of residents moved from foreign countries ($107 average AGI )Tulare County:
0.01%California average:
0.03%
Top counties from which taxpayers relocated into this county between 2020 and 2021:
3.70% of this county's 2020 resident taxpayers moved to other counties in 2021 ($58,158 average adjusted gross income )
Here:
3.70%California average:
6.14%
0.01% of residents moved to foreign countries ($170 average AGI )Tulare County:
0.01%California average:
0.02%
Top counties to which taxpayers relocated from this county between 2020 and 2021:
Businesses in Farmersville, CA
Name Count Name Count
AutoZone 1 MasterBrand Cabinets 2 Cricket Wireless 1 McDonald's 1 Jack In The Box 1 U-Haul 1
Strongest AM radio stations in Farmersville:
KWRU (940 AM; 50 kW; FRESNO, CA)
KMJ (580 AM; 50 kW; FRESNO, CA; Owner: INFINITY RADIO OPERATIONS INC.)
KJUG (1270 AM; 5 kW; TULARE, CA; Owner: WESTCOAST BROADCASTING, INC.)
KRDU (1130 AM; 6 kW; DINUBA, CA; Owner: CAPSTAR TX LIMITED PARTNERSHIP)
KVBL (1400 AM; 1 kW; VISALIA, CA; Owner: CAPSTAR TX LIMITED PARTNERSHIP)
KERI (1180 AM; 50 kW; WASCO-GREENACRES, CA; Owner: KWSO, INC.)
KGEN (1370 AM; 1 kW; TULARE, CA; Owner: AZTECA BROADCASTING CORPORATION)
KOOR (790 AM; 10 kW; CLOVIS, CA; Owner: INFINITY RADIO OPERATIONS INC.)
KGDP (660 AM; 50 kW; ORCUTT, CA; Owner: RADIO REPRESENTATIVES, INC.)
KCHJ (1010 AM; 5 kW; DELANO, CA; Owner: ILLINOIS LOTUS CORP.)
KIGS (620 AM; 1 kW; HANFORD, CA; Owner: PERREIRA BROADCASTING)
KNZR (1560 AM; 25 kW; BAKERSFIELD, CA; Owner: BUCKLEY BROADCASTING CORP. OF CALIF.)
KIRV (1510 AM; daytime; 10 kW; FRESNO, CA; Owner: GORE-OVERGAARD BROADCASTING, INC)
Strongest FM radio stations in Farmersville:
KZPO (103.3 FM; LINDSAY, CA; Owner: LINDSAY BROADCASTING)
KSLK (96.1 FM; VISALIA, CA; Owner: NEW VISALIA BROADCASTING, INC.)
KDUV (88.9 FM; VISALIA, CA; Owner: COMMUNITY EDUCATIONAL B/CASTNG, INC.)
KJUG-FM (106.7 FM; TULARE, CA; Owner: WESTCOAST BROADCASTING, INC.)
K220EY (91.9 FM; PORTERVILLE, CA; Owner: FAMILY STATIONS, INC.)
KUFW (90.5 FM; WOODLAKE, CA; Owner: NATIONAL FARM WORKERS SERVICE CENTER)
KMQA (100.5 FM; EAST PORTERVILLE, CA; Owner: MOON BROADCASTING PORTERVILLE L.L.C.)
KFRR (104.1 FM; WOODLAKE, CA; Owner: IONOSPHERE B/CASTING LTD PARTNERSHIP)
KCRZ (104.9 FM; TIPTON, CA; Owner: WESTCOAST BROADCASTING, INC.)
KMAK (100.3 FM; ORANGE COVE, CA; Owner: RICHARD B. SMITH)
K203CM (88.5 FM; SANGER, CA; Owner: EDUCATIONAL MEDIA FOUNDATION)
KIOO (99.7 FM; PORTERVILLE, CA; Owner: BUCKLEY B/CSTNG CORP OF SAN JOA VAL)
K287AF (105.3 FM; VISALIA, CA; Owner: ASSOCIATION FOR COMMUNITY EDUCATION INC)
KWYE (101.1 FM; FRESNO, CA; Owner: INFINITY RADIO OPERATIONS INC.)
K266AH (101.1 FM; BENA, CA; Owner: CALVARY CHAPEL OF TWIN FALLS, INC.)
KTQX (90.1 FM; BAKERSFIELD, CA; Owner: RADIO BILINGUE, INC.)
KMGV (97.9 FM; FRESNO, CA; Owner: INFINITY RADIO OPERATIONS INC.)
K201FB (88.1 FM; TULARE, CA; Owner: PAULINO BERNAL EVANGELISM)
KSJV (91.5 FM; FRESNO, CA; Owner: RADIO BILINGUE, INC.)
KFSO-FM (92.9 FM; VISALIA, CA; Owner: CAPSTAR TX LIMITED PARTNERSHIP)
TV broadcast stations around Farmersville:
KFAZ-CA (Channel 8; VISALIA, CA; Owner: GARY M. COCOLA FAMILY TRUST)
KTFF (Channel 61; PORTERVILLE, CA; Owner: TELEFUTURA FRESNO LLC)
National Bridge Inventory (NBI) Statistics 32 Number of bridges171ft / 52.4m Total length121,567 Total average daily traffic10,666 Total average daily truck traffic
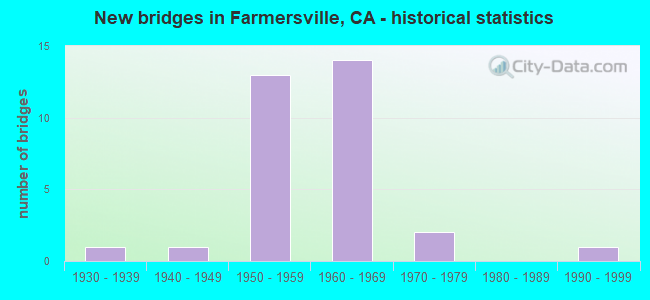
New bridges - historical statistics
1 1930-1939 1 1940-1949 13 1950-1959 14 1960-1969 2 1970-1979 1 1990-1999
See full National Bridge Inventory statistics for Farmersville, CA
FCC Registered Antenna Towers: 35 (
See the full list of FCC Registered Antenna Towers in Farmersville )
FCC Registered Broadcast Land Mobile Towers: 5
897 S Farmersville Boulevard (Lat: 36.290500 Lon: -119.208444), Type: Bant, Structure height: 30 m, Overall height: 37 m, Call Sign: KNGV846, Assigned Frequencies: 453.825 MHz, Grant Date: 04/03/2013, Expiration Date: 06/07/2023, Cancellation Date: 08/12/2023, Registrant: Cook\'s Communications Corp, 160 N. Broadway, Fresno, CA 93701, Phone: (559) 233-8818, Fax: (559) 268-8506, Email:
FPD, 909 W Visalia Road (Lat: 36.297194 Lon: -119.215306), Type: Pole, Structure height: 5.4 m, Overall height: 8.2 m, Call Sign: WGQ850, Assigned Frequencies: 159.030 MHz, Grant Date: 11/25/2021, Expiration Date: 02/20/2032, Registrant: County Of Tulare, 11871 Ave 272, Visalia, CA 93277, Phone: (559) 622-7150, Fax: (559) 737-4552, Email:
907 W Visalia Rd (Lat: 36.297111 Lon: -119.215139), Type: Pipe, Structure height: 12.2 m, Call Sign: WQQJ345, Assigned Frequencies: 4970.00 MHz, 4970.00 MHz, Grant Date: 10/14/2022, Expiration Date: 01/04/2033, Certifier: Byron D Smith, Registrant: County Of Tulare, 11871 Ave 272, Visalia, CA 93277, Phone: (559) 622-7150, Fax: (559) 737-4552, Email:
Lat: 36.301694 Lon: -119.205917, Call Sign: WRPR943, Assigned Frequencies: 461.881 MHz, 466.881 MHz, Grant Date: 03/10/2022, Expiration Date: 03/10/2032, Certifier: Charlie Montelongo, Registrant: Master Meter Inc., 101 Regency Parkway, Mansfield, TX 76063-5093, Phone: (817) 842-8000, Fax: (817) 842-8030, Email:
Lat: 36.297278 Lon: -119.215417, Call Sign: WRZF672, Licensee ID: L00002711, Assigned Frequencies: 159.112 MHz, Grant Date: 10/27/2023, Expiration Date: 10/27/2033, Certifier: Eric J Ott, Registrant: County Of Tulare, 11871 Ave 272, Visalia, CA 93277, Phone: (559) 622-7150, Fax: (559) 737-4552, Email:
FCC Registered Microwave Towers: 14 (
See the full list of FCC Registered Microwave Towers in this town )
FCC Registered Amateur Radio Licenses: 9 (
See the full list of FCC Registered Amateur Radio Licenses in Farmersville )
FAA Registered Aircraft: 2
Aircraft: PIPER PA-28-180 (Category: Land, Seats: 4, Weight: Up to 12,499 Pounds, Speed: 107 mph), Engine: LYCOMING O&VO-360 SER (180 HP) (Reciprocating)N-Number: 4867L, N4867L, N-4867L, Serial Number: 28-4221, Year manufactured: 1967, Airworthiness Date: 07/19/1967, Certificate Issue Date: 11/09/2015Registrant (Individual): James R Nelson, Po Box 496, Farmersville, CA 93223Aircraft: PIPER J3C-65 (Category: Land, Seats: 2, Weight: Up to 12,499 Pounds, Speed: 67 mph), Engine: CONT MOTOR C85 SERIES (85 HP) (Reciprocating)N-Number: 56334, N56334, N-56334, Serial Number: 8564, Year manufactured: 1942, Certificate Issue Date: 02/06/1969Registrant (Co-Owned): Coy Austin Mc, 844 Rose, Farmersville, CA 93223, Other Owners: Leroy Covert, Calvin MathewsDeregistered: Cancel Date: 05/04/2019
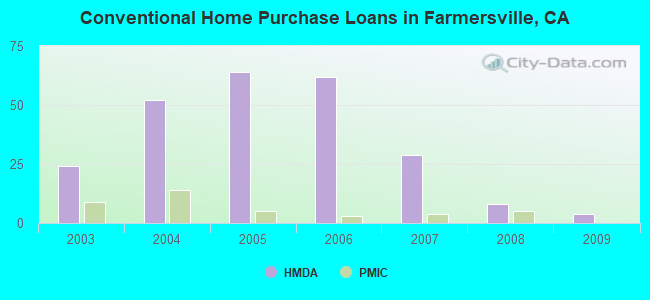
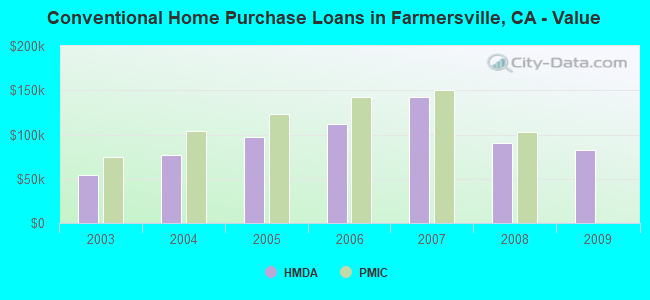
Home Mortgage Disclosure Act Aggregated Statistics For Year 2009(Based on 1 full and 1 partial tracts) A) FHA, FSA/RHS & VA B) Conventional C) Refinancings D) Home Improvement Loans F) Non-occupant Loans on Number Average Value Number Average Value Number Average Value Number Average Value Number Average Value
LOANS ORIGINATED 12 $96,739 4 $82,870 8 $77,568 0 $0 0 $0 APPLICATIONS APPROVED, NOT ACCEPTED 0 $0 0 $0 3 $64,620 1 $41,890 1 $60,390 APPLICATIONS DENIED 2 $88,845 0 $0 12 $102,532 1 $41,700 1 $61,980 APPLICATIONS WITHDRAWN 2 $103,695 0 $0 4 $93,965 1 $63,320 1 $63,540 FILES CLOSED FOR INCOMPLETENESS 0 $0 0 $0 0 $0 0 $0 0 $0
Aggregated Statistics For Year 2008(Based on 1 full and 1 partial tracts) A) FHA, FSA/RHS & VA B) Conventional C) Refinancings D) Home Improvement Loans F) Non-occupant Loans on Number Average Value Number Average Value Number Average Value Number Average Value Number Average Value
LOANS ORIGINATED 7 $120,100 8 $90,260 32 $103,960 4 $96,820 5 $86,254 APPLICATIONS APPROVED, NOT ACCEPTED 1 $153,910 0 $0 10 $119,514 2 $118,110 1 $117,870 APPLICATIONS DENIED 4 $101,962 1 $32,720 36 $141,528 16 $85,905 10 $117,817 APPLICATIONS WITHDRAWN 0 $0 3 $112,990 9 $100,330 0 $0 2 $122,080 FILES CLOSED FOR INCOMPLETENESS 0 $0 0 $0 1 $77,480 1 $187,120 1 $188,130
Aggregated Statistics For Year 2007(Based on 1 full and 1 partial tracts) A) FHA, FSA/RHS & VA B) Conventional C) Refinancings D) Home Improvement Loans F) Non-occupant Loans on Number Average Value Number Average Value Number Average Value Number Average Value Number Average Value
LOANS ORIGINATED 2 $180,130 29 $141,840 89 $131,009 19 $92,562 12 $118,534 APPLICATIONS APPROVED, NOT ACCEPTED 0 $0 7 $108,644 33 $120,302 4 $101,412 8 $152,600 APPLICATIONS DENIED 0 $0 22 $118,545 106 $146,009 26 $81,710 17 $140,908 APPLICATIONS WITHDRAWN 0 $0 1 $114,260 41 $154,534 4 $102,928 4 $137,348 FILES CLOSED FOR INCOMPLETENESS 0 $0 3 $167,397 14 $129,327 1 $105,200 1 $186,390
Aggregated Statistics For Year 2006(Based on 1 full and 1 partial tracts) A) FHA, FSA/RHS & VA B) Conventional C) Refinancings D) Home Improvement Loans F) Non-occupant Loans on Number Average Value Number Average Value Number Average Value Number Average Value Number Average Value
LOANS ORIGINATED 3 $180,393 62 $111,567 135 $140,770 23 $95,926 38 $115,209 APPLICATIONS APPROVED, NOT ACCEPTED 0 $0 6 $143,398 27 $147,025 4 $97,625 6 $144,428 APPLICATIONS DENIED 0 $0 24 $154,335 99 $156,910 26 $96,568 18 $154,225 APPLICATIONS WITHDRAWN 1 $229,360 13 $183,662 77 $139,154 5 $92,090 13 $133,287 FILES CLOSED FOR INCOMPLETENESS 0 $0 1 $236,010 23 $134,498 1 $129,520 1 $53,580
Aggregated Statistics For Year 2005(Based on 1 full and 1 partial tracts) A) FHA, FSA/RHS & VA B) Conventional C) Refinancings D) Home Improvement Loans F) Non-occupant Loans on Number Average Value Number Average Value Number Average Value Number Average Value Number Average Value
LOANS ORIGINATED 5 $113,238 64 $97,227 145 $110,738 24 $87,939 33 $102,953 APPLICATIONS APPROVED, NOT ACCEPTED 1 $158,780 11 $101,390 28 $94,115 6 $74,212 7 $97,581 APPLICATIONS DENIED 0 $0 20 $126,293 86 $117,860 20 $98,442 7 $159,130 APPLICATIONS WITHDRAWN 0 $0 18 $118,622 76 $103,678 14 $122,480 9 $87,851 FILES CLOSED FOR INCOMPLETENESS 0 $0 3 $124,360 27 $131,601 1 $59,320 0 $0
Aggregated Statistics For Year 2004(Based on 1 full and 1 partial tracts) A) FHA, FSA/RHS & VA B) Conventional C) Refinancings D) Home Improvement Loans F) Non-occupant Loans on G) Loans On Manufactured Number Average Value Number Average Value Number Average Value Number Average Value Number Average Value Number Average Value
LOANS ORIGINATED 16 $98,216 52 $76,687 103 $78,785 13 $51,670 21 $82,305 0 $0 APPLICATIONS APPROVED, NOT ACCEPTED 1 $80,350 8 $69,865 29 $77,379 1 $96,710 4 $69,422 0 $0 APPLICATIONS DENIED 4 $95,218 18 $87,293 102 $83,905 17 $45,563 11 $90,055 2 $35,305 APPLICATIONS WITHDRAWN 2 $119,500 13 $104,704 64 $85,248 3 $37,327 4 $95,725 0 $0 FILES CLOSED FOR INCOMPLETENESS 0 $0 1 $152,960 8 $85,099 1 $59,160 2 $69,210 0 $0
Aggregated Statistics For Year 2003(Based on 1 full and 1 partial tracts) A) FHA, FSA/RHS & VA B) Conventional C) Refinancings D) Home Improvement Loans E) Loans on Dwellings For 5+ Families F) Non-occupant Loans on Number Average Value Number Average Value Number Average Value Number Average Value Number Average Value Number Average Value
LOANS ORIGINATED 25 $89,179 24 $54,770 86 $65,312 2 $16,005 1 $244,040 18 $56,431 APPLICATIONS APPROVED, NOT ACCEPTED 1 $76,210 2 $80,115 18 $63,245 1 $5,840 0 $0 1 $85,090 APPLICATIONS DENIED 5 $74,032 15 $61,153 77 $75,081 3 $19,827 0 $0 9 $56,959 APPLICATIONS WITHDRAWN 2 $58,555 5 $60,558 50 $73,743 0 $0 0 $0 5 $60,708 FILES CLOSED FOR INCOMPLETENESS 1 $84,750 2 $63,590 1 $66,950 1 $68,190 0 $0 0 $0
Detailed HMDA statistics for the following Tracts:
0016.01
, 0016.02
Private Mortgage Insurance Companies Aggregated Statistics For Year 2008(Based on 1 full and 1 partial tracts) A) Conventional B) Refinancings C) Non-occupant Loans on Number Average Value Number Average Value Number Average Value
LOANS ORIGINATED 5 $102,500 3 $161,017 1 $87,670 APPLICATIONS APPROVED, NOT ACCEPTED 2 $165,235 2 $188,125 0 $0 APPLICATIONS DENIED 0 $0 0 $0 0 $0 APPLICATIONS WITHDRAWN 0 $0 1 $181,180 0 $0 FILES CLOSED FOR INCOMPLETENESS 0 $0 0 $0 0 $0
Aggregated Statistics For Year 2007(Based on 1 full and 1 partial tracts) A) Conventional B) Refinancings C) Non-occupant Loans on Number Average Value Number Average Value Number Average Value
LOANS ORIGINATED 4 $150,520 6 $168,878 2 $169,495 APPLICATIONS APPROVED, NOT ACCEPTED 1 $53,870 0 $0 1 $52,600 APPLICATIONS DENIED 1 $144,690 0 $0 0 $0 APPLICATIONS WITHDRAWN 1 $232,810 0 $0 0 $0 FILES CLOSED FOR INCOMPLETENESS 0 $0 0 $0 0 $0
Aggregated Statistics For Year 2006(Based on 1 full and 1 partial tracts) A) Conventional B) Refinancings C) Non-occupant Loans on Number Average Value Number Average Value Number Average Value
LOANS ORIGINATED 3 $142,673 4 $202,338 2 $144,655 APPLICATIONS APPROVED, NOT ACCEPTED 0 $0 0 $0 0 $0 APPLICATIONS DENIED 0 $0 0 $0 0 $0 APPLICATIONS WITHDRAWN 1 $232,810 0 $0 0 $0 FILES CLOSED FOR INCOMPLETENESS 0 $0 0 $0 0 $0
Aggregated Statistics For Year 2005(Based on 1 full and 1 partial tracts) A) Conventional B) Refinancings C) Non-occupant Loans on Number Average Value Number Average Value Number Average Value
LOANS ORIGINATED 5 $123,542 2 $103,565 3 $112,020 APPLICATIONS APPROVED, NOT ACCEPTED 4 $137,005 2 $113,965 3 $155,400 APPLICATIONS DENIED 0 $0 0 $0 0 $0 APPLICATIONS WITHDRAWN 0 $0 0 $0 0 $0 FILES CLOSED FOR INCOMPLETENESS 0 $0 0 $0 0 $0
Aggregated Statistics For Year 2004(Based on 1 full and 1 partial tracts) A) Conventional B) Refinancings C) Non-occupant Loans on Number Average Value Number Average Value Number Average Value
LOANS ORIGINATED 14 $104,139 4 $98,000 2 $117,010 APPLICATIONS APPROVED, NOT ACCEPTED 0 $0 1 $109,970 0 $0 APPLICATIONS DENIED 1 $99,360 0 $0 0 $0 APPLICATIONS WITHDRAWN 0 $0 0 $0 0 $0 FILES CLOSED FOR INCOMPLETENESS 1 $87,670 0 $0 0 $0
Aggregated Statistics For Year 2003(Based on 1 full and 1 partial tracts) A) Conventional B) Refinancings C) Non-occupant Loans on Number Average Value Number Average Value Number Average Value
LOANS ORIGINATED 9 $74,474 4 $81,715 1 $77,070 APPLICATIONS APPROVED, NOT ACCEPTED 2 $68,615 2 $83,700 0 $0 APPLICATIONS DENIED 0 $0 0 $0 0 $0 APPLICATIONS WITHDRAWN 0 $0 0 $0 0 $0 FILES CLOSED FOR INCOMPLETENESS 0 $0 0 $0 0 $0
Detailed PMIC statistics for the following Tracts:
0016.01
, 0016.02
Most common first names in Farmersville, CA among deceased individuals Name Count Lived (average)
James 32 66.2 years William 28 73.9 years John 28 72.5 years George 22 78.1 years Mary 20 71.1 years Jose 17 71.0 years Robert 17 66.1 years Charles 15 69.3 years Walter 13 73.2 years Maria 12 73.7 years
Most common last names in Farmersville, CA among deceased individuals Last name Count Lived (average)
Smith 16 73.8 years Johnson 13 73.1 years Garcia 12 70.9 years Martinez 11 59.0 years Qualls 10 66.3 years Jones 9 76.9 years Sanchez 9 75.6 years Phillips 9 72.3 years Mcgill 9 71.2 years Rodriguez 9 63.7 years
Farmersville compared to California state average:
Median household income below state average. Median house value significantly below state average. Black race population percentage significantly below state average. Hispanic race population percentage above state average. Median age below state average. Length of stay since moving in significantly above state average. Percentage of population with a bachelor's degree or higher significantly below state average. Farmersville on our top lists :
#47 on the list of "Top 101 cities with largest percentage of females in occupations: material moving occupations (population 5,000+)"
#55 on the list of "Top 101 cities with largest percentage of females in occupations: farming, fishing, and forestry occupations (population 5,000+)"
#57 on the list of "Top 100 least-educated cities (pop. 5,000+)"
#67 on the list of "Top 101 cities with largest percentage of females in industries: agriculture, forestry, fishing and hunting (population 5,000+)"
#87 on the list of "Top 101 cities with the highest percentage of family households, population 10,000+"
#101 on the list of "Top 101 cities with largest percentage of males in occupations: farming, fishing, and forestry occupations (population 5,000+)"
#6 on the list of "Top 101 counties with the highest Particulate Matter (PM2.5 ) Annual air pollution readings in 2012 (µg/m3 )"
#7 on the list of "Top 101 counties with the highest Particulate Matter (PM10 ) Annual air pollution readings in 2012 (µg/m3 )"
#10 on the list of "Top 101 counties with the highest number of births per 1000 residents 2007-2013"
#16 on the list of "Top 101 counties with the highest Ozone (1-hour) air pollution readings in 2012 (ppm)"
#25 on the list of "Top 101 counties with the lowest percentage of residents relocating to foreign countries in 2011"


 Recent articles from our blog. Our writers, many of them Ph.D. graduates or candidates, create easy-to-read articles on a wide variety of topics.


 (5.8 miles

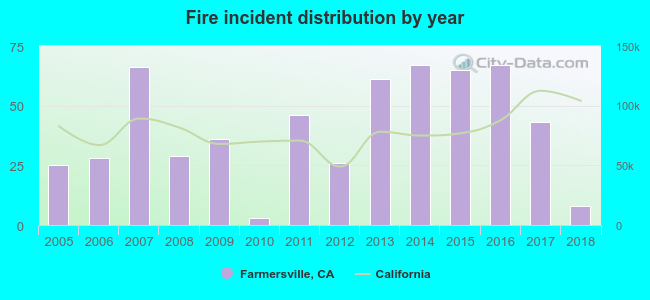 According to the data from the years 2005 - 2018 the average number of fires per year is 41. The highest number of reported fires - 67 took place in 2014, and the least - 3 in 2010. The data has a decreasing trend.
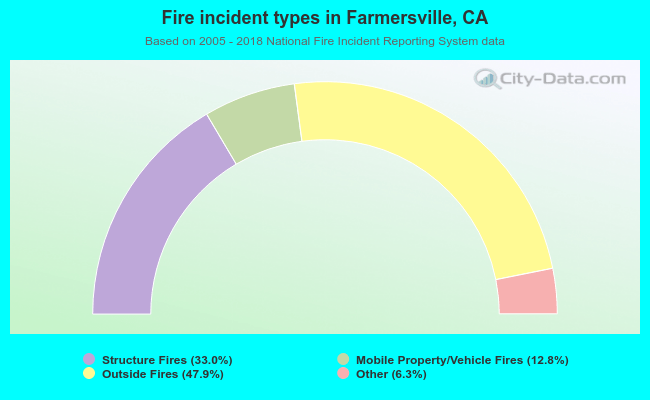 When looking into fire subcategories, the most reports belonged to: Outside Fires (47.9%), and Structure Fires (33.0%).