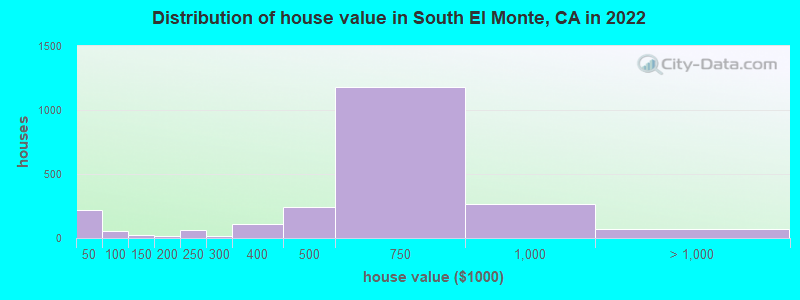
Estimated median house or condo value in 2022: $627,250 (it was $152,900 in 2000)
South El Monte:
$627,250
CA:
$715,900
Mean prices in 2022:all housing units: over $1,000,000; detached houses: over $1,000,000; townhouses or other attached units: $750,854; in 2-unit structures: over $1,000,000; in 3-to-4-unit structures: $791,642; in 5-or-more-unit structures: $738,503; mobile homes: $205,184; occupied boats, rvs, vans, etc.: $276,239
Median gross rent in 2022: $1,660.
March 2022 cost of living index in South El Monte: 140.4 (very high, U.S. average is 100)
Percentage of residents living in poverty in 2022: 21.2%
(8.2% for White Non-Hispanic residents, 69.1% for Black residents, 23.3% for Hispanic or Latino residents, 13.0% for American Indian residents, 30.6% for other race residents, 7.8% for two or more races residents)
According to our research of California and other state lists, there were 16 registered sex offenders living in South El Monte, California as of May 04, 2024. The ratio of all residents to sex offenders in South El Monte is 1,296 to 1. The ratio of registered sex offenders to all residents in this city is lower than the state average.
Crime rates in South El Monte by year
Type
2009
2010
2011
2012
2013
2014
2015
2016
2017
2018
2019
2020
2022
Murders (per 100,000)
0 (0.0)
3 (14.9)
0 (0.0)
2 (9.8)
1 (4.9)
1 (4.9)
6 (29.0)
2 (9.5)
2 (9.5)
1 (4.7)
1 (4.8)
0 (0.0)
1 (5.1)
Rapes (per 100,000)
6 (28.0)
4 (19.9)
6 (29.5)
3 (14.7)
4 (19.7)
4 (19.5)
6 (29.0)
6 (28.5)
4 (19.0)
7 (33.2)
11 (52.8)
9 (43.6)
5 (25.6)
Robberies (per 100,000)
69 (322.1)
45 (223.7)
41 (201.5)
38 (185.8)
35 (172.0)
34 (166.1)
27 (130.6)
44 (209.2)
35 (166.6)
33 (156.3)
32 (153.5)
29 (140.6)
35 (179.3)
Assaults (per 100,000)
75 (350.1)
82 (407.6)
75 (368.5)
45 (220.0)
48 (235.8)
81 (395.8)
86 (415.9)
57 (271.0)
80 (380.7)
85 (402.6)
58 (278.2)
80 (387.8)
85 (435.4)
Burglaries (per 100,000)
124 (578.8)
93 (462.3)
75 (368.5)
104 (508.5)
117 (574.8)
162 (791.6)
161 (778.6)
152 (722.7)
169 (804.3)
145 (686.8)
132 (633.0)
166 (804.7)
295 (1,511)
Thefts (per 100,000)
355 (1,657)
247 (1,228)
184 (904.1)
184 (899.7)
208 (1,022)
353 (1,725)
325 (1,572)
273 (1,298)
314 (1,494)
313 (1,482)
254 (1,218)
278 (1,348)
377 (1,931)
Auto thefts (per 100,000)
131 (611.5)
137 (681.0)
117 (574.9)
111 (542.7)
119 (584.7)
132 (645.0)
163 (788.2)
155 (737.0)
201 (956.6)
163 (772.0)
114 (546.7)
123 (596.3)
196 (1,004)
Arson (per 100,000)
9 (42.0)
5 (24.9)
3 (14.7)
3 (14.7)
4 (19.7)
3 (14.7)
5 (24.2)
6 (28.5)
9 (42.8)
5 (23.7)
3 (14.4)
9 (43.6)
1 (5.1)
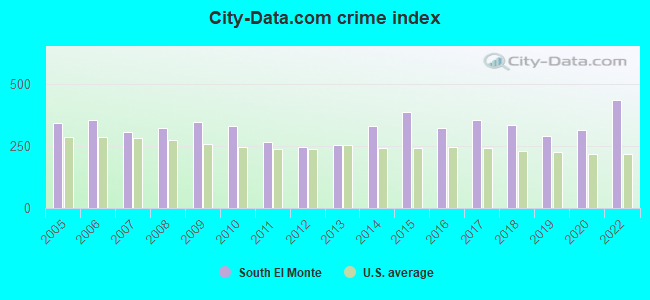
City-Data.com crime index
344.8
330.3
265.7
246.0
252.2
330.4
384.0
320.3
353.0
332.5
290.2
312.6
434.9
The City-Data.com crime index weighs serious crimes and violent crimes more heavily. Higher means more crime, U.S. average is 246.1. It adjusts for the number of visitors and daily workers commuting into cities.
Latest news from South El Monte, CA collected exclusively by city-data.com from local newspapers, TV, and radio stations
Current Local Time: PST time zone
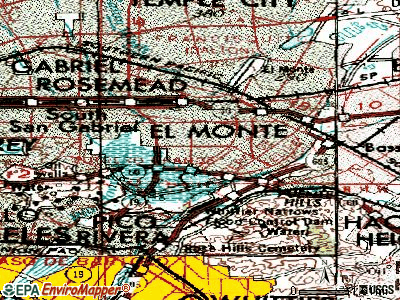
Elevation: 250 feet
Land area: 2.88 square miles.
Population density: 6,796 people per square mile (high).
8,538 residents are foreign born (30.9% Latin America, 13.6% Asia).
This city:
44.3%
California:
26.5%
Median real estate property taxes paid for housing units with mortgages in 2022: $4,647 (0.7%) Median real estate property taxes paid for housing units with no mortgage in 2022: $2,988 (0.5%)
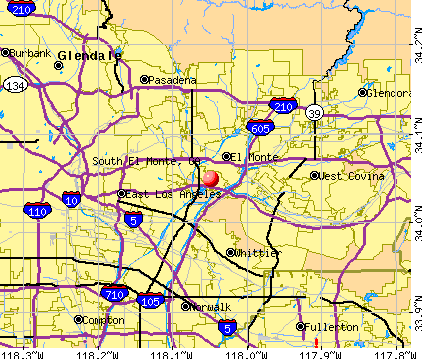
Nearest city with pop. 50,000+: El Monte, CA (2.1 miles , pop. 115,965).
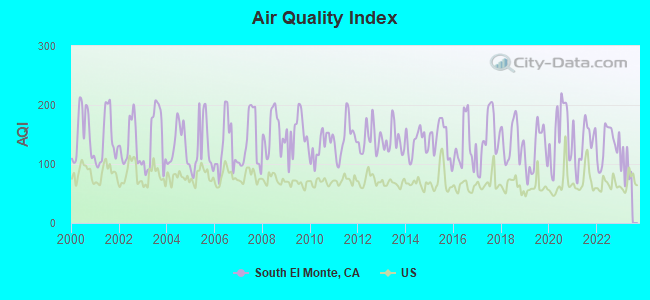
Air Quality Index (AQI) level in 2022 was 133. This is significantly worse than average.
City:
133
U.S.:
73
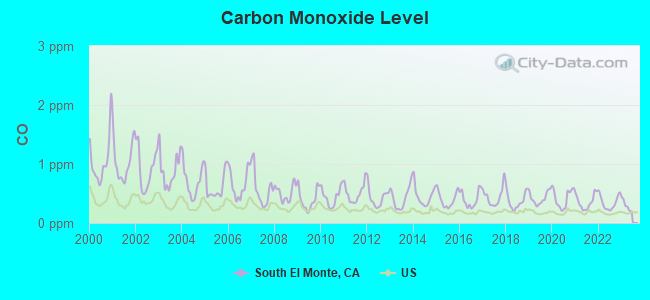
Carbon Monoxide (CO) [ppm] level in 2022 was 0.348. This is worse than average.Closest monitor was 2.9 miles away from the city center.
City:
0.348
U.S.:
0.251
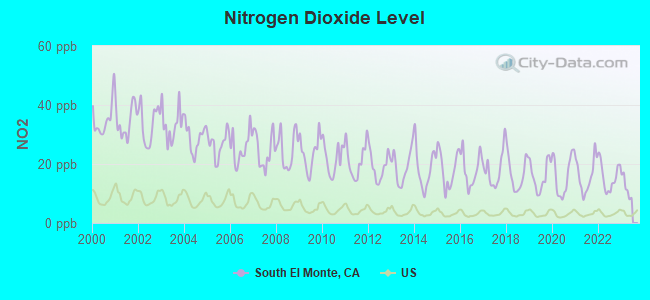
Nitrogen Dioxide (NO2) [ppb] level in 2022 was 15.7. This is significantly worse than average.Closest monitor was 2.5 miles away from the city center.
City:
15.7
U.S.:
5.1
Sulfur Dioxide (SO2) [ppb] level in 2022 was 0.310. This is significantly better than average.Closest monitor was 2.9 miles away from the city center.
City:
0.310
U.S.:
1.515
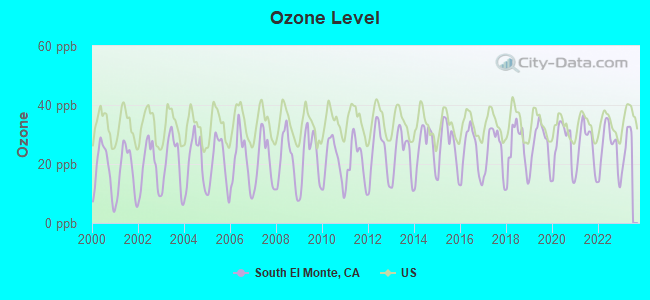
Ozone [ppb] level in 2022 was 25.4. This is better than average.Closest monitor was 1.9 miles away from the city center.
City:
25.4
U.S.:
33.3
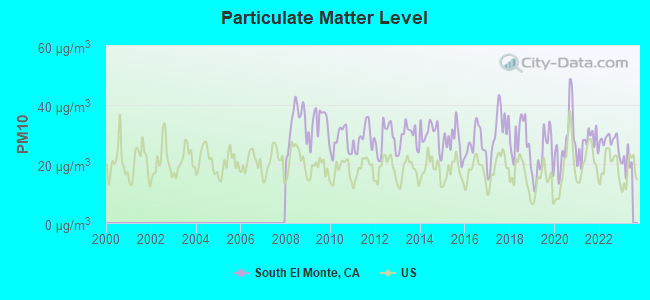
Particulate Matter (PM10) [µg/m3] level in 2022 was 27.6. This is significantly worse than average.Closest monitor was 9.4 miles away from the city center.
City:
27.6
U.S.:
19.2
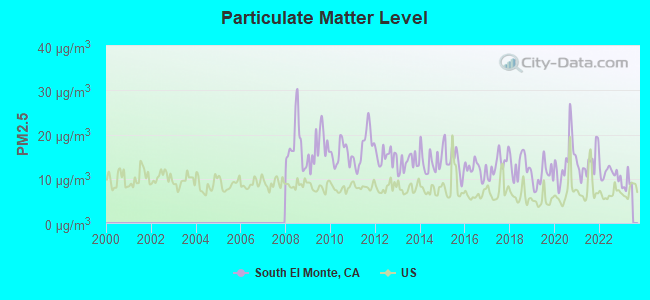
Particulate Matter (PM2.5) [µg/m3] level in 2022 was 11.2. This is worse than average.Closest monitor was 2.5 miles away from the city center.
City:
11.2
U.S.:
8.1
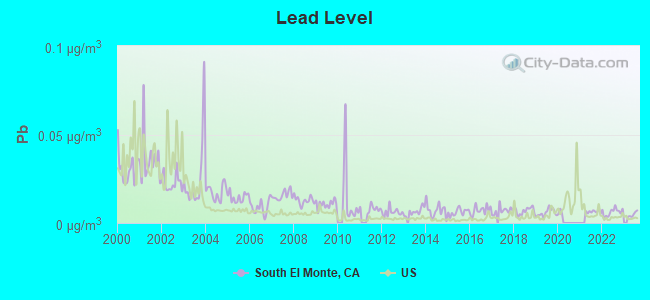
Lead (Pb) [µg/m3] level in 2022 was 0.00615. This is significantly better than average.Closest monitor was 0.7 miles away from the city center.
City:
0.00615
U.S.:
0.00931
Earthquake activity:
South El Monte-area historical earthquake activity is significantly above California state average. It is 7097% greater than the overall U.S. average.
On 7/21/1952 at 11:52:14, a magnitude 7.7 (7.7 UK, Class: Major, Intensity: VIII - XII) earthquake occurred 85.3 miles away from the city center, causing $50,000,000 total damage On 6/28/1992 at 11:57:34, a magnitude 7.6 (6.2 MB, 7.6 MS, 7.3 MW, Depth: 0.7 mi) earthquake occurred 87.3 miles away from South El Monte center, causing 3 deaths (1 shaking deaths, 2 other deaths) and 400 injuries, causing $100,000,000 total damage and $40,000,000 insured losses On 10/16/1999 at 09:46:44, a magnitude 7.4 (6.3 MB, 7.4 MS, 7.2 MW, 7.3 ML) earthquake occurred 97.7 miles away from the city center On 11/4/1927 at 13:51:53, a magnitude 7.5 (7.5 UK) earthquake occurred 180.3 miles away from the city center On 1/17/1994 at 12:30:55, a magnitude 6.8 (6.4 MB, 6.8 MS, 6.7 MW, Depth: 11.4 mi, Class: Strong, Intensity: VII - IX) earthquake occurred 31.1 miles away from the city center, causing 60 deaths (60 shaking deaths) and 7000 injuries On 4/21/1918 at 22:32:30, a magnitude 6.8 (6.8 UK) earthquake occurred 38.6 miles away from the city center Magnitude types: body-wave magnitude (MB), local magnitude (ML), surface-wave magnitude (MS), moment magnitude (MW)
Natural disasters:
The number of natural disasters in Los Angeles County (57) is a lot greater than the US average (15). Major Disasters (Presidential) Declared: 27 Emergencies Declared: 3
Causes of natural disasters: Fires: 37, Floods: 16, Storms: 9, Winter Storms: 6, Landslides: 5, Mudslides: 5, Earthquakes: 3, Freeze: 1, Heavy Rain: 1, Hurricane: 1, Snow: 1, Tornado: 1, Wind: 1, Other: 1 (Note: some incidents may be assigned to more than one category).
Hospitals and medical centers in South El Monte:
GREATER EL MONTE COMMUNITY HOSPITAL (Voluntary non-profit - Private, provides emergency services, 1701 SANTA ANITA AVE)
DAVITA-GREATER EL MONTE DIALYSIS CENTER (1938 TYLER AVENUE, SUITE J-168)
GREATER LOS ANGELES DIALYSIS, INC. (11204 E. RUSH STREET)
Amtrak stations near South El Monte:
9 miles: PASADENA (150 S. ROBLES AVE.) - Bus Station . Services: fully wheelchair accessible, enclosed waiting area, public restrooms, public payphones, full-service food facilities, paid short-term parking, paid long-term parking, taxi stand, public transit connection.
11 miles: LOS ANGELES (800 N. ALAMEDA ST.) . Services: ticket office, fully wheelchair accessible, enclosed waiting area, public restrooms, public payphones, snack bar, free short-term parking, paid long-term parking, car rental agency, taxi stand, public transit connection.
14 miles: GLENDALE (400 W. CERRITOS AVE.) . Services: fully wheelchair accessible, public payphones, free short-term parking, free long-term parking, call for taxi service, intercity bus service, public transit connection.
Notable locations in South El Monte: South El Monte Branch County of Los Angeles Public Library (A), Los Angeles County Fire Department Station 90 (B). Display/hide their locations on the map
Churches in South El Monte include: Saint Stevens Serbian Orthodox Cathedral (A), Epiphany Catholic Church (B), Victory Outreach El Monte (C), Vietnamese Alliance Church (D). Display/hide their locations on the map
Tourist attraction: American Military Museum-American Heritage Park (1918 Rosemead Boulevard).
Los Angeles County has a predicted average indoor radon screening level between 2 and 4 pCi/L (pico curies per liter) - Moderate Potential
Average household size:
This city:
4.4 people
California:
2.9 people
Percentage of family households:
This city:
87.6%
Whole state:
68.7%
Percentage of households with unmarried partners:
This city:
7.7%
Whole state:
7.2%
Likely homosexual households (counted as self-reported same-sex unmarried-partner households)
Lesbian couples: 0.2% of all households
Gay men: 0.3% of all households
People in group quarters in South El Monte in 2010:
28 people in emergency and transitional shelters (with sleeping facilities) for people experiencing homelessness
16 people in other noninstitutional facilities
10 people in in-patient hospice facilities
3 people in group homes intended for adults
16 people in homes for the mentally ill in 2000
2 people in other noninstitutional group quarters in 2000
Banks with branches in South El Monte (2011 data):
Citizens Business Bank: South El M0nte Branch at 9754 Rush Street, branch established on 1983/07/12. Info updated 2011/03/30: Bank assets: $6,475.4 mil, Deposits: $4,625.6 mil, headquarters in Ontario, CA, positive income, Commercial Lending Specialization, 46 total offices, Holding Company: Cvb Financial Corp.
Bank of the West: South El Monte Branch at 2041 Durfee Avenue, branch established on 1964/11/25. Info updated 2009/11/16: Bank assets: $62,408.3 mil, Deposits: $43,995.2 mil, headquarters in San Francisco, CA, positive income, 647 total offices, Holding Company: Bnp Paribas
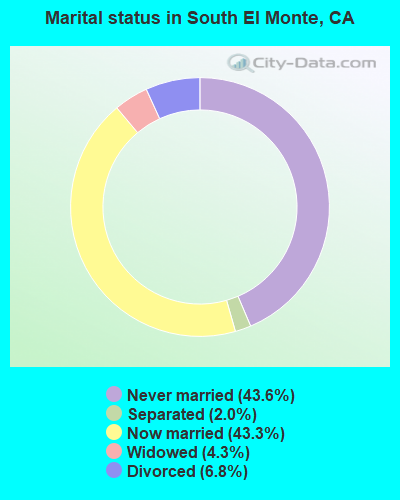
For population 15 years and over in South El Monte:
Never married: 43.6%
Now married: 43.3%
Separated: 2.0%
Widowed: 4.3%
Divorced: 6.8%
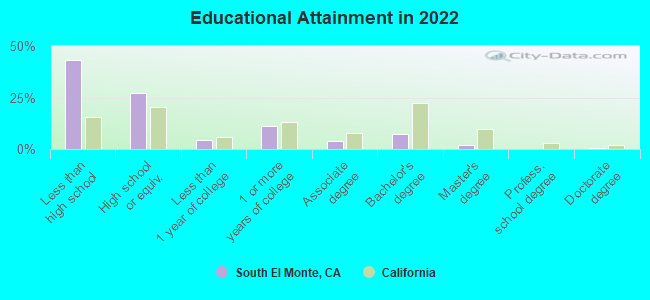
For population 25 years and over in South El Monte:
Religion statistics for South El Monte, CA (based on Los Angeles County data)
Religion
Adherents
Congregations
Catholic
3,542,994
275
Evangelical Protestant
814,611
3,249
Other
451,594
1,023
Mainline Protestant
229,056
860
Black Protestant
112,338
290
Orthodox
63,517
76
None
4,604,495
-
Source: Clifford Grammich, Kirk Hadaway, Richard Houseal, Dale E.Jones, Alexei Krindatch, Richie Stanley and Richard H.Taylor. 2012. 2010 U.S.Religion Census: Religious Congregations & Membership Study. Association of Statisticians of American Religious Bodies. Jones, Dale E., et al. 2002. Congregations and Membership in the United States 2000. Nashville, TN: Glenmary Research Center. Graphs represent county-level data
Shannan L Schmidt, 2446 Lee Ave (Lat: 34.056583 Lon: -118.066611), Type: 22.3, Overall height: 22.3 m, Registrant: Horvath Towers LLC, Sschmidt@horvathcommunications.Com, , South- Bend, Phone: (574) 237-0464
Shannan L Schmidt, 2446 Lee Ave (Lat: 34.056583 Lon: -118.066611), Type: 22.3, Overall height: 22.3 m, Registrant: Horvath Towers LLC, Sschmidt@horvathcommunications.Com, , South- Bend, Phone: (574) 237-0464
Edward G Roach, 2446 Lee Ave (Lat: 34.056583 Lon: -118.066611), Type: 22.3, Overall height: 22.3 m, Registrant: Horvath Towers LLC, Sschmidt@horvathcommunications.Com, , South- Bend, Phone: (574) 237-0464
FCC Registered Broadcast Land Mobile Towers:
7
10115 E Rush St (Lat: 34.051944 Lon: -118.049500), Call Sign: KVP655, Assigned Frequencies: 154.340 MHz, Grant Date: 03/15/2023, Expiration Date: 04/07/2033, Registrant: County Of Los Angeles, 1110 N Eastern Ave, Los Angeles, CA 90063, Phone: (323) 267-3004, Email:
10115 E Rush St (Lat: 34.051944 Lon: -118.049500), Call Sign: WIK493, Licensee ID: L00007682, Assigned Frequencies: 473.512 MHz, 473.537 MHz, 485.662 MHz, 485.687 MHz, 485.712 MHz, 485.737 MHz, 485.762 MHz, 485.787 MHz, Grant Date: 01/09/2015, Expiration Date: 04/02/2025, Registrant: County Of Los Angeles, 1110 N Eastern Ave, Los Angeles, CA 90063, Phone: (323) 267-3004, Fax: (323) 262-4607, Email:
Lat: 34.046417 Lon: -118.029639, Call Sign: WPTT212, Assigned Frequencies: 461.262 MHz, 463.737 MHz, Grant Date: 12/10/2001, Expiration Date: 12/10/2011, Cancellation Date: 02/11/2012, Certifier: Jack W Mosley, Registrant: Business Radio Licensing, 26941 Cabot Rd #134, Laguna Hills, CA 92653, Phone: (949) 348-8510, Fax: (949) 348-8514
Lat: 34.047778 Lon: -118.042278, Call Sign: WQBI810, Assigned Frequencies: 462.412 MHz, Grant Date: 10/16/2004, Expiration Date: 10/16/2014, Cancellation Date: 12/20/2014, Certifier: Mario Sais, Registrant: Federal Licensing, Inc., 1588 Fairfield Road, Gettysburg, PA 17325, Phone: (717) 334-9262, Fax: (717) 334-6440, Email:
Aircraft: CHINESE A/F AERO IND DEVEL CTR PL-1B (Category: Land, Seats: 2, Weight: Up to 12,499 Pounds), Engine: LYCOMING 0-320 SERIES (180 HP) (Reciprocating) N-Number: 3237N, N3237N, N-3237N, Serial Number: 5849, Year manufactured: 1970, Airworthiness Date: 02/23/2009, Certificate Issue Date: 03/24/2009 Registrant (Individual): Leo Lea Young Lee, 2656 Chico Ave, South El Monte, CA 91733
Aircraft: LOEFFLER PAZMANY PL-1 (Category: Land, Seats: 2, Weight: Up to 12,499 Pounds, Speed: 67 mph), Engine: LYCOMING 0-290 SERIES (140 HP) (Reciprocating) N-Number: 5804, N5804, N-5804, Serial Number: CAF-4, Airworthiness Date: 08/26/1980, Certificate Issue Date: 03/19/2020 Registrant (Corporation): Chewale Inc, 2656 Chico Ave, South El Monte, CA 91733
Home Mortgage Disclosure Act Aggregated Statistics For Year 2009 (Based on 7 partial tracts)
A) FHA, FSA/RHS & VA Home Purchase Loans
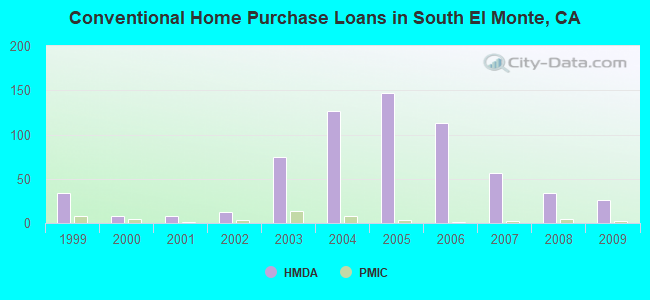
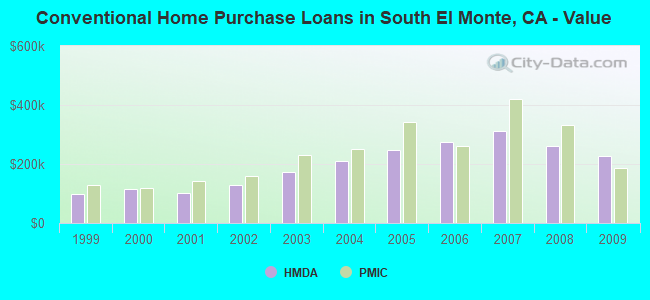
B) Conventional Home Purchase Loans
C) Refinancings
D) Home Improvement Loans
E) Loans on Dwellings For 5+ Families
F) Non-occupant Loans on < 5 Family Dwellings (A B C & D)
Number
Average Value
Number
Average Value
Number
Average Value
Number
Average Value
Number
Average Value
Number
Average Value
LOANS ORIGINATED
13
$283,954
26
$225,759
56
$212,724
2
$118,050
3
$587,953
11
$200,615
APPLICATIONS APPROVED, NOT ACCEPTED
0
$0
4
$228,985
8
$241,325
1
$8,580
0
$0
1
$226,610
APPLICATIONS DENIED
7
$328,426
13
$217,648
50
$223,735
7
$82,561
1
$720,640
8
$253,761
APPLICATIONS WITHDRAWN
1
$213,460
4
$259,318
17
$282,966
2
$165,880
0
$0
1
$196,820
FILES CLOSED FOR INCOMPLETENESS
1
$168,150
2
$230,780
8
$193,865
1
$228,420
1
$578,660
1
$106,340
Aggregated Statistics For Year 2008 (Based on 7 partial tracts)
A) FHA, FSA/RHS & VA Home Purchase Loans
B) Conventional Home Purchase Loans
C) Refinancings
D) Home Improvement Loans
E) Loans on Dwellings For 5+ Families
F) Non-occupant Loans on < 5 Family Dwellings (A B C & D)
G) Loans On Manufactured Home Dwelling (A B C & D)
Number
Average Value
Number
Average Value
Number
Average Value
Number
Average Value
Number
Average Value
Number
Average Value
Number
Average Value
LOANS ORIGINATED
3
$347,300
34
$260,938
61
$255,814
13
$140,382
2
$484,100
12
$228,078
1
$48,560
APPLICATIONS APPROVED, NOT ACCEPTED
1
$421,650
7
$190,151
26
$246,212
1
$194,750
1
$397,210
1
$269,510
2
$64,865
APPLICATIONS DENIED
0
$0
15
$308,607
79
$272,433
13
$184,138
0
$0
11
$311,521
1
$29,980
APPLICATIONS WITHDRAWN
3
$352,777
7
$283,651
22
$320,914
3
$242,767
1
$593,890
5
$245,798
0
$0
FILES CLOSED FOR INCOMPLETENESS
1
$223,050
9
$231,536
9
$292,641
3
$76,907
0
$0
1
$395,670
0
$0
Aggregated Statistics For Year 2007 (Based on 7 partial tracts)
B) Conventional Home Purchase Loans
C) Refinancings
D) Home Improvement Loans
E) Loans on Dwellings For 5+ Families
F) Non-occupant Loans on < 5 Family Dwellings (A B C & D)
G) Loans On Manufactured Home Dwelling (A B C & D)
Number
Average Value
Number
Average Value
Number
Average Value
Number
Average Value
Number
Average Value
Number
Average Value
LOANS ORIGINATED
56
$311,357
159
$286,547
34
$232,810
3
$567,937
27
$330,797
0
$0
APPLICATIONS APPROVED, NOT ACCEPTED
21
$266,340
51
$313,389
4
$181,035
1
$546,480
10
$327,758
2
$69,790
APPLICATIONS DENIED
54
$352,407
126
$319,063
31
$186,375
1
$540,480
19
$351,815
3
$49,013
APPLICATIONS WITHDRAWN
16
$404,759
50
$287,124
9
$199,837
0
$0
10
$356,086
0
$0
FILES CLOSED FOR INCOMPLETENESS
8
$360,425
22
$351,070
1
$17,780
0
$0
4
$340,860
0
$0
Aggregated Statistics For Year 2006 (Based on 7 partial tracts)
A) FHA, FSA/RHS & VA Home Purchase Loans
B) Conventional Home Purchase Loans
C) Refinancings
D) Home Improvement Loans
E) Loans on Dwellings For 5+ Families
F) Non-occupant Loans on < 5 Family Dwellings (A B C & D)
G) Loans On Manufactured Home Dwelling (A B C & D)
Number
Average Value
Number
Average Value
Number
Average Value
Number
Average Value
Number
Average Value
Number
Average Value
Number
Average Value
LOANS ORIGINATED
0
$0
113
$276,201
229
$274,332
40
$189,571
9
$739,574
38
$310,934
1
$39,340
APPLICATIONS APPROVED, NOT ACCEPTED
1
$193,400
30
$256,921
56
$308,910
8
$210,654
0
$0
10
$307,579
4
$44,375
APPLICATIONS DENIED
0
$0
61
$299,882
129
$283,947
41
$202,705
1
$781,430
23
$327,810
0
$0
APPLICATIONS WITHDRAWN
0
$0
17
$296,143
105
$303,012
8
$209,275
0
$0
6
$402,370
0
$0
FILES CLOSED FOR INCOMPLETENESS
0
$0
10
$300,238
19
$317,901
2
$414,740
0
$0
4
$224,970
0
$0
Aggregated Statistics For Year 2005 (Based on 7 partial tracts)
B) Conventional Home Purchase Loans
C) Refinancings
D) Home Improvement Loans
E) Loans on Dwellings For 5+ Families
F) Non-occupant Loans on < 5 Family Dwellings (A B C & D)
G) Loans On Manufactured Home Dwelling (A B C & D)
Number
Average Value
Number
Average Value
Number
Average Value
Number
Average Value
Number
Average Value
Number
Average Value
LOANS ORIGINATED
147
$247,205
240
$242,537
43
$185,329
7
$733,053
46
$267,896
1
$116,560
APPLICATIONS APPROVED, NOT ACCEPTED
36
$217,838
61
$235,104
9
$155,542
0
$0
15
$254,501
5
$60,924
APPLICATIONS DENIED
60
$234,079
129
$245,776
40
$145,641
3
$244,500
17
$281,754
4
$102,512
APPLICATIONS WITHDRAWN
35
$239,010
93
$229,175
18
$159,333
0
$0
8
$252,986
0
$0
FILES CLOSED FOR INCOMPLETENESS
6
$274,713
35
$245,645
3
$174,643
2
$410,505
4
$269,005
0
$0
Aggregated Statistics For Year 2004 (Based on 7 partial tracts)
A) FHA, FSA/RHS & VA Home Purchase Loans
B) Conventional Home Purchase Loans
C) Refinancings
D) Home Improvement Loans
E) Loans on Dwellings For 5+ Families
F) Non-occupant Loans on < 5 Family Dwellings (A B C & D)
G) Loans On Manufactured Home Dwelling (A B C & D)
Number
Average Value
Number
Average Value
Number
Average Value
Number
Average Value
Number
Average Value
Number
Average Value
Number
Average Value
LOANS ORIGINATED
1
$116,670
126
$211,831
317
$199,586
28
$152,645
15
$615,248
36
$233,647
1
$14,230
APPLICATIONS APPROVED, NOT ACCEPTED
0
$0
27
$208,146
71
$193,750
9
$72,543
2
$202,415
10
$241,154
1
$60,230
APPLICATIONS DENIED
1
$204,180
50
$190,245
129
$200,398
37
$127,744
3
$505,590
12
$218,297
4
$57,375
APPLICATIONS WITHDRAWN
0
$0
22
$220,022
122
$189,362
12
$127,615
1
$571,050
5
$218,776
0
$0
FILES CLOSED FOR INCOMPLETENESS
0
$0
8
$209,925
32
$216,608
2
$65,335
0
$0
1
$160,880
0
$0
Aggregated Statistics For Year 2003 (Based on 7 partial tracts)
A) FHA, FSA/RHS & VA Home Purchase Loans
B) Conventional Home Purchase Loans
C) Refinancings
D) Home Improvement Loans
E) Loans on Dwellings For 5+ Families
F) Non-occupant Loans on < 5 Family Dwellings (A B C & D)
Number
Average Value
Number
Average Value
Number
Average Value
Number
Average Value
Number
Average Value
Number
Average Value
LOANS ORIGINATED
7
$193,040
75
$172,648
395
$153,875
15
$45,789
7
$459,841
47
$170,946
APPLICATIONS APPROVED, NOT ACCEPTED
1
$241,140
21
$136,214
78
$165,134
2
$45,580
0
$0
10
$155,969
APPLICATIONS DENIED
1
$324,730
38
$155,588
144
$152,587
17
$34,084
2
$542,710
14
$187,166
APPLICATIONS WITHDRAWN
2
$227,595
20
$151,873
112
$158,262
4
$21,562
0
$0
9
$169,527
FILES CLOSED FOR INCOMPLETENESS
1
$136,290
3
$125,397
27
$165,096
0
$0
0
$0
3
$154,750
Aggregated Statistics For Year 2002 (Based on 1 partial tract)
A) FHA, FSA/RHS & VA Home Purchase Loans
B) Conventional Home Purchase Loans
C) Refinancings
D) Home Improvement Loans
F) Non-occupant Loans on < 5 Family Dwellings (A B C & D)
Number
Average Value
Number
Average Value
Number
Average Value
Number
Average Value
Number
Average Value
LOANS ORIGINATED
3
$162,253
12
$128,803
35
$134,705
1
$63,510
4
$100,478
APPLICATIONS APPROVED, NOT ACCEPTED
0
$0
2
$172,500
7
$134,864
0
$0
1
$120,930
APPLICATIONS DENIED
0
$0
1
$122,960
11
$126,563
3
$78,247
1
$2,540
APPLICATIONS WITHDRAWN
1
$64,020
1
$21,340
16
$149,477
1
$42,170
1
$58,430
FILES CLOSED FOR INCOMPLETENESS
0
$0
1
$73,670
3
$210,013
0
$0
0
$0
Aggregated Statistics For Year 2001 (Based on 1 partial tract)
A) FHA, FSA/RHS & VA Home Purchase Loans
B) Conventional Home Purchase Loans
C) Refinancings
D) Home Improvement Loans
E) Loans on Dwellings For 5+ Families
F) Non-occupant Loans on < 5 Family Dwellings (A B C & D)
Number
Average Value
Number
Average Value
Number
Average Value
Number
Average Value
Number
Average Value
Number
Average Value
LOANS ORIGINATED
2
$124,230
8
$102,700
27
$129,133
0
$0
1
$127,530
1
$158,530
APPLICATIONS APPROVED, NOT ACCEPTED
0
$0
1
$135,660
5
$97,556
0
$0
0
$0
1
$144,810
APPLICATIONS DENIED
1
$177,840
1
$76,720
13
$96,578
2
$8,385
0
$0
0
$0
APPLICATIONS WITHDRAWN
1
$70,120
2
$115,340
14
$143,792
2
$43,190
0
$0
1
$132,110
FILES CLOSED FOR INCOMPLETENESS
1
$88,410
1
$136,170
5
$113,916
1
$17,780
0
$0
1
$87,390
Aggregated Statistics For Year 2000 (Based on 1 partial tract)
A) FHA, FSA/RHS & VA Home Purchase Loans
B) Conventional Home Purchase Loans
C) Refinancings
D) Home Improvement Loans
F) Non-occupant Loans on < 5 Family Dwellings (A B C & D)
Number
Average Value
Number
Average Value
Number
Average Value
Number
Average Value
Number
Average Value
LOANS ORIGINATED
3
$147,350
8
$115,466
10
$85,310
2
$15,750
2
$87,395
APPLICATIONS APPROVED, NOT ACCEPTED
1
$71,640
1
$63,000
1
$2,540
1
$20,320
0
$0
APPLICATIONS DENIED
2
$103,400
5
$115,034
6
$85,868
3
$16,767
1
$46,750
APPLICATIONS WITHDRAWN
2
$108,480
2
$94,505
6
$114,407
0
$0
1
$77,230
FILES CLOSED FOR INCOMPLETENESS
0
$0
0
$0
2
$136,425
0
$0
0
$0
Aggregated Statistics For Year 1999 (Based on 4 partial tracts)
A) FHA, FSA/RHS & VA Home Purchase Loans
B) Conventional Home Purchase Loans
C) Refinancings
D) Home Improvement Loans
E) Loans on Dwellings For 5+ Families
F) Non-occupant Loans on < 5 Family Dwellings (A B C & D)
2005 - 2018 National Fire Incident Reporting System (NFIRS) incidents
Based on the data from the years 2005 - 2018 the average number of fire incidents per year is 34. The highest number of reported fire incidents - 60 took place in 2016, and the least - 0 in 2007. The data has a rising trend.
When looking into fire subcategories, the most incidents belonged to: Outside Fires (42.6%), and Mobile Property/Vehicle Fires (27.2%).
Fire incident types reported to NFIRS in South El Monte, CA


 Recent articles from our blog. Our writers, many of them Ph.D. graduates or candidates, create easy-to-read articles on a wide variety of topics.


 (2.1 miles
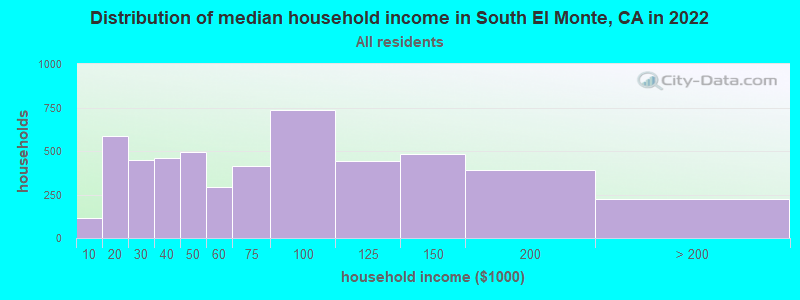


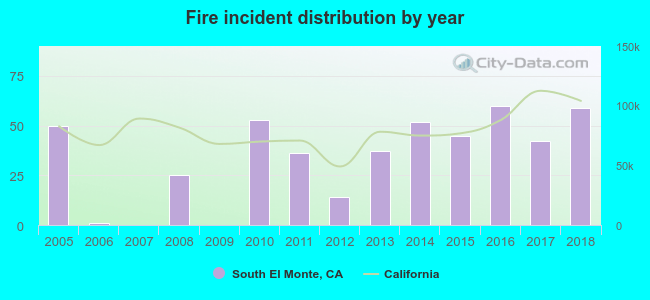 Based on the data from the years 2005 - 2018 the average number of fire incidents per year is 34. The highest number of reported fire incidents - 60 took place in 2016, and the least - 0 in 2007. The data has a rising trend.
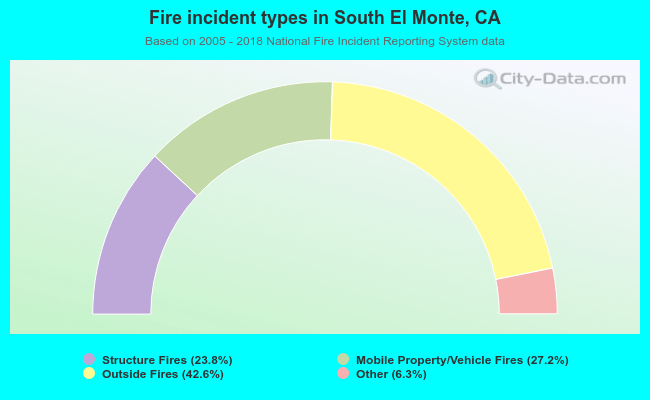 When looking into fire subcategories, the most incidents belonged to: Outside Fires (42.6%), and Mobile Property/Vehicle Fires (27.2%).