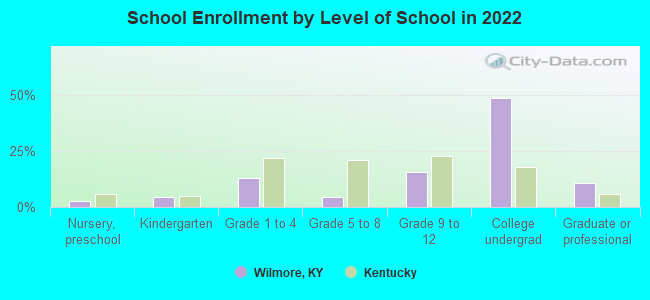
Wilmore, Kentucky
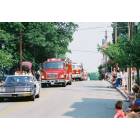
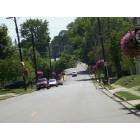
Submit your own pictures of this city and show them to the world
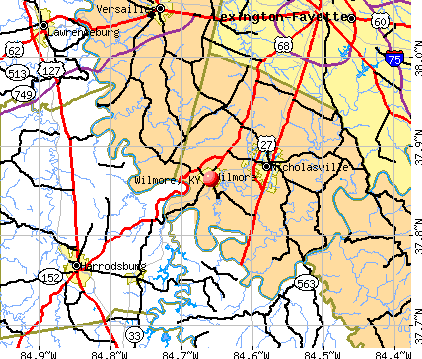
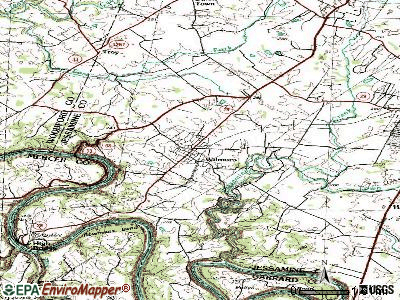
- OSM Map
- General Map
- Google Map
- MSN Map
Population change since 2000: +1.9%
| Males: 2,795 | |
| Females: 3,222 |
| Median resident age: | 29.3 years |
| Kentucky median age: | 39.4 years |
Zip codes: 40390.
| Wilmore: | $59,011 |
| KY: | $59,341 |
Estimated per capita income in 2022: $26,608 (it was $13,602 in 2000)
Wilmore city income, earnings, and wages data
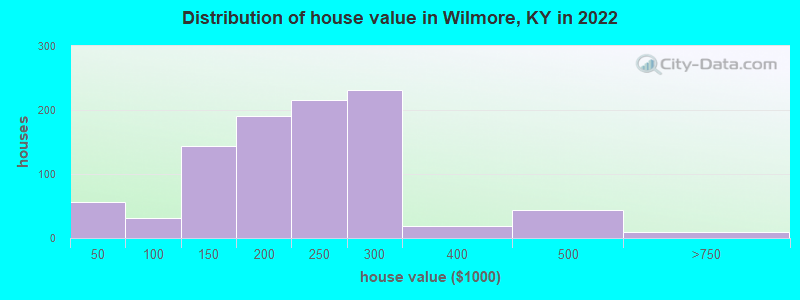
Estimated median house or condo value in 2022: $222,362 (it was $102,100 in 2000)
| Wilmore: | $222,362 |
| KY: | $196,300 |
Median gross rent in 2022: $846.
(6.7% for White Non-Hispanic residents, 85.7% for Black residents, 30.7% for Hispanic or Latino residents, 100.0% for other race residents, 16.6% for two or more races residents)
Detailed information about poverty and poor residents in Wilmore, KY

Compare current foreclosures near Wilmore, KY:
| Photo | Address | Area | Beds / Baths | Price | Details |
|---|---|---|---|---|---|

|
#1
Lowry Ln
Wilmore, KY 40390
|
2,102 sq. feet
|
1 baths 3 beds |
show details | |

|
#2
Pacer Rd
Wilmore, KY 40390
|
2,890 sq. feet
|
2 baths 4 beds |
show details | |

|
#3
Epworth Ave
Wilmore, KY 40390
|
- sq. feet
|
- baths - beds |
show details | |

|
#4
Alexis Dr
Wilmore, KY 40390
|
- sq. feet
|
- baths - beds |
show details | |

|
#5
Brookwood Ln
Wilmore, KY 40390
|
- sq. feet
|
- baths - beds |
show details | |

|
#6
N Maple St Apt 8
Wilmore, KY 40390
|
- sq. feet
|
- baths - beds |
show details | |

|
#7
Pleasantview St
Wilmore, KY 40390
|
- sq. feet
|
- baths - beds |
show details | |

|
#8
Woodspointe Way
Wilmore, KY 40390
|
- sq. feet
|
- baths - beds |
show details | |

|
#9
Cottage St
Nicholasville, KY 40356
|
1 sq. feet
|
1 baths 1 beds |
$62,500
|
show details |

|
#10
Belmere Dr
Lexington, KY 40509
|
2,842 sq. feet
|
3 baths 4 beds |
show details |
| Photo | Address | Area | Beds / Baths | Price | Details |
|---|---|---|---|---|---|

|
#11
Deer Lake Cir
Lexington, KY 40515
|
1,550 sq. feet
|
2 baths 2 beds |
show details | |

|
#12
Paddock Dr
Versailles, KY 40383
|
1,210 sq. feet
|
1 baths 3 beds |
show details | |

|
#13
Hunters Ct
Versailles, KY 40383
|
1,880 sq. feet
|
2 baths 3 beds |
show details | |

|
#14
Chelsea Woods Dr
Lexington, KY 40509
|
1,252 sq. feet
|
2 baths 2 beds |
show details | |

|
#15
N Limestone
Lexington, KY 40508
|
1,238 sq. feet
|
1 baths 2 beds |
show details | |

|
#16
Peachtree Rd
Nicholasville, KY 40356
|
1,764 sq. feet
|
3 baths 4 beds |
show details | |

|
#17
N Hardin Hts
Harrodsburg, KY 40330
|
588 sq. feet
|
1 baths 2 beds |
show details | |

|
#18
Greenbriar St
Nicholasville, KY 40356
|
2,144 sq. feet
|
1 baths 3 beds |
show details | |

|
#19
Kingsway Dr
Versailles, KY 40383
|
1,300 sq. feet
|
1 baths 3 beds |
show details | |

|
#20
Cornishville St
Harrodsburg, KY 40330
|
1,305 sq. feet
|
1 baths 2 beds |
show details |
| Photo | Address | Area | Beds / Baths | Price | Details |
|---|---|---|---|---|---|

|
#21
Gleneagles Way
Versailles, KY 40383
|
2,668 sq. feet
|
2 baths 4 beds |
show details | |

|
#22
College Mnr
Harrodsburg, KY 40330
|
1,604 sq. feet
|
2 baths 3 beds |
show details | |

|
#23
E Main St Unit 201
Lexington, KY 40508
|
786 sq. feet
|
1 baths 1 beds |
show details | |

|
#24
Talmage Mayo Rd
Harrodsburg, KY 40330
|
1,352 sq. feet
|
1 baths 3 beds |
show details | |

|
#25
Tabler Ave
Harrodsburg, KY 40330
|
624 sq. feet
|
1 baths 2 beds |
show details | |

|
#26
Christopher Dr
Nicholasville, KY 40356
|
1,336 sq. feet
|
2 baths 3 beds |
show details | |

|
#27
Barbaro Ln
Nicholasville, KY 40356
|
1,148 sq. feet
|
2 baths 4 beds |
show details | |

|
#28
Lake Park Rd Apt 6204
Lexington, KY 40502
|
1,157 sq. feet
|
2 baths 2 beds |
show details | |

|
#29
Baybrook Cir
Nicholasville, KY 40356
|
1,432 sq. feet
|
2 baths 3 beds |
show details | |

|
#30
Dunroven Rd
Versailles, KY 40383
|
1,161 sq. feet
|
1 baths 4 beds |
show details |
| Photo | Address | Area | Beds / Baths | Price | Details |
|---|---|---|---|---|---|

|
#31
Wildcat Rd
Lawrenceburg, KY 40342
|
1,732 sq. feet
|
2 baths 3 beds |
show details | |

|
#32
Lauren Dr
Nicholasville, KY 40356
|
1,025 sq. feet
|
1 baths 3 beds |
show details | |

|
#33
Locust Hts
Nicholasville, KY 40356
|
1,408 sq. feet
|
1 baths 2 beds |
show details | |

|
#34
Shun Pike
Nicholasville, KY 40356
|
1,212 sq. feet
|
1 baths 2 beds |
show details | |

|
#35
Tincher Dr
Versailles, KY 40383
|
1,452 sq. feet
|
2 baths 3 beds |
show details | |

|
#36
Fiddler Creek Way
Lexington, KY 40515
|
4,023 sq. feet
|
3 baths 4 beds |
show details | |

|
#37
Charles Ave
Lexington, KY 40508
|
1,360 sq. feet
|
2 baths 4 beds |
show details | |

|
#38
Hanover Dr
Versailles, KY 40383
|
2,458 sq. feet
|
2 baths 4 beds |
show details | |

|
#39
Nancy St
Versailles, KY 40383
|
1,080 sq. feet
|
1 baths 3 beds |
show details | |

|
#40
Lochdale Ter
Lexington, KY 40514
|
1,050 sq. feet
|
1 baths 2 beds |
show details |
| Photo | Address | Area | Beds / Baths | Price | Details |
|---|---|---|---|---|---|

|
#41
Ridge Rd
Harrodsburg, KY 40330
|
1,000 sq. feet
|
1 baths 3 beds |
show details | |

|
#42
Meadowcrest Park
Lexington, KY 40515
|
2,433 sq. feet
|
2 baths 4 beds |
show details | |

|
#43
Dylan Pl
Lexington, KY 40514
|
1,422 sq. feet
|
2 baths 2 beds |
show details | |

|
#44
Shun Pike
Nicholasville, KY 40356
|
1,215 sq. feet
|
1 baths 3 beds |
show details | |

|
#45
Hadlow St
Lexington, KY 40503
|
1,556 sq. feet
|
2 baths 3 beds |
show details | |

|
#46
Martin Luther King Jr Blvd
Versailles, KY 40383
|
1,085 sq. feet
|
1 baths 3 beds |
show details | |

|
#47
Moore Ln
Harrodsburg, KY 40330
|
2,560 sq. feet
|
2 baths 3 beds |
show details | |

|
#48
Logana Pike
Nicholasville, KY 40356
|
891 sq. feet
|
1 baths 2 beds |
show details | |

|
#49
Beech St
Versailles, KY 40383
|
910 sq. feet
|
1 baths 3 beds |
show details | |

|
Check over 1 million property listings on Foreclosure.com!
|
browse all offers | |||


- 5,36489.0%White alone
- 2394.0%Black alone
- 1742.9%Two or more races
- 1382.3%Other race alone
- 871.4%Hispanic
- 290.5%Asian alone
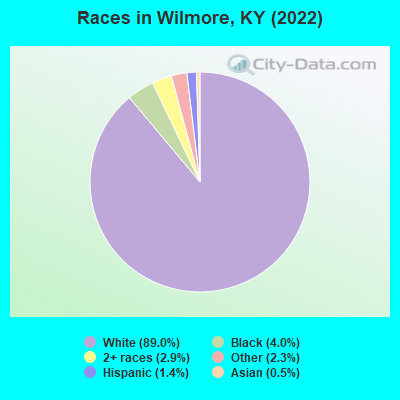
Races in Wilmore detailed stats: ancestries, foreign born residents, place of birth
According to our research of Kentucky and other state lists, there were 5 registered sex offenders living in Wilmore, Kentucky as of April 29, 2024.
The ratio of all residents to sex offenders in Wilmore is 1,243 to 1.
The ratio of registered sex offenders to all residents in this city is much lower than the state average.
Type |
2009 |
2010 |
2011 |
2012 |
2013 |
2014 |
2015 |
2016 |
2017 |
2018 |
2019 |
2020 |
2021 |
2022 |
|---|---|---|---|---|---|---|---|---|---|---|---|---|---|---|
| Murders (per 100,000) | 0 (0.0) | 0 (0.0) | 0 (0.0) | 0 (0.0) | 0 (0.0) | 0 (0.0) | 0 (0.0) | 0 (0.0) | 0 (0.0) | 0 (0.0) | 0 (0.0) | 0 (0.0) | 0 (0.0) | 0 (0.0) |
| Rapes (per 100,000) | 1 (16.6) | 0 (0.0) | 0 (0.0) | 0 (0.0) | 0 (0.0) | 4 (65.3) | 2 (32.4) | 1 (15.8) | 1 (15.7) | 3 (46.8) | 0 (0.0) | 0 (0.0) | 2 (31.3) | 1 (16.4) |
| Robberies (per 100,000) | 0 (0.0) | 0 (0.0) | 0 (0.0) | 0 (0.0) | 0 (0.0) | 0 (0.0) | 0 (0.0) | 0 (0.0) | 1 (15.7) | 1 (15.6) | 0 (0.0) | 0 (0.0) | 0 (0.0) | 1 (16.4) |
| Assaults (per 100,000) | 3 (49.9) | 0 (0.0) | 1 (26.9) | 1 (26.9) | 0 (0.0) | 2 (32.7) | 0 (0.0) | 0 (0.0) | 1 (15.7) | 1 (15.6) | 0 (0.0) | 1 (15.4) | 0 (0.0) | 0 (0.0) |
| Burglaries (per 100,000) | 16 (266.0) | 11 (298.4) | 32 (862.3) | 33 (887.1) | 22 (578.3) | 14 (228.6) | 21 (339.9) | 29 (459.2) | 22 (344.8) | 8 (124.9) | 3 (46.2) | 7 (107.8) | 14 (219.2) | 4 (65.8) |
| Thefts (per 100,000) | 124 (2,061) | 73 (1,980) | 81 (2,183) | 79 (2,124) | 26 (683.5) | 49 (800.1) | 35 (566.4) | 68 (1,077) | 112 (1,755) | 47 (733.7) | 66 (1,017) | 26 (400.2) | 30 (469.6) | 33 (542.7) |
| Auto thefts (per 100,000) | 10 (166.2) | 1 (27.1) | 6 (161.7) | 2 (53.8) | 1 (26.3) | 1 (16.3) | 3 (48.6) | 4 (63.3) | 9 (141.1) | 2 (31.2) | 9 (138.7) | 1 (15.4) | 3 (47.0) | 1 (16.4) |
| Arson (per 100,000) | 0 (0.0) | 1 (27.1) | 0 (0.0) | 0 (0.0) | 1 (26.3) | 0 (0.0) | 0 (0.0) | 0 (0.0) | 0 (0.0) | 0 (0.0) | 0 (0.0) | 1 (15.4) | 0 (0.0) | 0 (0.0) |
| City-Data.com crime index | 137.6 | 102.3 | 166.0 | 156.7 | 69.9 | 108.1 | 76.2 | 93.0 | 126.0 | 85.9 | 55.0 | 27.9 | 62.9 | 45.7 |
The City-Data.com crime index weighs serious crimes and violent crimes more heavily. Higher means more crime, U.S. average is 246.1. It adjusts for the number of visitors and daily workers commuting into cities.
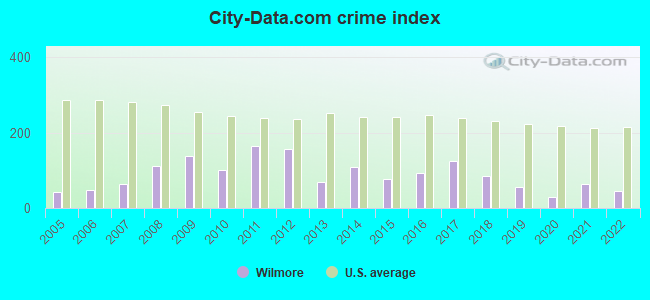
Crime rate in Wilmore detailed stats: murders, rapes, robberies, assaults, burglaries, thefts, arson
Full-time law enforcement employees in 2021, including police officers: 10 (9 officers - 9 male; 0 female).
| Officers per 1,000 residents here: | 1.41 |
| Kentucky average: | 1.89 |
 Recent articles from our blog. Our writers, many of them Ph.D. graduates or candidates, create easy-to-read articles on a wide variety of topics.


 | Can anyone give me a run down on each popular city in KY? The good, bad, and ugly of living in KY? (32 replies) |
| looking for a perfect place to call home in Kentucky (6 replies) |
| Spiritually there! (19 replies) |
| Visiting in July! (27 replies) |
| conservative couple leaving Washington State moving to KY (12 replies) |
| Conservative CA Family Relocating To KY (25 replies) |
Latest news from Wilmore, KY collected exclusively by city-data.com from local newspapers, TV, and radio stations
Ancestries: American (24.8%), English (15.8%), German (8.4%), European (6.1%), Irish (2.9%), Italian (2.3%).
Current Local Time: EST time zone
Incorporated on 10/26/1965
Elevation: 880 feet
Land area: 2.64 square miles.
Population density: 2,282 people per square mile (low).
387 residents are foreign born (2.9% Africa, 1.5% Europe, 1.0% Latin America, 0.8% Asia).
| This city: | 6.4% |
| Kentucky: | 4.1% |
Median real estate property taxes paid for housing units with mortgages in 2022: $1,670 (0.8%)
Median real estate property taxes paid for housing units with no mortgage in 2022: $2,026 (0.9%)
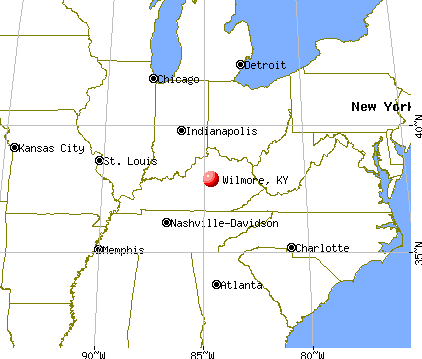
Nearest city with pop. 50,000+: Fayette, KY  (14.6 miles , pop. 260,512).
Nearest city with pop. 1,000,000+: Chicago, IL (318.4 miles , pop. 2,896,016).
Nearest cities:
), ), ), ), ), )Latitude: 37.86 N, Longitude: 84.66 W
Daytime population change due to commuting: -1,088 (-18.0%)
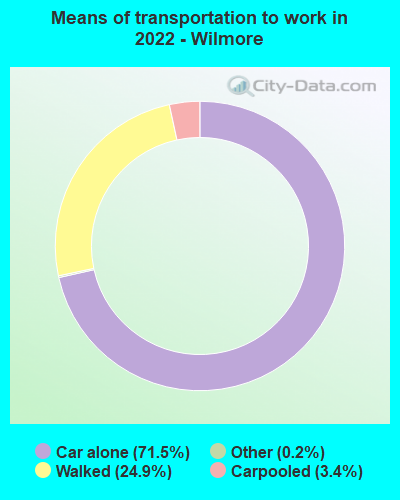
Workers who live and work in this city: 1,326 (41.2%)
Area code: 859
Wilmore, Kentucky accommodation & food services, waste management - Economy and Business Data
| Here: | 3.2% |
| Kentucky: | 3.8% |
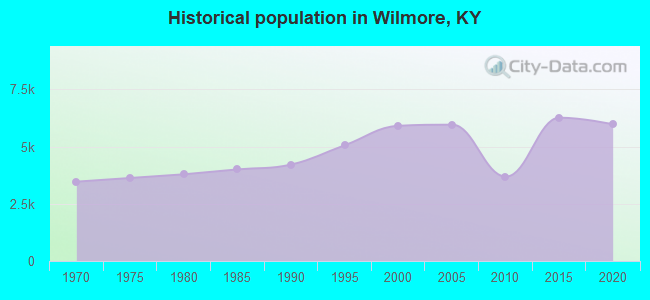
Population change in the 1990s: +1,650 (+38.8%).
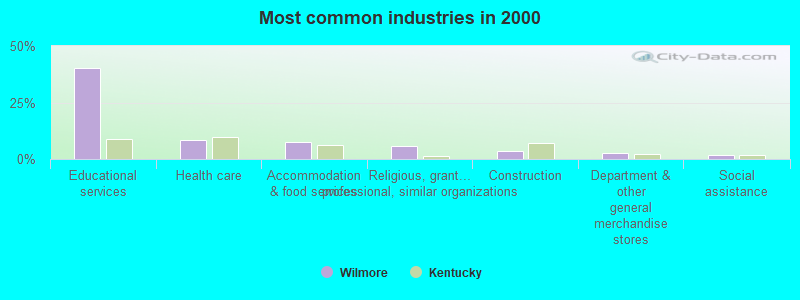
- Educational services (40.2%)
- Health care (8.6%)
- Accommodation & food services (7.6%)
- Religious, grantmaking, civic, professional, similar organizations (5.9%)
- Construction (3.7%)
- Department & other general merchandise stores (2.5%)
- Social assistance (2.0%)
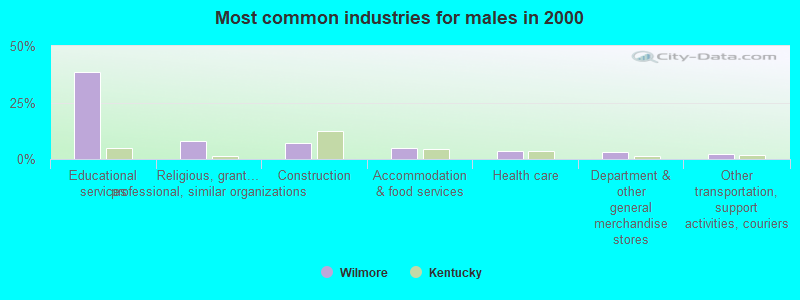
- Educational services (38.7%)
- Religious, grantmaking, civic, professional, similar organizations (8.1%)
- Construction (6.9%)
- Accommodation & food services (5.0%)
- Health care (3.7%)
- Department & other general merchandise stores (3.2%)
- Other transportation, support activities, couriers (2.3%)
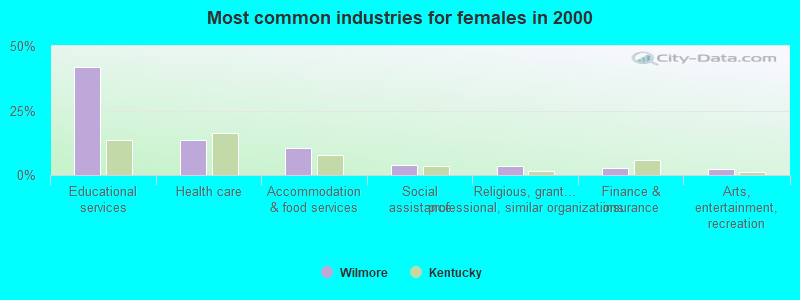
- Educational services (41.7%)
- Health care (13.6%)
- Accommodation & food services (10.3%)
- Social assistance (3.9%)
- Religious, grantmaking, civic, professional, similar organizations (3.6%)
- Finance & insurance (2.7%)
- Arts, entertainment, recreation (2.5%)

- Secretaries and administrative assistants (5.9%)
- Postsecondary teachers (5.7%)
- Building and grounds cleaning and maintenance occupations (5.3%)
- Other office and administrative support workers, including supervisors (4.7%)
- Other management occupations, except farmers and farm managers (4.4%)
- Preschool, kindergarten, elementary, and middle school teachers (4.3%)
- Religious workers (3.4%)

- Postsecondary teachers (8.4%)
- Religious workers (6.2%)
- Building and grounds cleaning and maintenance occupations (5.8%)
- Other management occupations, except farmers and farm managers (5.4%)
- Computer specialists (3.5%)
- Supervisors and other personal care and service workers, except child care workers (3.4%)
- Other office and administrative support workers, including supervisors (3.2%)

- Secretaries and administrative assistants (11.0%)
- Preschool, kindergarten, elementary, and middle school teachers (7.4%)
- Other office and administrative support workers, including supervisors (6.2%)
- Registered nurses (6.2%)
- Building and grounds cleaning and maintenance occupations (4.7%)
- Information and record clerks, except customer service representatives (3.7%)
- Child care workers (3.7%)
Average climate in Wilmore, Kentucky
Based on data reported by over 4,000 weather stations


|
|

(lower is better)
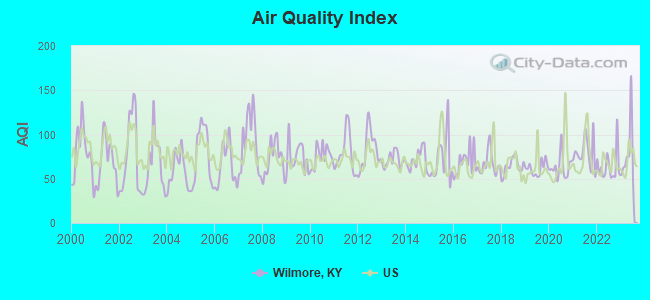
Air Quality Index (AQI) level in 2023 was 77.5. This is about average.
| City: | 77.5 |
| U.S.: | 72.6 |
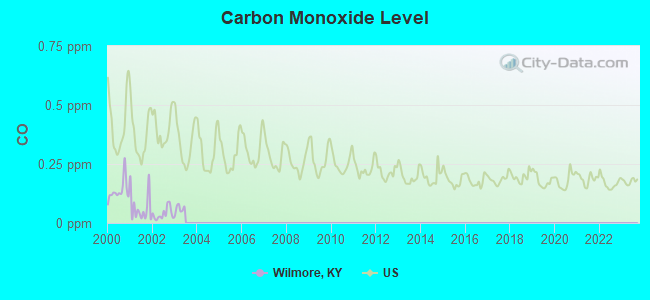
Carbon Monoxide (CO) [ppm] level in 2002 was 0.0391. This is significantly better than average. Closest monitor was 13.9 miles away from the city center.
| City: | 0.0391 |
| U.S.: | 0.2513 |
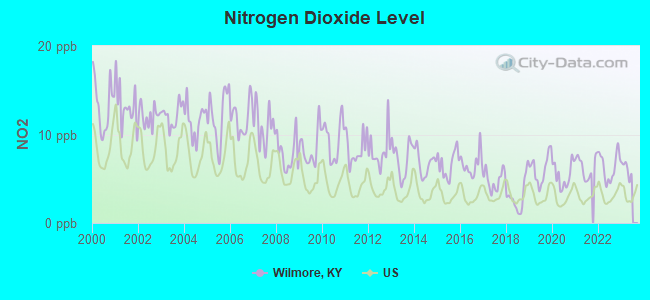
Nitrogen Dioxide (NO2) [ppb] level in 2022 was 6.38. This is worse than average. Closest monitor was 12.4 miles away from the city center.
| City: | 6.38 |
| U.S.: | 5.11 |
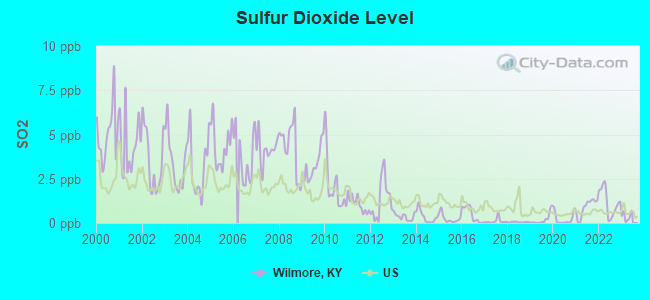
Sulfur Dioxide (SO2) [ppb] level in 2022 was 1.18. This is better than average. Closest monitor was 4.3 miles away from the city center.
| City: | 1.18 |
| U.S.: | 1.51 |
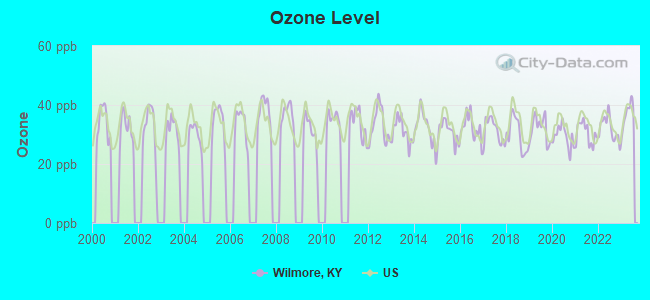
Ozone [ppb] level in 2023 was 36.9. This is about average. Closest monitor was 4.3 miles away from the city center.
| City: | 36.9 |
| U.S.: | 33.3 |
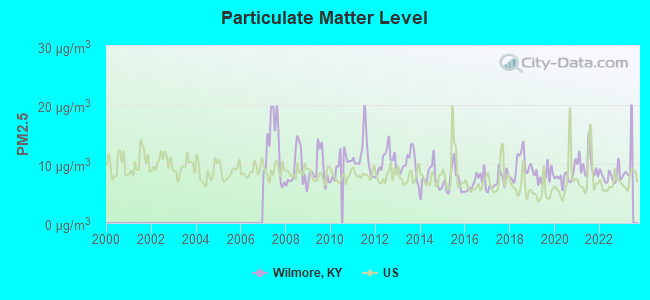
Particulate Matter (PM2.5) [µg/m3] level in 2022 was 7.97. This is about average. Closest monitor was 14.7 miles away from the city center.
| City: | 7.97 |
| U.S.: | 8.11 |
Tornado activity:
Wilmore-area historical tornado activity is near Kentucky state average. It is 32% greater than the overall U.S. average.
On 4/3/1974, a category F4 (max. wind speeds 207-260 mph) tornado 13.1 miles away from the Wilmore city center killed 7 people and injured 28 people.
On 4/3/1974, a category F4 tornado 25.9 miles away from the city center killed 4 people and injured 122 people and caused between $50,000 and $500,000 in damages.
Earthquake activity:
Wilmore-area historical earthquake activity is significantly above Kentucky state average. It is 80% greater than the overall U.S. average.On 7/27/1980 at 18:52:21, a magnitude 5.2 (5.1 MB, 4.7 MS, 5.0 UK, 5.2 UK, Class: Moderate, Intensity: VI - VII) earthquake occurred 45.6 miles away from Wilmore center
On 4/18/2008 at 09:36:59, a magnitude 5.4 (5.1 MB, 4.8 MS, 5.4 MW, 5.2 MW) earthquake occurred 180.2 miles away from the city center
On 9/7/1988 at 02:28:09, a magnitude 4.6 (4.5 MB, 4.6 LG, Class: Light, Intensity: IV - V) earthquake occurred 46.7 miles away from Wilmore center
On 4/18/2008 at 09:36:59, a magnitude 5.2 (5.2 MW, Depth: 8.9 mi) earthquake occurred 180.2 miles away from Wilmore center
On 6/10/1987 at 23:48:54, a magnitude 5.1 (4.9 MB, 4.4 MS, 4.6 MS, 5.1 LG) earthquake occurred 187.2 miles away from Wilmore center
On 6/18/2002 at 17:37:15, a magnitude 5.0 (4.3 MB, 4.6 MW, 5.0 LG) earthquake occurred 170.6 miles away from the city center
Magnitude types: regional Lg-wave magnitude (LG), body-wave magnitude (MB), surface-wave magnitude (MS), moment magnitude (MW)
Natural disasters:
The number of natural disasters in Jessamine County (17) is near the US average (15).Major Disasters (Presidential) Declared: 13
Emergencies Declared: 3
Causes of natural disasters: Storms: 9, Floods: 8, Tornadoes: 5, Winter Storms: 5, Mudslides: 3, Blizzard: 1, Freeze: 1, Hurricane: 1, Landslide: 1, Snow: 1, Snowfall: 1, Snowstorm: 1, Other: 1 (Note: some incidents may be assigned to more than one category).
Hospitals and medical centers in Wilmore:
Other hospitals and medical centers near Wilmore:
- JESSAMINE CO HOSPICE (Hospital, about 5 miles away; NICHOLASVILLE, KY)
- ROYAL MANOR (Nursing Home, about 6 miles away; NICHOLASVILLE, KY)
- HARRODSBURG HEALTH CARE MANOR (Nursing Home, about 12 miles away; HARRODSBURG, KY)
- KINDRED NURSING AND REHABILITATION-HARRODSBURG (Nursing Home, about 12 miles away; HARRODSBURG, KY)
- SAYRE CHRISTIAN VILLAGE (Nursing Home, about 12 miles away; LEXINGTON, KY)
- SAYRE CHRISTIAN VILLAGE NURSING HOME (Nursing Home, about 12 miles away; LEXINGTON, KY)
- TANBARK HEALTH CARE CENTER (Nursing Home, about 12 miles away; LEXINGTON, KY)
Colleges/Universities in Wilmore:
- Asbury University (Full-time enrollment: 1,599; Location: 1 Macklem Dr; Private, not-for-profit; Website: www.asbury.edu; Offers Master's degree)
- Asbury Theological Seminary (Full-time enrollment: 1,045; Location: 204 N Lexington Ave; Private, not-for-profit; Website: www.asburyseminary.edu; Offers Doctor's degree)
Colleges/universities with over 2000 students nearest to Wilmore:
- Bluegrass Community and Technical College (about 15 miles; Lexington, KY; Full-time enrollment: 8,560)
- University of Kentucky (about 15 miles; Lexington, KY; FT enrollment: 23,517)
- Eastern Kentucky University (about 22 miles; Richmond, KY; FT enrollment: 13,525)
- Kentucky State University (about 26 miles; Frankfort, KY; FT enrollment: 2,112)
- Campbellsville University (about 53 miles; Campbellsville, KY; FT enrollment: 2,948)
- Somerset Community College (about 56 miles; Somerset, KY; FT enrollment: 4,698)
- Sullivan University (about 61 miles; Louisville, KY; FT enrollment: 5,129)
Public high school in Wilmore:
- THE PROVIDENCE SCHOOL (Students: 116, Location: 210 S. LEXINGTON AVE, Grades: 6-12)
Public elementary/middle school in Wilmore:
- WILMORE ELEMENTARY SCHOOL (Students: 605, Location: 150 CAMPGROUND LN, Grades: 1-5)
User-submitted facts and corrections:
- Jessamine Early Learning Village is only PK-K,there is no third grade there any more
- Jessamine Christian Helathcare 200 Rice Street Wilmore KY 858-9355 "Family Medicine with the focus on Christ"
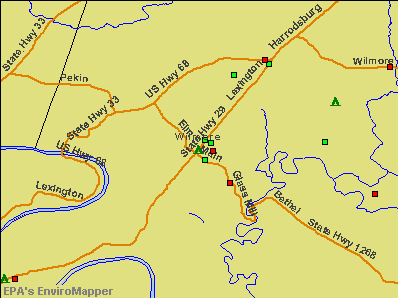
Points of interest:
Notable locations in Wilmore: New Jessamine County Fire Station (A), Wilmore City Fire Department (B). Display/hide their locations on the map
Drinking water stations with addresses in Wilmore and their reported violations in the past:
WILMORE WATER WORKS (Population served: 5,652, Surface water):Past health violations:COBLE VILLAGE MHP (Serves OH, Population served: 90, Groundwater):Past monitoring violations:
- MCL, Average - Between APR-2006 and JUN-2006, Contaminant: TTHM. Follow-up actions: St Public Notif requested (SEP-25-2006), St Formal NOV issued (SEP-25-2006), St Public Notif received (OCT-23-2006), St Compliance achieved (NOV-17-2006)
- Follow-up Or Routine LCR Tap M/R - In OCT-01-2004, Contaminant: Lead and Copper Rule. Follow-up actions: St Public Notif requested (FEB-24-2005), St Formal NOV issued (FEB-24-2005), St Public Notif received (MAR-28-2005), St Compliance achieved (MAY-09-2005)
- 49 regular monitoring violations
Past monitoring violations:
- Follow-up Or Routine LCR Tap M/R - In OCT-01-2004, Contaminant: Lead and Copper Rule. Follow-up actions: St Public Notif requested (APR-05-2005), St Violation/Reminder Notice (APR-05-2005), St Public Notif received (APR-21-2005), St Compliance achieved (JUN-14-2005)
- One regular monitoring violation
| This city: | 2.4 people |
| Kentucky: | 2.5 people |
| This city: | 66.3% |
| Whole state: | 66.9% |
| This city: | 2.9% |
| Whole state: | 6.4% |
Likely homosexual households (counted as self-reported same-sex unmarried-partner households)
- Lesbian couples: 0.4% of all households
- Gay men: 0.2% of all households
1,190 people in college dormitories (includes college quarters off campus) in 2000
303 people in nursing homes in 2000
Banks with branches in Wilmore (2011 data):
- The Farmers Bank: Wilmore Branch at 213 East Main Street, branch established on 1935/02/06. Info updated 2006/11/03: Bank assets: $101.0 mil, Deposits: $87.2 mil, headquarters in Nicholasville, KY, positive income, Commercial Lending Specialization, 4 total offices, Holding Company: Farmers Bancorp Of Nicholasville, Inc.
- Kentucky Bank: Wilmore Branch at 108 East Main Street, branch established on 1965/02/13. Info updated 2007/12/21: Bank assets: $659.7 mil, Deposits: $543.1 mil, headquarters in Paris, KY, positive income, 14 total offices, Holding Company: Kentucky Bancshares, Inc.
- United Bank & Trust Company: Wilmore Branch at 106 Lexington Avenue, branch established on 1999/05/17. Info updated 2011/08/22: Bank assets: $582.2 mil, Deposits: $422.6 mil, headquarters in Versailles, KY, negative income in the last year, Commercial Lending Specialization, 13 total offices, Holding Company: Farmers Capital Bank Corporation
- First Southern National Bank: Wilmore Branch at 201 East Main Street, branch established on 2008/05/01. Info updated 2011/04/18: Bank assets: $675.9 mil, Deposits: $573.0 mil, headquarters in Lancaster, KY, positive income, Commercial Lending Specialization, 22 total offices, Holding Company: First Southern Bancorp, Inc.
For population 15 years and over in Wilmore:
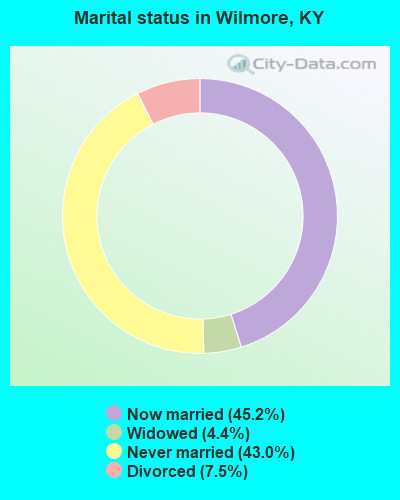
- Never married: 43.0%
- Now married: 45.2%
- Separated: 0.0%
- Widowed: 4.4%
- Divorced: 7.5%
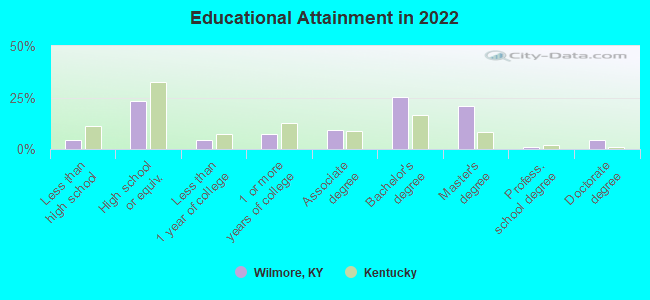
For population 25 years and over in Wilmore:
- High school or higher: 95.1%
- Bachelor's degree or higher: 49.5%
- Graduate or professional degree: 25.4%
- Unemployed: 5.9%
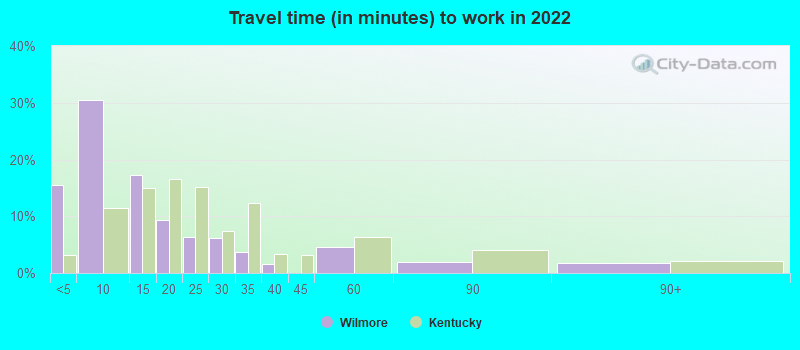
- Mean travel time to work (commute): 17.9 minutes
| Here: | 10.6 |
| Kentucky average: | 11.7 |
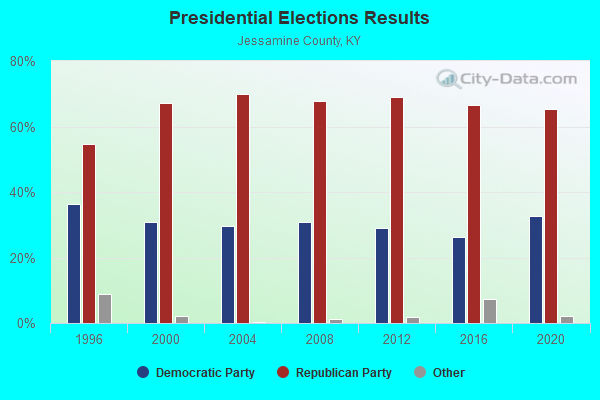
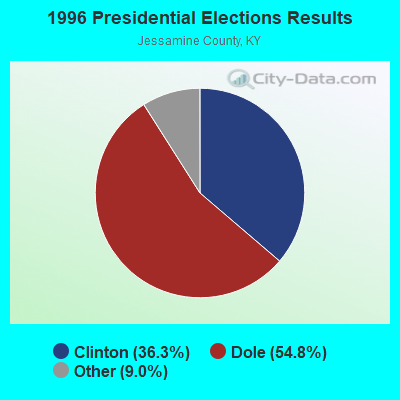


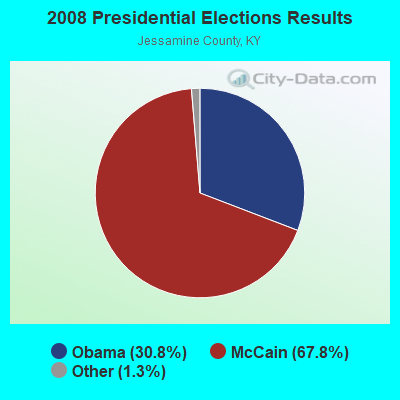
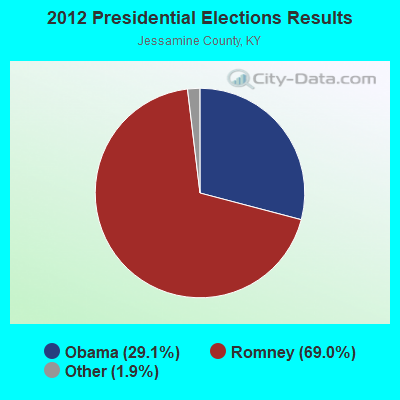
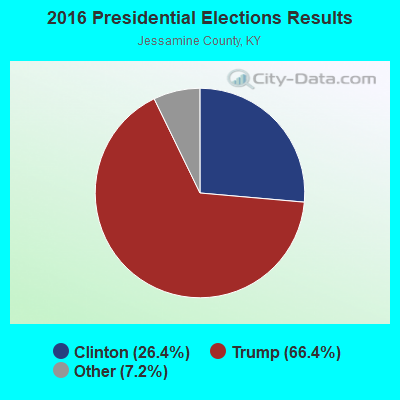
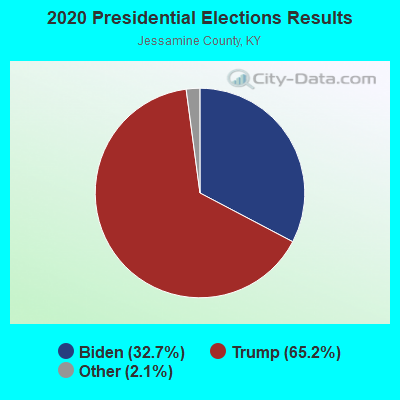
Graphs represent county-level data. Detailed 2008 Election Results
Religion statistics for Wilmore, KY (based on Jessamine County data)
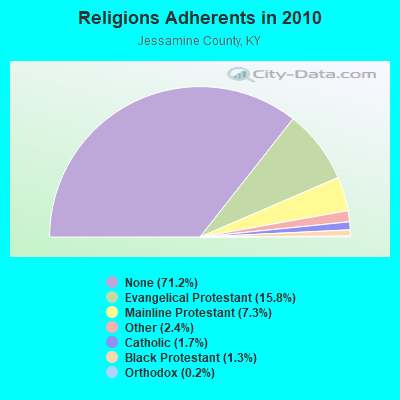
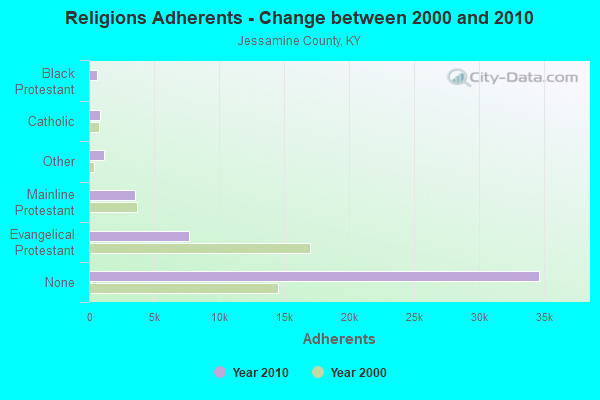
| Religion | Adherents | Congregations |
|---|---|---|
| Evangelical Protestant | 7,679 | 31 |
| Mainline Protestant | 3,553 | 15 |
| Other | 1,173 | 3 |
| Catholic | 820 | 1 |
| Black Protestant | 626 | 2 |
| Orthodox | 120 | 1 |
| None | 34,615 | - |
Food Environment Statistics:
| This county: | 1.10 / 10,000 pop. |
| Kentucky: | 2.19 / 10,000 pop. |
| Jessamine County: | 0.22 / 10,000 pop. |
| State: | 0.25 / 10,000 pop. |
| Jessamine County: | 0.66 / 10,000 pop. |
| Kentucky: | 0.74 / 10,000 pop. |
| Jessamine County: | 3.95 / 10,000 pop. |
| Kentucky: | 4.36 / 10,000 pop. |
| This county: | 4.83 / 10,000 pop. |
| Kentucky: | 5.74 / 10,000 pop. |
| Here: | 10.9% |
| Kentucky: | 11.0% |
| This county: | 25.8% |
| Kentucky: | 30.0% |
| Jessamine County: | 11.8% |
| Kentucky: | 15.9% |
Health and Nutrition:
| This city: | 51.2% |
| Kentucky: | 49.9% |
| Here: | 51.0% |
| State: | 47.0% |
| Here: | 27.4 |
| Kentucky: | 28.6 |
| Here: | 18.0% |
| Kentucky: | 21.0% |
| Here: | 8.7% |
| State: | 10.1% |
| Wilmore: | 6.9 |
| Kentucky: | 6.8 |
| This city: | 27.4% |
| Kentucky: | 33.8% |
| Wilmore: | 60.5% |
| Kentucky: | 56.8% |
| Here: | 81.3% |
| Kentucky: | 78.9% |
More about Health and Nutrition of Wilmore, KY Residents
| Local government employment and payroll (March 2022) | |||||
| Function | Full-time employees | Monthly full-time payroll | Average yearly full-time wage | Part-time employees | Monthly part-time payroll |
|---|---|---|---|---|---|
| Police Protection - Officers | 8 | $44,714 | $67,071 | 0 | $0 |
| Water Supply | 7 | $48,212 | $82,649 | 0 | $0 |
| Streets and Highways | 6 | $23,221 | $46,442 | 1 | $1,937 |
| Solid Waste Management | 3 | $9,163 | $36,652 | 0 | $0 |
| Financial Administration | 2 | $10,754 | $64,524 | 0 | $0 |
| Other Government Administration | 1 | $6,842 | $82,104 | 11 | $11,760 |
| Parks and Recreation | 1 | $4,897 | $58,764 | 11 | $4,843 |
| Police - Other | 1 | $4,441 | $53,292 | 0 | $0 |
| Firefighters | 0 | $0 | 23 | $7,922 | |
| Housing and Community Development (Local) | 0 | $0 | 1 | $2,935 | |
| Totals for Government | 29 | $152,244 | $62,998 | 47 | $29,397 |
Wilmore government finances - Expenditure in 2021 (per resident):
- Current Operations - Water Utilities: $923,000 ($153.40)
Sewerage: $900,000 ($149.58)
Police Protection: $842,000 ($139.94)
Regular Highways: $547,000 ($90.91)
Central Staff Services: $491,000 ($81.60)
Solid Waste Management: $412,000 ($68.47)
Parks and Recreation: $207,000 ($34.40)
Local Fire Protection: $172,000 ($28.59)
Housing and Community Development: $52,000 ($8.64)
Miscellaneous Commercial Activities - Other: $50,000 ($8.31)
- General - Interest on Debt: $725,000 ($120.49)
- Intergovernmental to Local - Other - General - Other: $69,000 ($11.47)
- Other Capital Outlay - Water Utilities: $89,000 ($14.79)
Sewerage: $80,000 ($13.30)
Central Staff Services: $49,000 ($8.14)
Local Fire Protection: $27,000 ($4.49)
Police Protection: $17,000 ($2.83)
Regular Highways: $13,000 ($2.16)
Solid Waste Management: $3,000 ($0.50)
- Total Salaries and Wages: $1,745,000 ($290.01)
Wilmore government finances - Revenue in 2021 (per resident):
- Charges - Sewerage: $844,000 ($140.27)
Solid Waste Management: $423,000 ($70.30)
Parks and Recreation: $131,000 ($21.77)
Other: $10,000 ($1.66)
- Federal Intergovernmental - Other: $383,000 ($63.65)
- Local Intergovernmental - Highways: $5,000 ($0.83)
Housing and Community Development: $2,000 ($0.33)
Other: $1,000 ($0.17)
- Miscellaneous - Sale of Property: $243,000 ($40.39)
Rents: $18,000 ($2.99)
Interest Earnings: $12,000 ($1.99)
Fines and Forfeits: $2,000 ($0.33)
- Revenue - Water Utilities: $898,000 ($149.24)
- State Intergovernmental - Other: $452,000 ($75.12)
Sewerage: $76,000 ($12.63)
Highways: $71,000 ($11.80)
- Tax - Individual Income: $1,143,000 ($189.96)
Property: $609,000 ($101.21)
Insurance Premiums Sales: $525,000 ($87.25)
Public Utilities Sales: $173,000 ($28.75)
Corporation Net Income: $88,000 ($14.63)
Other License: $30,000 ($4.99)
Occupation and Business License - Other: $15,000 ($2.49)
Wilmore government finances - Debt in 2021 (per resident):
- Long Term Debt - Beginning Outstanding - Unspecified Public Purpose: $18,127,000 ($3012.63)
Outstanding Unspecified Public Purpose: $17,129,000 ($2846.77)
Retired Unspecified Public Purpose: $998,000 ($165.86)
Wilmore government finances - Cash and Securities in 2021 (per resident):
- Other Funds - Cash and Securities: $5,177,000 ($860.40)
Businesses in Wilmore, KY
- Subway: 1
- U-Haul: 1
Strongest AM radio stations in Wilmore:
- WVLK (590 AM; 5 kW; LEXINGTON, KY; Owner: CUMULUS LICENSING CORP.)
- WCGW (770 AM; daytime; 1 kW; NICHOLASVILLE, KY; Owner: MORTENSON BROADCASTING COMPANY)
- WHAS (840 AM; 50 kW; LOUISVILLE, KY; Owner: CLEAR CHANNEL BROADCASTING LICENSES, INC.)
- WLAP (630 AM; 5 kW; LEXINGTON, KY; Owner: CITICASTERS LICENSES, L.P.)
- WXRA (1580 AM; 10 kW; GEORGETOWN, KY; Owner: CITICASTERS LICENSES, L.P.)
- WWFT (1250 AM; 0 kW; NICHOLASVILLE, KY)
- WLXG (1300 AM; 2 kW; LEXINGTON, KY; Owner: L.M. COMMUNICATIONS, INC)
- WLW (700 AM; 50 kW; CINCINNATI, OH; Owner: JACOR BROADCASTING CORPORATION)
- WSAI (1530 AM; 50 kW; CINCINNATI, OH; Owner: JACOR BROADCASTING CORPORATION)
- WHBN (1420 AM; 1 kW; HARRODSBURG, KY; Owner: MORTENSON BROADCASTING COMPANY OF KE)
- WHIR (1230 AM; 1 kW; DANVILLE, KY; Owner: HOMETOWN B/CSTNG OF DANVILLE, INC.)
- WKVL (850 AM; daytime; 50 kW; KNOXVILLE, TN; Owner: HORNE RADIO, LLC)
- WTVN (610 AM; 50 kW; COLUMBUS, OH; Owner: CITICASTERS LICENSES, L.P.)
Strongest FM radio stations in Wilmore:
- WJMM-FM (99.3 FM; HARRODSBURG, KY; Owner: MORTENSON BROADCASTING COMPANY OF CENTRAL KENTUCKY, LLC)
- WUKY (91.3 FM; LEXINGTON, KY; Owner: BD. OF TRUSTEES UNIV. OF KENTUCKY)
- WLTO (102.5 FM; NICHOLASVILLE, KY; Owner: CUMULUS LICENSING CORP.)
- WVRB (95.3 FM; WILMORE, KY; Owner: VERNON R. BALDWIN, INC.)
- WHIR-FM (107.1 FM; DANVILLE, KY; Owner: CLEAR CHANNEL BROADCASTING LICENSES, INC.)
- WVLK-FM (92.9 FM; LEXINGTON, KY; Owner: CUMULUS LICENSING CORP.)
- WEKU (88.9 FM; RICHMOND, KY; Owner: EASTERN KENTUCKY UNIVERSITY)
- WXZZ (103.3 FM; GEORGETOWN, KY; Owner: CUMULUS LICENSING CORP.)
- WBUL-FM (98.1 FM; LEXINGTON, KY; Owner: CITICASTERS LICENSES, L.P.)
- WLRO (101.5 FM; RICHMOND, KY; Owner: CUMULUS LICENSING CORP.)
- WCDA (106.3 FM; VERSAILLES, KY; Owner: L.M. COMMUNICATIONS, INC)
- WMXL (94.5 FM; LEXINGTON, KY; Owner: CITICASTERS LICENSES, INC.)
- WKQQ (100.1 FM; WINCHESTER, KY; Owner: CITICASTERS LICENSES, L.P.)
- WXKY-FM (96.3 FM; STANFORD, KY; Owner: LINCOLN-GARRARD BROADCASTING CO.,INC)
- WRFL (88.1 FM; LEXINGTON, KY; Owner: UN OF KENTUCKY BD OF TRUSTEES)
- WKYL (102.1 FM; LAWRENCEBURG, KY; Owner: DAVENPORT BROADCASTING, INC.)
- WCYO (100.7 FM; IRVINE, KY; Owner: KENTUCKY RIVER BROADCASTING CO.)
- WLKT (104.5 FM; LEXINGTON-FAYETTE, KY; Owner: CITICASTERS LICENSES, L.P.)
- WGKS (96.9 FM; PARIS, KY; Owner: L.M. COMMUNICATIONS, INC.)
- WRNZ (105.1 FM; LANCASTER, KY; Owner: HOMETOWN BROADCASTING OF LANCASTER, INC.)
TV broadcast stations around Wilmore:
- WDKY-TV (Channel 56; DANVILLE, KY; Owner: WDKY LICENSEE, LLC)
- WKYT-TV (Channel 27; LEXINGTON, KY; Owner: WKYT LICENSEE CORP.)
- WTVQ-TV (Channel 36; LEXINGTON, KY; Owner: MEDIA GENERAL COMMUNICATIONS, INC.)
- WKLE (Channel 46; LEXINGTON, KY; Owner: KENTUCKY AUTHORITY FOR EDUCATIONAL TV)
- WLEX-TV (Channel 18; LEXINGTON, KY; Owner: WLEX COMMUNICATIONS, L.L.C.)
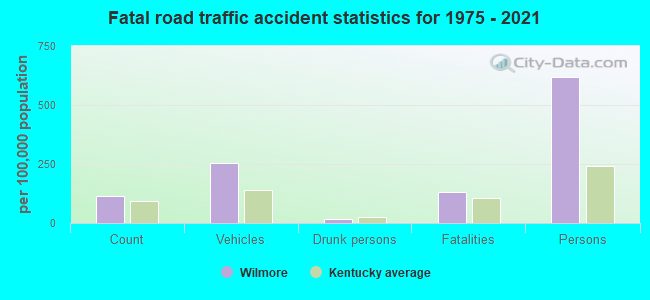
Wilmore fatal accident list:
Oct 26, 2019 02:54 PM, Us-68, Lexington Rd, Lat: 37.888603, Lon: -84.640003, Vehicles: 2, Persons: 6, Fatalities: 1
May 31, 1981 07:15 PM, Vehicles: 1, Persons: 2, Fatalities: 1
May 2, 1976 07:35 PM, Vehicles: 3, Persons: 8, Fatalities: 1
May 2, 1975 07:35 PM, Vehicles: 3, Persons: 8, Fatalities: 1
- National Bridge Inventory (NBI) Statistics
- 14Number of bridges
- 115ft / 35.3mTotal length
- $1,089,000Total costs
- 15,197Total average daily traffic
- 34Total average daily truck traffic
- 13,569Total future (year 2026) average daily traffic
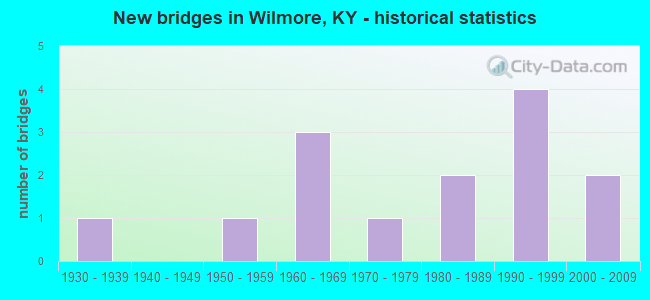
- New bridges - historical statistics
- 11930-1939
- 11950-1959
- 31960-1969
- 11970-1979
- 21980-1989
- 41990-1999
- 22000-2009
FCC Registered Cell Phone Towers:
1 (See the full list of FCC Registered Cell Phone Towers in Wilmore)FCC Registered Antenna Towers:
56 (See the full list of FCC Registered Antenna Towers)FCC Registered Broadcast Land Mobile Towers:
3- Mobiles Loc 1, Lat: 37.844722 Lon: -84.676111, Call Sign: KCS718,
Assigned Frequencies: 160.245 MHz, 160.830 MHz, 160.950 MHz, 160.515 MHz, 160.965 MHz, Grant Date: 07/12/2022, Expiration Date: 07/07/2032, Registrant: Norfolk Southern Railway Company, 650 W Peachtree St, Nw Box 41, Atlanta, GA 30308, Phone: (404) 660-4050, Email:
- Wilmore Detector, Wilmore Detector, 330 East Main Street, Near Rr Mp 098.75 (Lat: 37.853333 Lon: -84.659694), Type: Pipe, Structure height: 2.5 m, Overall height: 6.7 m, Call Sign: WNMC874,
Assigned Frequencies: 160.950 MHz, 160.950 MHz, Grant Date: 01/07/2022, Expiration Date: 01/09/2032, Registrant: Norfolk Southern Railway Company, 650 West Peachtree St, Nw, Box 41, Atlanta, GA 30308, Phone: (404) 660-4050, Fax: (404) 582-6209, Email:
- 9520 Harrodsburg Rd (Lat: 37.883000 Lon: -84.666778), Call Sign: WPXK802, Licensee ID: L00634076,
Assigned Frequencies: 153.575 MHz, 153.635 MHz, 153.665 MHz, Grant Date: 04/24/2003, Expiration Date: 04/24/2013, Cancellation Date: 06/29/2013, Certifier: William B Barber, Registrant: Ichthus Ministries Inc, 201 S Lexington Ave, Wilmore, KY 40390, Phone: (859) 858-3001, Fax: (859) 858-2886
FCC Registered Microwave Towers:
1- Wilmore, Along Cno & Tp Railway Tracks 1 Mi S Of (Lat: 37.844722 Lon: -84.676139), Type: Ltower, Structure height: 87.7 m, Overall height: 88.7 m, Call Sign: KBQ88,
Assigned Frequencies: 6345.49 MHz, 6226.89 MHz, Grant Date: 05/08/2021, Expiration Date: 06/20/2031, Registrant: Norfolk Southern, 650 West Peachtree St Nw, Atlanta, GA 30308, Phone: (404) 582-6244, Email:
FCC Registered Amateur Radio Licenses:
35 (See the full list of FCC Registered Amateur Radio Licenses in Wilmore)FAA Registered Aircraft:
7- Aircraft: BEECH 95-A55 (Category: Land, Engines: 2, Seats: 6, Weight: Up to 12,499 Pounds, Speed: 165 mph), Engine: CONT MOTOR I0-470 SERIES (260 HP) (Reciprocating)
N-Number: 1531Z, N1531Z, N-1531Z, Serial Number: TC-205, Year manufactured: 1961, Airworthiness Date: 11/07/1961, Certificate Issue Date: 09/20/2007
Registrant (Individual): Max D Iii Hammond, 304 Corbitt Dr, Wilmore, KY 40390 - Aircraft: CESSNA 150E (Category: Land, Seats: 2, Weight: Up to 12,499 Pounds, Speed: 90 mph), Engine: CONT MOTOR 0-200 SERIES (100 HP) (Reciprocating)
N-Number: 3018J, N3018J, N-3018J, Serial Number: 15061118, Airworthiness Date: 01/16/1965, Certificate Issue Date: 11/29/2017
Registrant (Individual): Stephen W Barney, 517 Talbott Dr, Wilmore, KY 40390 - Aircraft: AIR CREATION BUGGY 503 SL (Category: Land, Seats: 2, Weight: Up to 12,499 Pounds), Engine: ROTAX 503 SERIES (52 HP) (2 Cycle)
N-Number: 5182W, N5182W, N-5182W, Serial Number: T99015, Year manufactured: 1999, Airworthiness Date: 08/29/2007, Certificate Issue Date: 12/03/2020
Registrant (Individual): Andrew S Wolford, 519 W Margaret Dr, Wilmore, KY 40390 - Aircraft: BUCKEYE AVIATION INC EAGLE (Category: Land, Weight: Up to 12,499 Pounds), Engine: ROTAX 503 SERIES (52 HP) (2 Cycle)
N-Number: 30623, N30623, N-30623, Serial Number: 4984, Year manufactured: 2000, Airworthiness Date: 04/23/2007, Certificate Issue Date: 07/25/2012
Registrant (Individual): Beau W Brown, 3705 High Bridge Rd, Wilmore, KY 40390 - Aircraft: BUCKEYE AVIATION INC DREAM MACHINE (Category: Land, Seats: 2, Weight: Up to 12,499 Pounds), Engine: ROTAX 582SER (65 HP) (2 Cycle)
N-Number: 31753, N31753, N-31753, Serial Number: 6166, Year manufactured: 2001, Airworthiness Date: 12/12/2009, Certificate Issue Date: 06/15/2010
Registrant (Corporation): Brown Beau W, 3705 High Bridge Rd, Wilmore, KY 40390
Deregistered: Cancel Date: 01/03/2018 - Aircraft: CESSNA 172 (Category: Land, Seats: 4, Weight: Up to 12,499 Pounds, Speed: 105 mph), Engine: CONT MOTOR 0-300 SER (145 HP) (Reciprocating)
N-Number: 573RJ, N573RJ, N-573RJ, Serial Number: 29007, Year manufactured: 1956, Airworthiness Date: 08/28/1956
Registrant (Individual): Reported Sale, 2542 Mccauley Rd, Wilmore, KY 40390
Deregistered: Cancel Date: 05/30/2018 - Aircraft: CESSNA 140 (Category: Land, Seats: 2, Weight: Up to 12,499 Pounds, Speed: 105 mph), Engine: CONT MOTOR C85 SERIES (85 HP) (Reciprocating)
N-Number: 72102, N72102, N-72102, Serial Number: 9267, Year manufactured: 1946
Registrant (Individual): Edwin W Moran, Box 43, Wilmore, KY 40390
Deregistered: Cancel Date: 11/21/2017
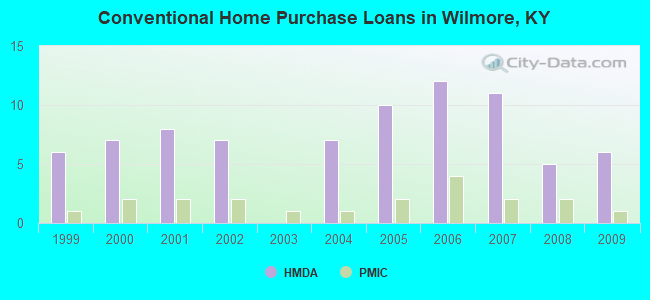
| Home Mortgage Disclosure Act Aggregated Statistics For Year 2009 (Based on 1 partial tract) | ||||||||||
| A) FHA, FSA/RHS & VA Home Purchase Loans | B) Conventional Home Purchase Loans | C) Refinancings | D) Home Improvement Loans | F) Non-occupant Loans on < 5 Family Dwellings (A B C & D) | ||||||
|---|---|---|---|---|---|---|---|---|---|---|
| Number | Average Value | Number | Average Value | Number | Average Value | Number | Average Value | Number | Average Value | |
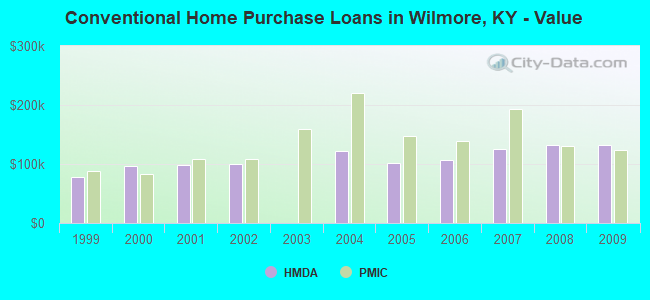
| LOANS ORIGINATED | 2 | $145,315 | 6 | $133,030 | 14 | $163,514 | 1 | $32,280 | 3 | $96,910 |
| APPLICATIONS APPROVED, NOT ACCEPTED | 0 | $0 | 0 | $0 | 1 | $99,620 | 0 | $0 | 0 | $0 |
| APPLICATIONS DENIED | 0 | $0 | 1 | $133,850 | 5 | $187,868 | 0 | $0 | 0 | $0 |
| APPLICATIONS WITHDRAWN | 0 | $0 | 0 | $0 | 3 | $152,223 | 0 | $0 | 0 | $0 |
| FILES CLOSED FOR INCOMPLETENESS | 0 | $0 | 0 | $0 | 1 | $191,570 | 0 | $0 | 0 | $0 |
Detailed HMDA statistics for the following Tracts: 0604.00
| Private Mortgage Insurance Companies Aggregated Statistics For Year 2009 (Based on 1 partial tract) | ||||
| A) Conventional Home Purchase Loans | B) Refinancings | |||
|---|---|---|---|---|
| Number | Average Value | Number | Average Value | |
| LOANS ORIGINATED | 1 | $124,230 | 1 | $141,530 |
| APPLICATIONS APPROVED, NOT ACCEPTED | 0 | $0 | 0 | $0 |
| APPLICATIONS DENIED | 0 | $0 | 0 | $0 |
| APPLICATIONS WITHDRAWN | 0 | $0 | 0 | $0 |
| FILES CLOSED FOR INCOMPLETENESS | 0 | $0 | 0 | $0 |
Detailed PMIC statistics for the following Tracts: 0604.00
2004 - 2018 National Fire Incident Reporting System (NFIRS) incidents
- Fire incident types reported to NFIRS in Wilmore, KY
- 7744.0%Outside Fires
- 7542.9%Structure Fires
- 1810.3%Mobile Property/Vehicle Fires
- 52.9%Other
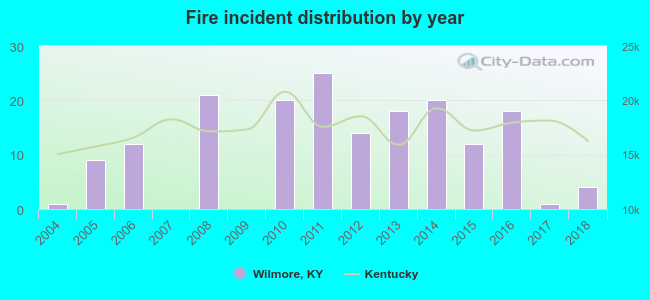 Based on the data from the years 2004 - 2018 the average number of fires per year is 12. The highest number of fire incidents - 25 took place in 2011, and the least - 0 in 2007. The data has an increasing trend.
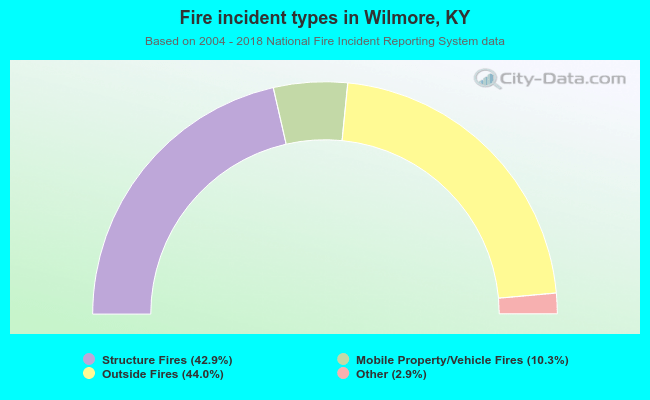 When looking into fire subcategories, the most reports belonged to: Outside Fires (44.0%), and Structure Fires (42.9%).
| Most common first names in Wilmore, KY among deceased individuals | ||
| Name | Count | Lived (average) |
|---|---|---|
| John | 51 | 77.3 years |
| William | 36 | 76.5 years |
| James | 34 | 75.0 years |
| Robert | 30 | 79.3 years |
| Mary | 27 | 80.8 years |
| Charles | 19 | 78.1 years |
| George | 16 | 79.2 years |
| Thomas | 14 | 72.0 years |
| Paul | 12 | 73.5 years |
| Edward | 12 | 78.1 years |
| Most common last names in Wilmore, KY among deceased individuals | ||
| Last name | Count | Lived (average) |
|---|---|---|
| Smith | 21 | 77.7 years |
| Johnson | 15 | 71.8 years |
| Houp | 14 | 77.7 years |
| West | 14 | 74.2 years |
| Reynolds | 13 | 80.7 years |
| Wells | 10 | 82.3 years |
| Horton | 9 | 75.7 years |
| Rhorer | 8 | 77.3 years |
| Mcmillen | 8 | 84.1 years |
| Crouse | 8 | 84.3 years |
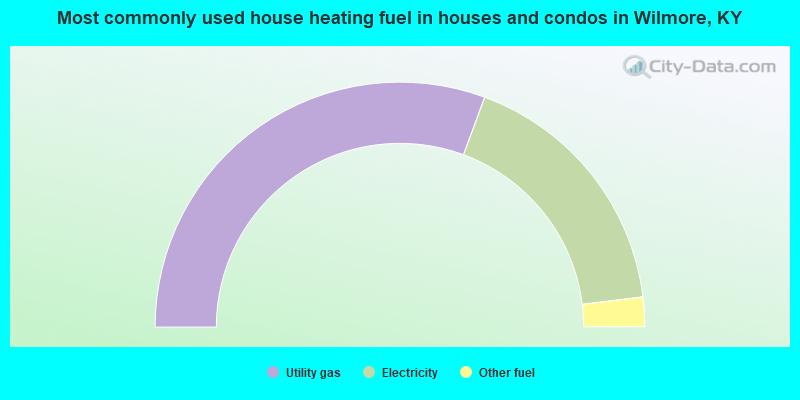
- 61.2%Utility gas
- 34.8%Electricity
- 3.9%Other fuel
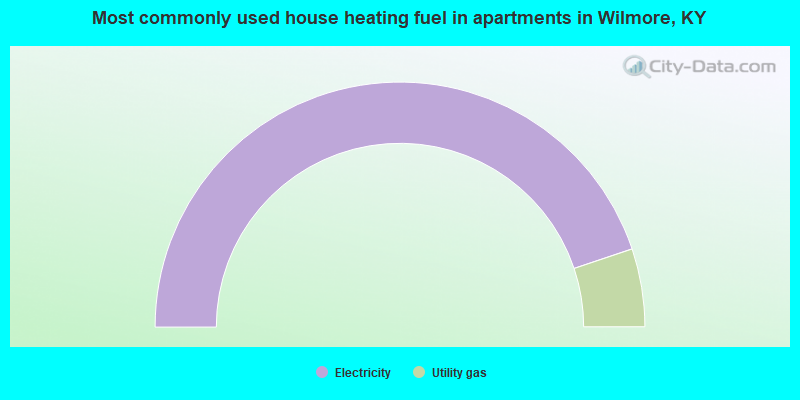
- 89.7%Electricity
- 10.3%Utility gas
Wilmore compared to Kentucky state average:
- Unemployed percentage below state average.
- Black race population percentage below state average.
- Hispanic race population percentage below state average.
- Median age significantly below state average.
- Foreign-born population percentage above state average.
- Renting percentage above state average.
- Length of stay since moving in above state average.
- House age below state average.
- Institutionalized population percentage significantly above state average.
- Number of college students significantly above state average.
- Percentage of population with a bachelor's degree or higher significantly above state average.
Wilmore on our top lists:
- #10 on the list of "Top 101 cities with the lowest number of robberies per 100,000 residents (population 5,000+)"
- #16 on the list of "Top 101 cities with largest percentage of males in occupations: community and social service occupations (population 5,000+)"
- #45 on the list of "Top 101 cities with the most people walking to work (population 5,000+)"
- #50 on the list of "Top 101 cities with largest percentage of males in industries: educational services (population 5,000+)"
- #50 on the list of "Top 101 cities with largest percentage of females in industries: educational services (population 5,000+)"
- #58 on the list of "Top 100 cities with highest percentage of college students (pop. 5,000+)"
- #83 on the list of "Top 101 cities with largest percentage of males in occupations: education, training, and library occupations (population 5,000+)"
- #99 on the list of "Top 101 cities with the most people having Master's or Doctorate degrees (population 5,000+)"

|
Total of 9 patent applications in 2008-2024.