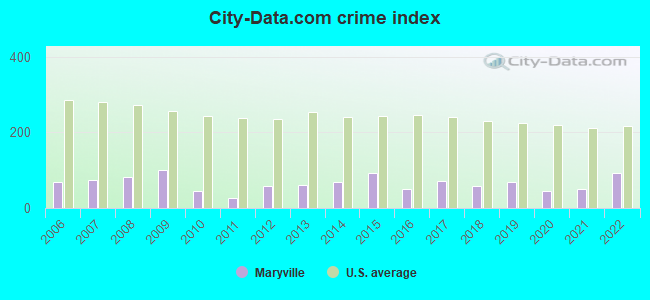
The City-Data.com crime index weighs serious crimes and violent crimes more heavily. Higher means more crime, U.S. average is 246.1. It adjusts for the number of visitors and daily workers commuting into cities.
Latest news from Maryville, IL collected exclusively by city-data.com from local newspapers, TV, and radio stations
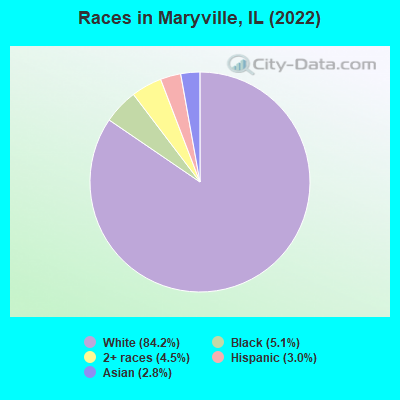
Ancestries: German (23.9%), European (13.9%), English (11.2%), American (10.0%), Irish (5.9%), Czech (3.2%).
Current Local Time: CST time zone
Incorporated on 07/21/1902
Elevation: 583 feet
Land area: 4.67 square miles.
Population density: 1,777 people per square mile (low).
237 residents are foreign born (2.9% Asia).
This village:
2.9%
Illinois:
14.1%
Median real estate property taxes paid for housing units with mortgages in 2022: $5,078 (1.9%) Median real estate property taxes paid for housing units with no mortgage in 2022: $4,823 (1.8%)
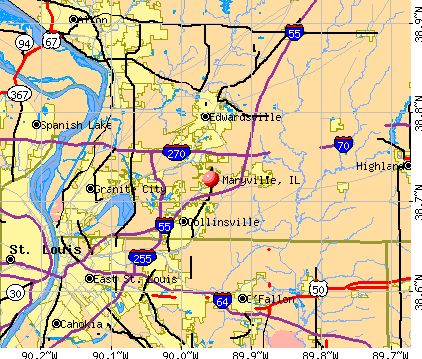
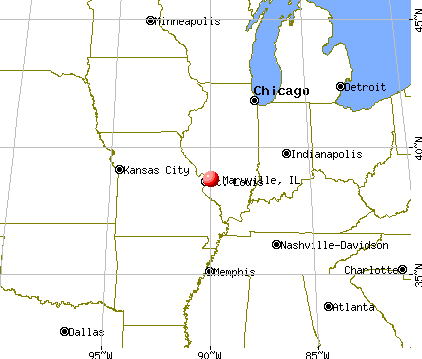
Nearest city with pop. 50,000+: St. Louis, MO (16.8 miles , pop. 348,189).
Nearest city with pop. 1,000,000+: Chicago, IL (246.7 miles , pop. 2,896,016).
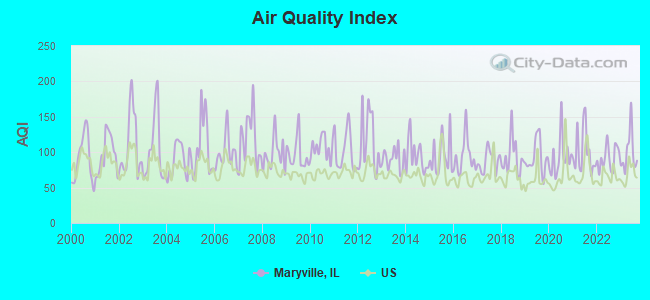
Air Quality Index (AQI) level in 2023 was 99.1. This is worse than average.
City:
99.1
U.S.:
72.6
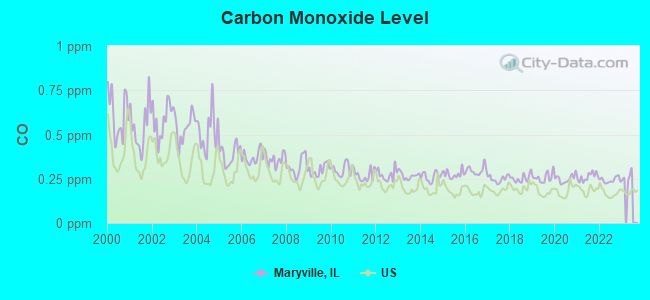
Carbon Monoxide (CO) [ppm] level in 2022 was 0.243. This is about average.Closest monitor was 1.1 miles away from the city center.
City:
0.243
U.S.:
0.251
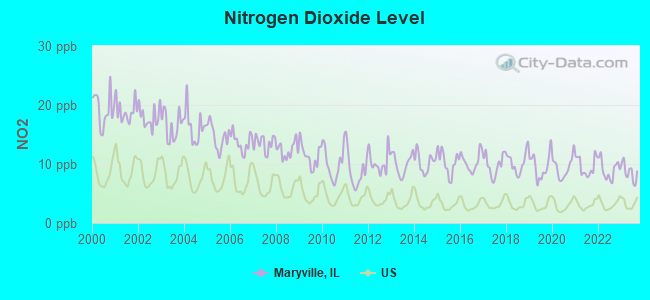
Nitrogen Dioxide (NO2) [ppb] level in 2023 was 8.60. This is significantly worse than average.Closest monitor was 1.1 miles away from the city center.
City:
8.60
U.S.:
5.11
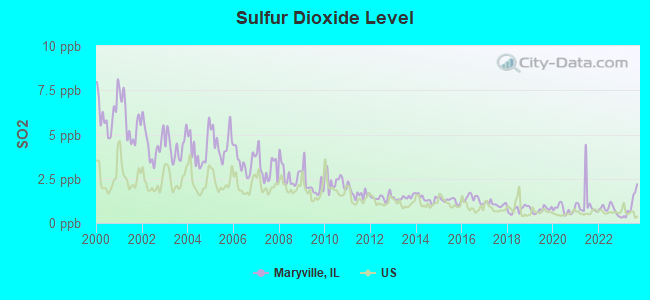
Sulfur Dioxide (SO2) [ppb] level in 2023 was 0.969. This is significantly better than average.Closest monitor was 1.1 miles away from the city center.
City:
0.969
U.S.:
1.515
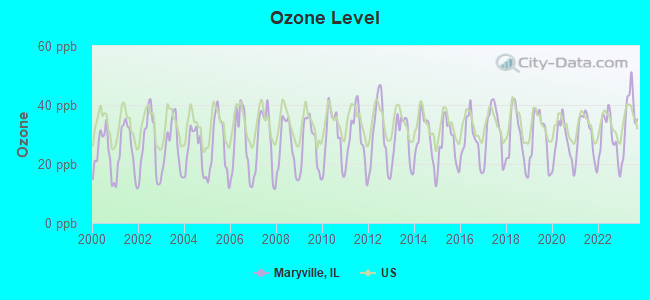
Ozone [ppb] level in 2023 was 36.3. This is about average.Closest monitor was 0.2 miles away from the city center.
City:
36.3
U.S.:
33.3
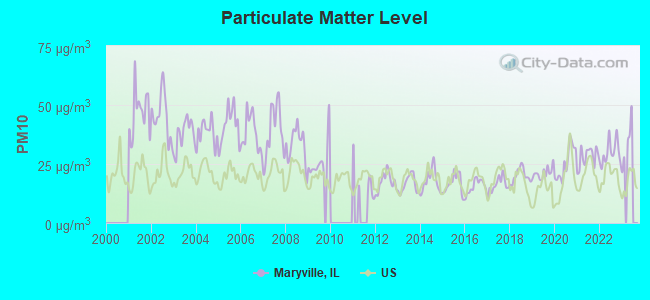
Particulate Matter (PM10) [µg/m3] level in 2022 was 29.8. This is significantly worse than average.Closest monitor was 9.9 miles away from the city center.
City:
29.8
U.S.:
19.2
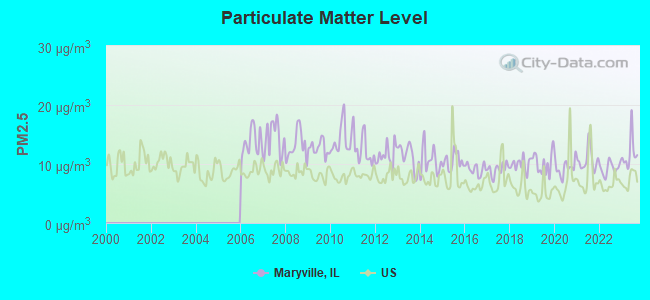
Particulate Matter (PM2.5) [µg/m3] level in 2023 was 11.8. This is significantly worse than average.Closest monitor was 9.9 miles away from the city center.
City:
11.8
U.S.:
8.1
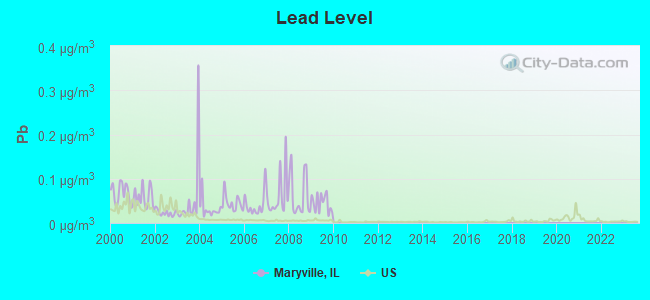
Lead (Pb) [µg/m3] level in 2009 was 0.0453. This is significantly worse than average.Closest monitor was 4.2 miles away from the city center.
City:
0.0453
U.S.:
0.0093
Tornado activity:
Maryville-area historical tornado activity is slightly above Illinois state average. It is 89% greater than the overall U.S. average.
On 4/3/1981, a category F4 (max. wind speeds 207-260 mph) tornado 6.6 miles away from the Maryville village center injured 32 peopleand causedbetween $5,000,000 and $50,000,000 in damages.
On 1/24/1967, a category F4 tornado 10.9 miles away from the village center killed 3 peopleand injured 216 peopleand causedbetween $5,000,000 and $50,000,000 in damages.
Earthquake activity:
Maryville-area historical earthquake activity is significantly above Illinois state average. It is 293% greater than the overall U.S. average.
On 4/18/2008 at 09:36:59, a magnitude 5.4 (5.1 MB, 4.8 MS, 5.4 MW, 5.2 MW, Class: Moderate, Intensity: VI - VII) earthquake occurred 113.6 miles away from Maryville center On 4/18/2008 at 09:36:59, a magnitude 5.2 (5.2 MW, Depth: 8.9 mi) earthquake occurred 113.6 miles away from Maryville center On 6/10/1987 at 23:48:54, a magnitude 5.1 (4.9 MB, 4.4 MS, 4.6 MS, 5.1 LG) earthquake occurred 112.0 miles away from the city center On 9/26/1990 at 13:18:51, a magnitude 5.0 (4.7 MB, 4.8 LG, 5.0 LG, Depth: 7.7 mi) earthquake occurred 110.2 miles away from Maryville center On 6/18/2002 at 17:37:15, a magnitude 5.0 (4.3 MB, 4.6 MW, 5.0 LG) earthquake occurred 128.7 miles away from the city center On 5/4/1991 at 01:18:54, a magnitude 5.0 (4.4 MB, 4.6 LG, 5.0 LG, Depth: 3.1 mi) earthquake occurred 149.7 miles away from Maryville center Magnitude types: regional Lg-wave magnitude (LG), body-wave magnitude (MB), surface-wave magnitude (MS), moment magnitude (MW)
Natural disasters:
The number of natural disasters in Madison County (14) is near the US average (15). Major Disasters (Presidential) Declared: 11 Emergencies Declared: 1
Causes of natural disasters: Floods: 11, Storms: 10, Tornadoes: 3, Heavy Rain: 1, Hurricane: 1, Winter Storm: 1, Other: 1 (Note: some incidents may be assigned to more than one category).
Hospitals and medical centers in Maryville:
ANDERSON HOSPITAL (Voluntary non-profit - Private, provides emergency services, 6800 STATE ROUTE 162)
ELMWOOD NURSING AND REHAB CENTER (152 WILMA DRIVE)
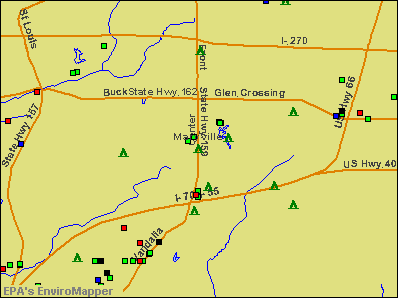
Churches in Maryville include: Saint Johns Lutheran Church (A), Maryville First Baptist Church (B), First Baptist Church (C), Saint Lukes Methodist Church (D), Saint Marys Catholic Church (E), Maryville Assembly of God Church (F), Lords Lutheran Church (G). Display/hide their locations on the map
Cemeteries: Saint John Lutheran Cemetery (1), Krome Family Cemetery (2), Old Saint Johns Cemetery (3), Buck Road Cemetery (4). Display/hide their locations on the map
Birthplace of: Nathan Hodel - 2005 NFL player (Arizona Cardinals, born: Nov 12, 1977), Justin Fletcher (ice hockey) - Ice hockey player, Bob Boken - Baseball player, Lindsay Kennedy - Soccer player.
Madison County has a predicted average indoor radon screening level between 2 and 4 pCi/L (pico curies per liter) - Moderate Potential
Average household size:
This village:
2.5 people
Illinois:
2.6 people
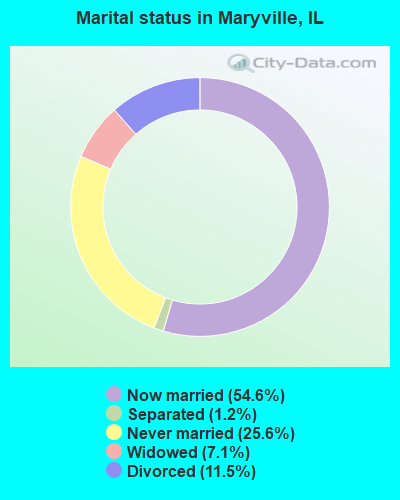
Percentage of family households:
This village:
69.0%
Whole state:
65.8%
Percentage of households with unmarried partners:
This village:
5.2%
Whole state:
6.3%
Likely homosexual households (counted as self-reported same-sex unmarried-partner households)
Lesbian couples: 0.3% of all households
Gay men: 0.4% of all households
145 people in nursing facilities/skilled-nursing facilities in 2010
207 people in nursing homes in 2000
28 people in homes or halfway houses for drug/alcohol abuse in 2000
Banks with branches in Maryville (2011 data):
The First National Bank in Staunton: Maryville Branch at 2623 N Center Street, branch established on 1997/05/08. Info updated 2006/11/03: Bank assets: $480.2 mil, Deposits: $396.5 mil, headquarters in Staunton, IL, positive income, Commercial Lending Specialization, 10 total offices, Holding Company: First Staunton Bancshares, Inc.
Home Federal Savings and Loan Association of Collinsville: Maryville Branch at 2110 N. Center Street, branch established on 2008/06/30. Info updated 2011/07/21: Bank assets: $103.1 mil, Deposits: $78.9 mil, headquarters in Collinsville, IL, negative income in the last year, Mortgage Lending Specialization, 2 total offices
First Collinsville Bank: Maryville Branch at 2729 Maryville Road, branch established on 2000/08/28. Info updated 2006/11/03: Bank assets: $630.0 mil, Deposits: $554.3 mil, headquarters in Collinsville, IL, positive income, Mortgage Lending Specialization, 9 total offices, Holding Company: First Co Bancorp, Inc.
UMB Bank, National Association: Maryville Branch at 2921 Maryville Road, branch established on 1902/02/12. Info updated 2007/12/13: Bank assets: $11,205.9 mil, Deposits: $8,538.8 mil, headquarters in Kansas City, MO, positive income, 107 total offices, Holding Company: Umb Financial Corporation
FIRST MID-ILLINOIS BANK & TRUST, NATIONAL ASSOCIATION: Maryville Branch at 2930 North Center, branch established on 2002/11/15. Info updated 2010/09/16: Bank assets: $1,492.8 mil, Deposits: $1,192.9 mil, headquarters in Mattoon, IL, positive income, Commercial Lending Specialization, 37 total offices, Holding Company: First Mid-Illinois Bancshares, Inc.
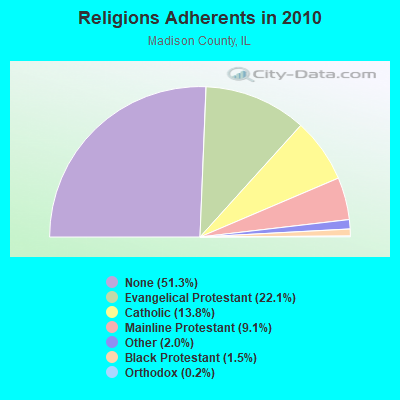
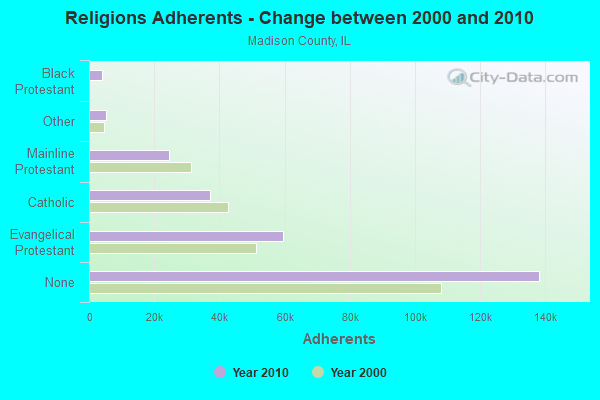
Religion statistics for Maryville, IL (based on Madison County data)
Religion
Adherents
Congregations
Evangelical Protestant
59,455
212
Catholic
37,243
21
Mainline Protestant
24,545
79
Other
5,330
20
Black Protestant
3,942
21
Orthodox
590
4
None
138,177
-
Source: Clifford Grammich, Kirk Hadaway, Richard Houseal, Dale E.Jones, Alexei Krindatch, Richie Stanley and Richard H.Taylor. 2012. 2010 U.S.Religion Census: Religious Congregations & Membership Study. Association of Statisticians of American Religious Bodies. Jones, Dale E., et al. 2002. Congregations and Membership in the United States 2000. Nashville, TN: Glenmary Research Center. Graphs represent county-level data
FAA Registered Aircraft Manufacturers and Dealers:
1
SWAN AIR LLC, 100 Dogwood Ter, Maryville, IL 62062 Certificate: D004436 (LLC), Certificate Issue Date: 09/02/2020, Expiration Date: 09/01/2021
FAA Registered Aircraft:
5
Aircraft: CESSNA 177RG (Category: Land, Seats: 4, Weight: Up to 12,499 Pounds, Speed: 120 mph), Engine: LYCOMING IO-360-A1B6D (200 HP) (Reciprocating) N-Number: 34030, N34030, N-34030, Serial Number: 177RG0953, Year manufactured: 1976, Airworthiness Date: 06/11/1976, Certificate Issue Date: 04/15/1999 Registrant (Partnership): Greg J Sommer, 5 Ashworth Court, Maryville, IL 62062, Other Owners: Richard B Sommer
Aircraft: PIPER PA-28-161 (Category: Land, Seats: 4, Weight: Up to 12,499 Pounds, Speed: 108 mph), Engine: LYCOMING 0-320 SERIES (180 HP) (Reciprocating) N-Number: 38288, N38288, N-38288, Serial Number: 28-7716238, Year manufactured: 1977, Airworthiness Date: 06/03/1977, Certificate Issue Date: 09/15/2020 Registrant (Co-Owned): Inc Sjc52, 737 Copper Line Rd, Maryville, IL 62062, Other Owners: Training Systems LLC Nrcme, Mark A Pearson
Aircraft: AURAND THOMAS C VAN RV-4 (Category: Land, Seats: 2, Weight: Up to 12,499 Pounds), Engine: LYCOMING O-320-D2A (160 HP) (Reciprocating) N-Number: 5121K, N5121K, N-5121K, Serial Number: 1308, Year manufactured: 2007, Airworthiness Date: 12/03/2007, Certificate Issue Date: 10/20/2016 Registrant (Individual): Francis L Tebbe, Po Box 99, Maryville, IL 62062
Aircraft: TL ULTRALIGHT SRO TL-3000 SIRIUS (Category: Land, Seats: 2, Weight: Up to 12,499 Pounds), Engine: ROTAX 912ULS SERIES (100 HP) (4 Cycle) N-Number: 726T, N726T, N-726T, Serial Number: 13SI77, Year manufactured: 2013, Airworthiness Date: 07/22/2013, Certificate Issue Date: 07/10/2013 Registrant (LLC): Swan Air LLC, 100 Dogwood Ter, Maryville, IL 62062
Aircraft: PIPER J3C-65 (Category: Land, Seats: 2, Weight: Up to 12,499 Pounds, Speed: 67 mph), Engine: CONT MOTOR C90-8F (95 HP) (Reciprocating) N-Number: 94597, N94597, N-94597, Serial Number: 19712, Year manufactured: 1946, Airworthiness Date: 10/08/2008, Certificate Issue Date: 01/30/2017 Registrant (Individual): Francis L Tebbe, Po Box 99, Maryville, IL 62062
Home Mortgage Disclosure Act Aggregated Statistics For Year 2009 (Based on 1 partial tract)
A) FHA, FSA/RHS & VA Home Purchase Loans
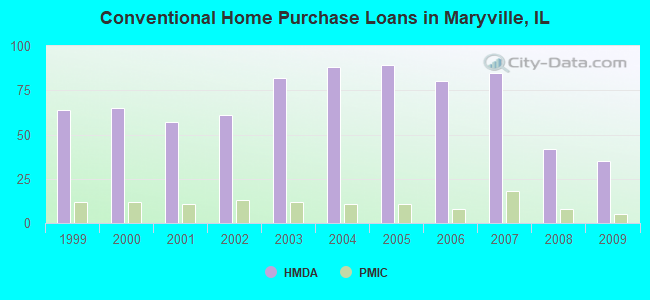
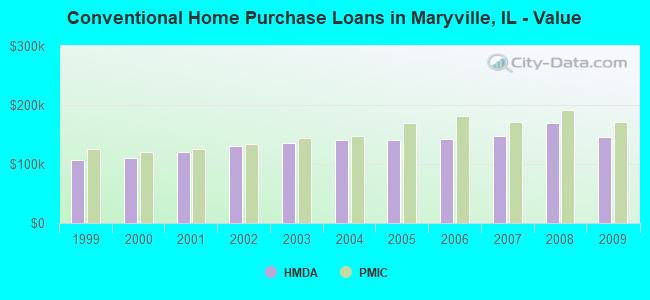
B) Conventional Home Purchase Loans
C) Refinancings
D) Home Improvement Loans
E) Loans on Dwellings For 5+ Families
F) Non-occupant Loans on < 5 Family Dwellings (A B C & D)
G) Loans On Manufactured Home Dwelling (A B C & D)
Number
Average Value
Number
Average Value
Number
Average Value
Number
Average Value
Number
Average Value
Number
Average Value
Number
Average Value
LOANS ORIGINATED
20
$176,276
35
$145,766
167
$160,141
10
$65,306
1
$713,480
7
$112,807
3
$32,950
APPLICATIONS APPROVED, NOT ACCEPTED
1
$129,410
2
$130,220
12
$140,637
1
$46,300
0
$0
1
$69,680
0
$0
APPLICATIONS DENIED
2
$162,165
3
$102,553
22
$154,474
5
$50,142
0
$0
2
$99,430
1
$39,350
APPLICATIONS WITHDRAWN
1
$164,360
2
$110,775
33
$171,415
1
$35,650
0
$0
0
$0
1
$54,630
FILES CLOSED FOR INCOMPLETENESS
0
$0
1
$152,100
3
$127,943
0
$0
0
$0
0
$0
0
$0
Aggregated Statistics For Year 2008 (Based on 1 partial tract)
A) FHA, FSA/RHS & VA Home Purchase Loans
B) Conventional Home Purchase Loans
C) Refinancings
D) Home Improvement Loans
F) Non-occupant Loans on < 5 Family Dwellings (A B C & D)
G) Loans On Manufactured Home Dwelling (A B C & D)
Number
Average Value
Number
Average Value
Number
Average Value
Number
Average Value
Number
Average Value
Number
Average Value
LOANS ORIGINATED
11
$171,689
42
$169,034
75
$161,979
9
$71,713
8
$153,542
1
$68,990
APPLICATIONS APPROVED, NOT ACCEPTED
1
$127,320
3
$168,840
8
$157,622
2
$27,315
0
$0
0
$0
APPLICATIONS DENIED
3
$158,500
3
$151,863
17
$169,554
3
$47,997
1
$175,010
0
$0
APPLICATIONS WITHDRAWN
1
$156,490
5
$153,902
15
$174,643
2
$111,815
0
$0
0
$0
FILES CLOSED FOR INCOMPLETENESS
0
$0
1
$154,180
2
$200,245
0
$0
0
$0
0
$0
Aggregated Statistics For Year 2007 (Based on 1 partial tract)
A) FHA, FSA/RHS & VA Home Purchase Loans
B) Conventional Home Purchase Loans
C) Refinancings
D) Home Improvement Loans
E) Loans on Dwellings For 5+ Families
F) Non-occupant Loans on < 5 Family Dwellings (A B C & D)
G) Loans On Manufactured Home Dwelling (A B C & D)
Number
Average Value
Number
Average Value
Number
Average Value
Number
Average Value
Number
Average Value
Number
Average Value
Number
Average Value
LOANS ORIGINATED
5
$169,644
85
$147,340
61
$145,568
13
$29,703
1
$133,580
10
$136,029
2
$48,615
APPLICATIONS APPROVED, NOT ACCEPTED
0
$0
8
$159,619
10
$152,373
4
$52,202
0
$0
1
$121,540
0
$0
APPLICATIONS DENIED
0
$0
6
$153,717
23
$157,279
6
$75,198
0
$0
1
$80,560
0
$0
APPLICATIONS WITHDRAWN
1
$100,240
8
$159,445
14
$155,700
1
$103,020
0
$0
1
$82,180
0
$0
FILES CLOSED FOR INCOMPLETENESS
0
$0
1
$118,530
6
$174,358
0
$0
0
$0
0
$0
0
$0
Aggregated Statistics For Year 2006 (Based on 1 partial tract)
A) FHA, FSA/RHS & VA Home Purchase Loans
B) Conventional Home Purchase Loans
C) Refinancings
D) Home Improvement Loans
E) Loans on Dwellings For 5+ Families
F) Non-occupant Loans on < 5 Family Dwellings (A B C & D)
G) Loans On Manufactured Home Dwelling (A B C & D)
Number
Average Value
Number
Average Value
Number
Average Value
Number
Average Value
Number
Average Value
Number
Average Value
Number
Average Value
LOANS ORIGINATED
3
$196,080
80
$141,881
67
$129,108
15
$51,871
1
$194,690
13
$140,040
4
$40,340
APPLICATIONS APPROVED, NOT ACCEPTED
0
$0
8
$101,398
10
$120,519
2
$20,490
0
$0
0
$0
1
$34,960
APPLICATIONS DENIED
1
$106,490
8
$143,270
23
$159,806
5
$56,672
0
$0
1
$212,520
2
$46,645
APPLICATIONS WITHDRAWN
0
$0
5
$136,678
19
$156,079
1
$74,080
0
$0
0
$0
0
$0
FILES CLOSED FOR INCOMPLETENESS
0
$0
2
$156,840
4
$155,800
1
$54,400
0
$0
0
$0
0
$0
Aggregated Statistics For Year 2005 (Based on 1 partial tract)
A) FHA, FSA/RHS & VA Home Purchase Loans
B) Conventional Home Purchase Loans
C) Refinancings
D) Home Improvement Loans
F) Non-occupant Loans on < 5 Family Dwellings (A B C & D)
G) Loans On Manufactured Home Dwelling (A B C & D)
Number
Average Value
Number
Average Value
Number
Average Value
Number
Average Value
Number
Average Value
Number
Average Value
LOANS ORIGINATED
4
$183,752
89
$141,176
80
$129,446
14
$55,411
10
$97,624
3
$47,303
APPLICATIONS APPROVED, NOT ACCEPTED
0
$0
7
$114,394
9
$137,897
2
$33,800
0
$0
3
$49,157
APPLICATIONS DENIED
0
$0
11
$128,925
24
$142,199
6
$35,033
2
$100,355
3
$59,960
APPLICATIONS WITHDRAWN
0
$0
15
$147,435
18
$155,092
2
$185,430
1
$93,060
0
$0
FILES CLOSED FOR INCOMPLETENESS
0
$0
2
$97,925
6
$145,228
0
$0
0
$0
0
$0
Aggregated Statistics For Year 2004 (Based on 1 partial tract)
A) FHA, FSA/RHS & VA Home Purchase Loans
B) Conventional Home Purchase Loans
C) Refinancings
D) Home Improvement Loans
F) Non-occupant Loans on < 5 Family Dwellings (A B C & D)
G) Loans On Manufactured Home Dwelling (A B C & D)
Number
Average Value
Number
Average Value
Number
Average Value
Number
Average Value
Number
Average Value
Number
Average Value
LOANS ORIGINATED
7
$153,386
88
$139,908
93
$129,267
10
$77,853
8
$154,469
2
$38,890
APPLICATIONS APPROVED, NOT ACCEPTED
0
$0
6
$136,353
7
$173,393
2
$60,885
1
$135,890
1
$94,450
APPLICATIONS DENIED
0
$0
9
$116,470
23
$127,818
2
$35,535
1
$111,350
2
$54,285
APPLICATIONS WITHDRAWN
1
$128,020
4
$145,672
21
$129,221
2
$51,395
0
$0
0
$0
FILES CLOSED FOR INCOMPLETENESS
0
$0
2
$90,400
4
$151,460
0
$0
0
$0
0
$0
Aggregated Statistics For Year 2003 (Based on 1 partial tract)
A) FHA, FSA/RHS & VA Home Purchase Loans
B) Conventional Home Purchase Loans
C) Refinancings
D) Home Improvement Loans
F) Non-occupant Loans on < 5 Family Dwellings (A B C & D)
Number
Average Value
Number
Average Value
Number
Average Value
Number
Average Value
Number
Average Value
LOANS ORIGINATED
7
$145,713
82
$134,753
260
$117,842
11
$60,022
11
$124,989
APPLICATIONS APPROVED, NOT ACCEPTED
0
$0
5
$153,624
23
$117,753
1
$17,830
1
$108,340
APPLICATIONS DENIED
1
$161,590
7
$93,526
32
$122,413
3
$8,797
0
$0
APPLICATIONS WITHDRAWN
0
$0
4
$120,148
25
$111,064
0
$0
1
$71,530
FILES CLOSED FOR INCOMPLETENESS
0
$0
1
$179,180
4
$123,910
0
$0
0
$0
Aggregated Statistics For Year 2002 (Based on 1 partial tract)
A) FHA, FSA/RHS & VA Home Purchase Loans
B) Conventional Home Purchase Loans
C) Refinancings
D) Home Improvement Loans
F) Non-occupant Loans on < 5 Family Dwellings (A B C & D)
Number
Average Value
Number
Average Value
Number
Average Value
Number
Average Value
Number
Average Value
LOANS ORIGINATED
9
$129,923
61
$130,634
183
$115,835
11
$27,254
6
$91,250
APPLICATIONS APPROVED, NOT ACCEPTED
0
$0
5
$86,766
19
$117,602
2
$19,675
1
$42,360
APPLICATIONS DENIED
0
$0
5
$84,776
21
$130,257
4
$14,642
0
$0
APPLICATIONS WITHDRAWN
1
$156,490
3
$111,120
17
$103,562
0
$0
0
$0
FILES CLOSED FOR INCOMPLETENESS
0
$0
1
$102,090
3
$133,497
0
$0
0
$0
Aggregated Statistics For Year 2001 (Based on 1 partial tract)
A) FHA, FSA/RHS & VA Home Purchase Loans
B) Conventional Home Purchase Loans
C) Refinancings
D) Home Improvement Loans
F) Non-occupant Loans on < 5 Family Dwellings (A B C & D)
Number
Average Value
Number
Average Value
Number
Average Value
Number
Average Value
Number
Average Value
LOANS ORIGINATED
12
$111,872
57
$120,583
123
$111,054
12
$36,770
12
$91,442
APPLICATIONS APPROVED, NOT ACCEPTED
1
$72,690
6
$81,873
12
$95,223
2
$15,860
0
$0
APPLICATIONS DENIED
1
$61,350
14
$52,418
19
$83,864
3
$14,200
3
$37,040
APPLICATIONS WITHDRAWN
1
$178,720
4
$108,052
10
$91,327
2
$53,015
0
$0
FILES CLOSED FOR INCOMPLETENESS
0
$0
1
$70,380
3
$125,240
1
$18,060
0
$0
Aggregated Statistics For Year 2000 (Based on 1 partial tract)
A) FHA, FSA/RHS & VA Home Purchase Loans
B) Conventional Home Purchase Loans
C) Refinancings
D) Home Improvement Loans
F) Non-occupant Loans on < 5 Family Dwellings (A B C & D)
Number
Average Value
Number
Average Value
Number
Average Value
Number
Average Value
Number
Average Value
LOANS ORIGINATED
8
$119,020
65
$109,646
33
$96,571
15
$19,107
13
$105,315
APPLICATIONS APPROVED, NOT ACCEPTED
1
$62,740
4
$97,402
5
$68,154
2
$13,195
0
$0
APPLICATIONS DENIED
1
$70,610
10
$54,217
9
$60,576
3
$23,613
1
$53,940
APPLICATIONS WITHDRAWN
0
$0
3
$90,593
6
$77,900
0
$0
0
$0
FILES CLOSED FOR INCOMPLETENESS
0
$0
0
$0
1
$41,900
0
$0
0
$0
Aggregated Statistics For Year 1999 (Based on 1 partial tract)
A) FHA, FSA/RHS & VA Home Purchase Loans
B) Conventional Home Purchase Loans
C) Refinancings
D) Home Improvement Loans
F) Non-occupant Loans on < 5 Family Dwellings (A B C & D)
Detailed PMIC statistics for the following Tracts:4035.01
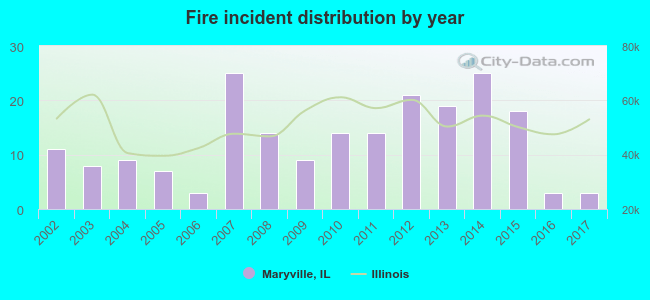
2002 - 2017 National Fire Incident Reporting System (NFIRS) incidents
Based on the data from the years 2002 - 2017 the average number of fires per year is 13. The highest number of reported fire incidents - 25 took place in 2007, and the least - 3 in 2006. The data has a dropping trend.
When looking into fire subcategories, the most reports belonged to: Structure Fires (47.8%), and Outside Fires (27.1%).
Fire incident types reported to NFIRS in Maryville, IL
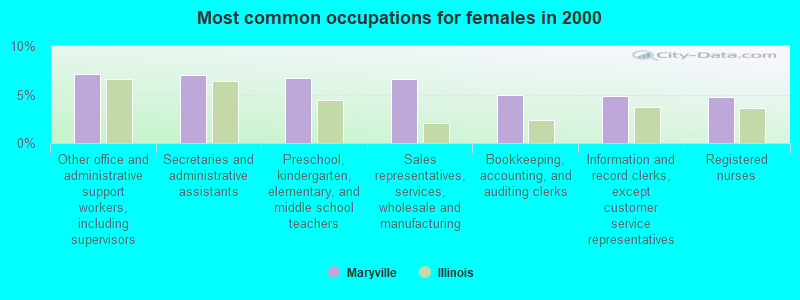
#76 on the list of "Top 101 cities with largest percentage of females in occupations: education, training, and library occupations (population 5,000+)"
#12 on the list of "Top 101 counties with the largest decrease in the number of infant deaths per 1000 residents 2000-2006 to 2007-2013 (pop. 50,000+)"
#18 on the list of "Top 101 counties with the lowest number of infant deaths per 1000 residents 2007-2013 (pop. 50,000+)"
#26 on the list of "Top 101 counties with the highest Particulate Matter (PM2.5) Annual air pollution readings in 2012 (µg/m3)"
#67 on the list of "Top 101 counties with the lowest percentage of residents relocating from foreign countries between 2010 and 2011"


 Recent articles from our blog. Our writers, many of them Ph.D. graduates or candidates, create easy-to-read articles on a wide variety of topics.


 (16.8 miles

 Based on the data from the years 2002 - 2017 the average number of fires per year is 13. The highest number of reported fire incidents - 25 took place in 2007, and the least - 3 in 2006. The data has a dropping trend.
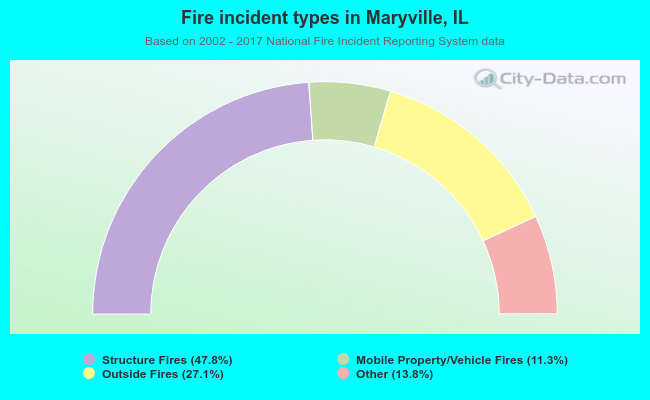 When looking into fire subcategories, the most reports belonged to: Structure Fires (47.8%), and Outside Fires (27.1%).