Percentage of residents living in poverty in 2022: 12.9%
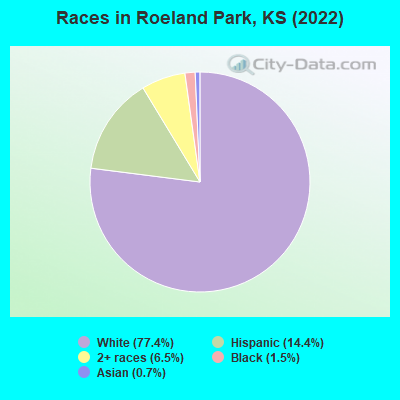
(12.2% for White Non-Hispanic residents, 10.5% for Black residents, 22.2% for Hispanic or Latino residents, 71.5% for other race residents, 1.1% for two or more races residents)
According to our research of Kansas and other state lists, there were 9 registered sex offenders living in Roeland Park, Kansas as of June 15, 2024. The ratio of all residents to sex offenders in Roeland Park is 773 to 1. The ratio of registered sex offenders to all residents in this city is much lower than the state average.
Crime rates in Roeland Park by year
Type
2009
2010
2012
2013
2014
2015
2019
2020
2021
2022
Murders (per 100,000)
0 (0.0)
0 (0.0)
0 (0.0)
0 (0.0)
0 (0.0)
0 (0.0)
0 (0.0)
0 (0.0)
0 (0.0)
0 (0.0)
Rapes (per 100,000)
2 (28.8)
5 (74.3)
0 (0.0)
0 (0.0)
5 (72.8)
0 (0.0)
0 (0.0)
0 (0.0)
1 (15.1)
2 (29.6)
Robberies (per 100,000)
0 (0.0)
9 (133.7)
5 (72.7)
0 (0.0)
1 (14.6)
2 (29.1)
2 (29.6)
1 (15.0)
5 (75.3)
8 (118.3)
Assaults (per 100,000)
10 (144.2)
3 (44.6)
3 (43.6)
1 (14.6)
3 (43.7)
1 (14.6)
3 (44.4)
12 (179.6)
11 (165.6)
13 (192.3)
Burglaries (per 100,000)
10 (144.2)
27 (401.1)
14 (203.6)
4 (58.5)
8 (116.4)
13 (189.3)
5 (74.0)
15 (224.5)
6 (90.3)
4 (59.2)
Thefts (per 100,000)
131 (1,889)
220 (3,268)
127 (1,847)
73 (1,067)
127 (1,848)
45 (655.4)
53 (783.9)
118 (1,766)
137 (2,062)
229 (3,387)
Auto thefts (per 100,000)
14 (201.9)
18 (267.4)
18 (261.8)
8 (116.9)
6 (87.3)
7 (102.0)
7 (103.5)
26 (389.0)
35 (526.8)
34 (502.8)
Arson (per 100,000)
0 (0.0)
0 (0.0)
2 (29.1)
0 (0.0)
0 (0.0)
0 (0.0)
1 (14.8)
0 (0.0)
1 (15.1)
0 (0.0)
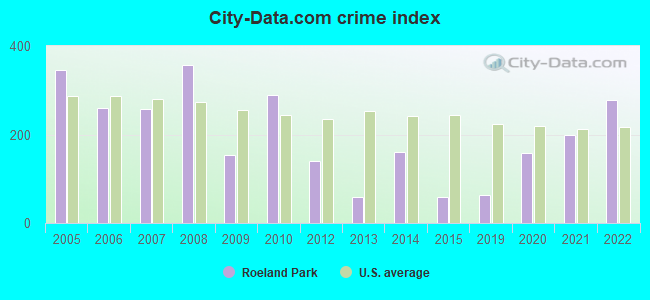
City-Data.com crime index
153.7
288.7
139.6
59.0
160.4
59.3
62.6
157.9
198.7
277.4
The City-Data.com crime index weighs serious crimes and violent crimes more heavily. Higher means more crime, U.S. average is 246.1. It adjusts for the number of visitors and daily workers commuting into cities.
Latest news from Roeland Park, KS collected exclusively by city-data.com from local newspapers, TV, and radio stations
Ancestries: Irish (16.6%), German (16.3%), American (7.7%), English (5.3%), Italian (2.6%), Scotch-Irish (2.0%).
Current Local Time: CST time zone
Elevation: 930 feet
Land area: 1.62 square miles.
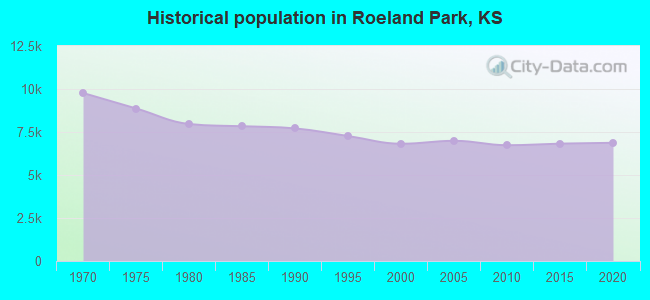
Population density: 4,169 people per square mile (average).
425 residents are foreign born (3.7% Latin America, 2.1% Asia).
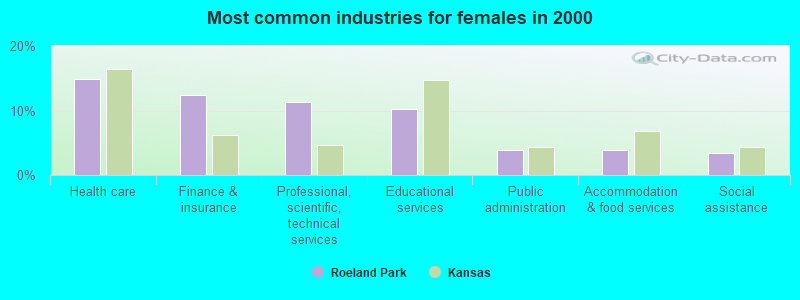
This city:
6.1%
Kansas:
7.1%
Median real estate property taxes paid for housing units with mortgages in 2022: $3,389 (1.3%) Median real estate property taxes paid for housing units with no mortgage in 2022: $3,296 (1.3%)
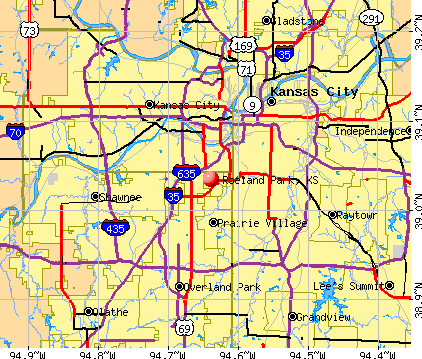
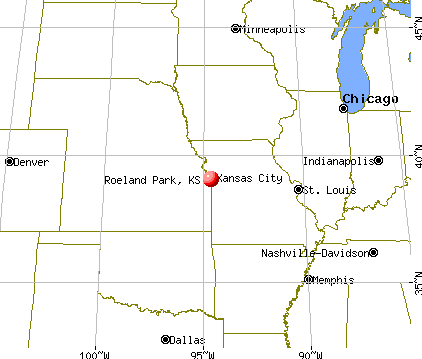
Nearest city with pop. 50,000+: Kansas City, MO (5.3 miles , pop. 441,545).
Nearest city with pop. 1,000,000+: Chicago, IL (414.4 miles , pop. 2,896,016).
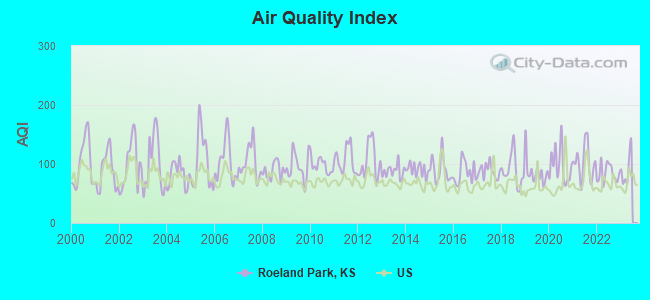
Air Quality Index (AQI) level in 2022 was 83.9. This is about average.
City:
83.9
U.S.:
72.6
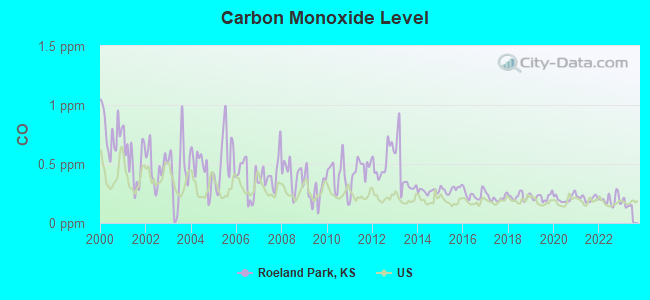
Carbon Monoxide (CO) [ppm] level in 2022 was 0.197. This is better than average.Closest monitor was 2.8 miles away from the city center.
City:
0.197
U.S.:
0.251
Nitrogen Dioxide (NO2) [ppb] level in 2022 was 9.93. This is significantly worse than average.Closest monitor was 3.3 miles away from the city center.
City:
9.93
U.S.:
5.11
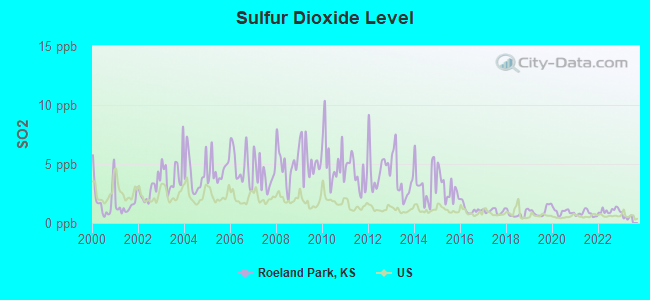
Sulfur Dioxide (SO2) [ppb] level in 2022 was 1.05. This is significantly better than average.Closest monitor was 3.3 miles away from the city center.
City:
1.05
U.S.:
1.51
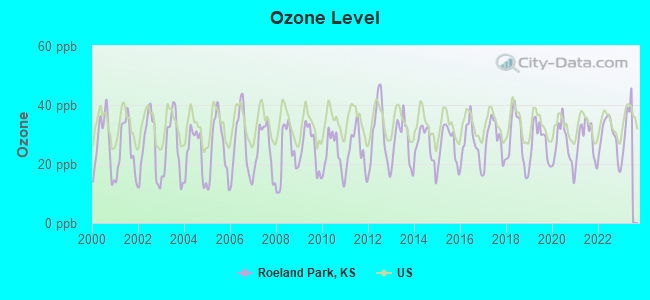
Ozone [ppb] level in 2022 was 29.4. This is about average.Closest monitor was 5.5 miles away from the city center.
City:
29.4
U.S.:
33.3
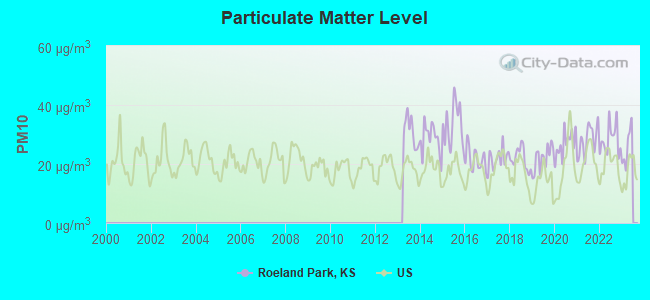
Particulate Matter (PM10) [µg/m3] level in 2022 was 28.3. This is significantly worse than average.Closest monitor was 3.4 miles away from the city center.
City:
28.3
U.S.:
19.2
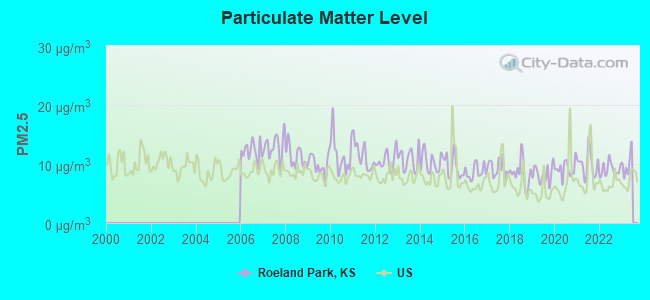
Particulate Matter (PM2.5) [µg/m3] level in 2022 was 9.04. This is about average.Closest monitor was 2.8 miles away from the city center.
City:
9.04
U.S.:
8.11
Tornado activity:
Roeland Park-area historical tornado activity is near Kansas state average. It is 102% greater than the overall U.S. average.
On 5/20/1957, a category F5 (max. wind speeds 261-318 mph) tornado 13.4 miles away from the Roeland Park city center killed 44 peopleand injured 207 peopleand causedbetween $500,000 and $5,000,000 in damages.
On 5/22/1952, a category F4 (max. wind speeds 207-260 mph) tornado 5.0 miles away from the city center injured 3 peopleand causedbetween $50,000 and $500,000 in damages.
Earthquake activity:
Roeland Park-area historical earthquake activity is significantly above Kansas state average. It is 508% greater than the overall U.S. average.
On 9/3/2016 at 12:02:44, a magnitude 5.8 (5.8 MW, Depth: 3.5 mi, Class: Moderate, Intensity: VI - VII) earthquake occurred 219.7 miles away from Roeland Park center On 11/6/2011 at 03:53:10, a magnitude 5.7 (5.7 MW, Depth: 3.2 mi) earthquake occurred 269.0 miles away from the city center On 11/12/2014 at 21:40:00, a magnitude 4.9 (4.9 MW, Depth: 2.5 mi, Class: Light, Intensity: IV - V) earthquake occurred 202.9 miles away from the city center On 11/7/2016 at 01:44:24, a magnitude 5.0 (5.0 MW, Depth: 2.8 mi) earthquake occurred 241.7 miles away from Roeland Park center On 2/13/2016 at 17:07:06, a magnitude 5.1 (5.1 MW, Depth: 5.2 mi) earthquake occurred 283.7 miles away from the city center On 1/19/2020 at 19:08:42, a magnitude 4.5 (4.5 MW, Depth: 3.1 mi) earthquake occurred 193.4 miles away from the city center Magnitude types: moment magnitude (MW)
Natural disasters:
The number of natural disasters in Johnson County (10) is smaller than the US average (15). Major Disasters (Presidential) Declared: 6 Emergencies Declared: 2
Causes of natural disasters: Floods: 6, Storms: 6, Tornadoes: 2, Hurricane: 1, Ice Storm: 1, Wind: 1, Winter Storm: 1, Other: 1 (Note: some incidents may be assigned to more than one category).
Hospitals and medical centers near Roeland Park:
RAI - RAINBOW BLVD - WESTWOOD (Dialysis Facility, about 2 miles away; WESTWOOD, KS)
CONTINUA HOSPICE (Hospital, about 2 miles away; KANSAS CITY, MO)
INFUSX INC (Home Health Center, about 2 miles away; OVERLAND PARK, KS)
ESSENTIAL HOME HEALTH INC (HOSPICE) (Hospital, about 3 miles away; OVERLAND PARK, KS)
UNIVERSITY OF KANSAS HOSPITAL Acute Care Hospitals (about 3 miles away; KANSAS CITY, KS)
BRIGHTON GARDENS OF PRAIRIE VILLAGE (Nursing Home, about 3 miles away; PRAIRIE VILLAGE, KS)
CLINICARE HOSPICE (Hospital, about 3 miles away; KANSAS CITY, KS)
Amtrak stations near Roeland Park:
5 miles: KANSAS CITY (2200 MAIN ST.) . Services: ticket office, fully wheelchair accessible, enclosed waiting area, public restrooms, public payphones, snack bar, free short-term parking, paid long-term parking, call for car rental service, taxi stand, public transit connection.
12 miles: INDEPENDENCE (600 S. GRAND AVE.) . Services: free short-term parking, call for taxi service.
17 miles: LEE'S SUMMIT (220 S. MAIN ST.) . Services: enclosed waiting area, public payphones, free short-term parking, free long-term parking, call for taxi service.
Colleges/universities with over 2000 students nearest to Roeland Park:
University of Missouri-Kansas City (about 4 miles; Kansas City, MO; Full-time enrollment: 10,544)
Metropolitan Community College-Kansas City (about 4 miles; Kansas City, MO; FT enrollment: 12,834)
Rockhurst University (about 4 miles; Kansas City, MO; FT enrollment: 2,013)
Wright Career College (about 8 miles; Overland Park, KS; FT enrollment: 3,107)
Kansas City Kansas Community College (about 9 miles; Kansas City, KS; FT enrollment: 4,718)
Johnson County Community College (about 10 miles; Overland Park, KS; FT enrollment: 11,976)
Park University (about 11 miles; Parkville, MO; FT enrollment: 9,131)
Private high schools in Roeland Park:
BISHOP MIEGE HIGH SCHOOL (Students: 738, Location: 5041 REINHARDT DR, Grades: 9-12)
Notable locations in Roeland Park: The Roe Shops (A), Cedar Roe Library (B), Roeland Park City Hall (C), Roeland Park Police Department (D). Display/hide their locations on the map
Churches in Roeland Park include: Southridge Presbyterian Church (A), Saint Agnus Church (B), Mission Full Gospel Church (C), Gordon Trustee Etal Dawkins Church (D). Display/hide their locations on the map
Birthplace of: John D. Carmack - Game programmer, Mike Gardner - Football player and coach, Catherine Fox - Swimmer.
Johnson County has a predicted average indoor radon screening level greater than 4 pCi/L (pico curies per liter) - Highest Potential
Average household size:
This city:
2.2 people
Kansas:
2.5 people
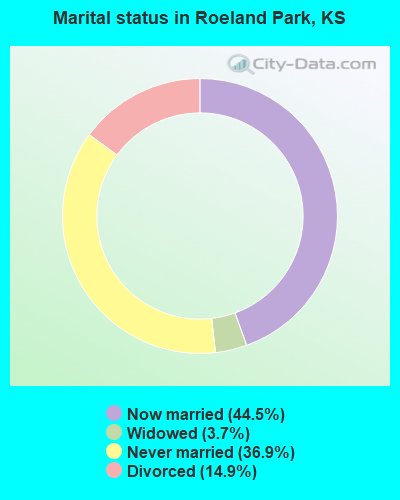
Percentage of family households:
This city:
56.5%
Whole state:
66.0%
Percentage of households with unmarried partners:
This city:
7.5%
Whole state:
5.8%
Likely homosexual households (counted as self-reported same-sex unmarried-partner households)
Lesbian couples: 0.7% of all households
Gay men: 0.5% of all households
2 people in other noninstitutional facilities in 2010
2 people in religious group quarters in 2000
Banks with branches in Roeland Park (2011 data):
The Mission Bank: - Roe Blvd Branch at 5115 Roe Boulevard, branch established on 1969/10/31. Info updated 2008/02/19: Bank assets: $555.4 mil, Deposits: $380.7 mil, headquarters in Mission, KS, positive income, Commercial Lending Specialization, 7 total offices, Holding Company: Valley View Bancshares, Inc.
U.S. Bank National Association: Roeland Park Branch at 4970 Roe Blvd., branch established on 1952/07/10. Info updated 2012/01/30: Bank assets: $330,470.8 mil, Deposits: $236,091.5 mil, headquarters in Cincinnati, OH, positive income, 3121 total offices, Holding Company: U.S. Bancorp
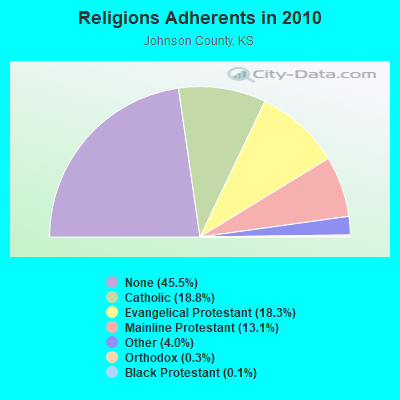
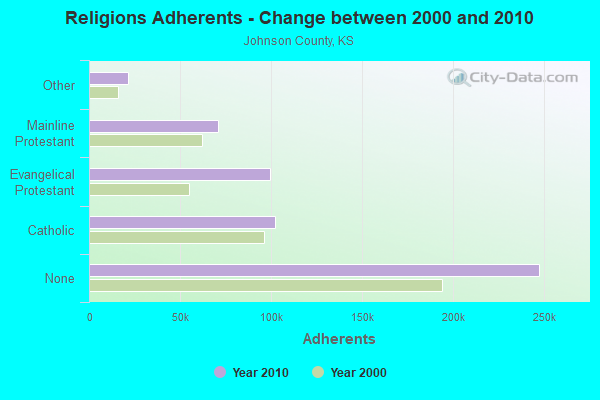
Religion statistics for Roeland Park, KS (based on Johnson County data)
Religion
Adherents
Congregations
Catholic
102,131
18
Evangelical Protestant
99,699
190
Mainline Protestant
71,068
87
Other
21,644
46
Orthodox
1,505
5
Black Protestant
642
4
None
247,490
-
Source: Clifford Grammich, Kirk Hadaway, Richard Houseal, Dale E.Jones, Alexei Krindatch, Richie Stanley and Richard H.Taylor. 2012. 2010 U.S.Religion Census: Religious Congregations & Membership Study. Association of Statisticians of American Religious Bodies. Jones, Dale E., et al. 2002. Congregations and Membership in the United States 2000. Nashville, TN: Glenmary Research Center. Graphs represent county-level data
JHNSN CO WST, 4710 Nall Avenue (Lat: 39.043528 Lon: -94.651333), Type: Ltower, Structure height: 53 m, Overall height: 58.8 m, Call Sign: WQSG611, Assigned Frequencies: 11445.0 MHz, Grant Date: 09/14/2023, Expiration Date: 09/17/2033, Certifier: Matt G Cragg, Registrant: Business Radio Licensing, 30251 Golden Lantern, Suite E #501, Laguna Niguel, CA 92677, Phone: (949) 348-8510, Fax: (949) 348-8510, Email:
Aircraft: AERONCA 7AC (Category: Land, Seats: 2, Weight: Up to 12,499 Pounds, Speed: 90 mph), Engine: CONT MOTOR C85 SERIES (85 HP) (Reciprocating) N-Number: 2526E, N2526E, N-2526E, Serial Number: 7AC-6108, Year manufactured: 1946, Airworthiness Date: 11/04/1992, Certificate Issue Date: 03/02/2020 Registrant (Co-Owned): Christopher L Grotewohl, 5049 Parish, Roeland Park, KS 66205, Other Owners: Andrew J Hutchinson, Charles H Myers
Aircraft: CAMERON BALLOONS N-77 (Category: Land, Seats: 4, Weight: Up to 12,499 Pounds), Engine: None N-Number: 7523F, N7523F, N-7523F, Serial Number: 5854, Year manufactured: 1993, Airworthiness Date: 01/26/1993, Certificate Issue Date: 12/02/2005 Registrant (Individual): Penny L Doll, 5041 Southridge St, Roeland Park, KS 66205
Aircraft: CESSNA 140A (Category: Land, Seats: 2, Weight: Up to 12,499 Pounds, Speed: 105 mph), Engine: CONT MOTOR C85 SERIES (85 HP) (Reciprocating) N-Number: 9446A, N9446A, N-9446A, Serial Number: 15267, Year manufactured: 1949, Certificate Issue Date: 03/18/1974 Registrant (Individual): James C Iii Gregory, 5207 W 49th, Roeland Park, KS 66205 Deregistered:Cancel Date: 02/13/2017
Home Mortgage Disclosure Act Aggregated Statistics For Year 2009 (Based on 1 full and 2 partial tracts)
A) FHA, FSA/RHS & VA Home Purchase Loans
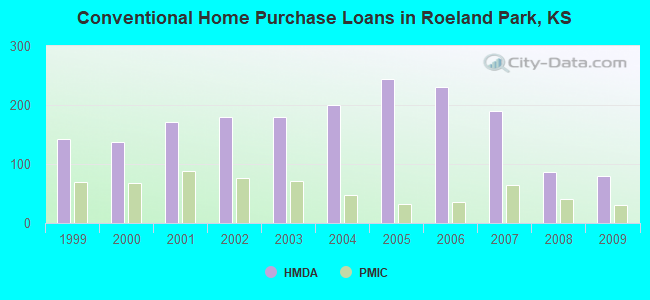
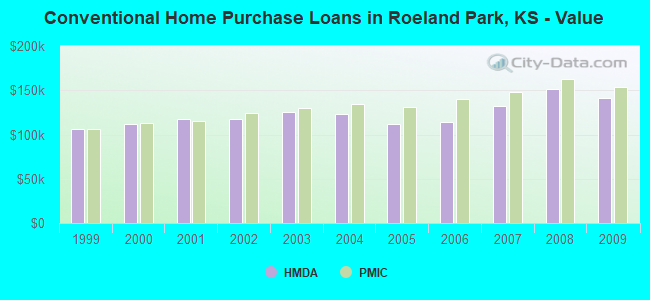
B) Conventional Home Purchase Loans
C) Refinancings
D) Home Improvement Loans
F) Non-occupant Loans on < 5 Family Dwellings (A B C & D)
G) Loans On Manufactured Home Dwelling (A B C & D)
Number
Average Value
Number
Average Value
Number
Average Value
Number
Average Value
Number
Average Value
Number
Average Value
LOANS ORIGINATED
87
$149,583
80
$141,702
239
$151,313
10
$62,740
23
$120,196
1
$108,810
APPLICATIONS APPROVED, NOT ACCEPTED
5
$142,310
3
$137,660
16
$150,121
2
$8,090
1
$54,670
0
$0
APPLICATIONS DENIED
5
$145,362
7
$170,793
49
$147,187
3
$56,800
2
$141,070
1
$47,270
APPLICATIONS WITHDRAWN
7
$150,447
6
$169,645
48
$151,989
1
$78,780
1
$222,580
0
$0
FILES CLOSED FOR INCOMPLETENESS
0
$0
0
$0
11
$144,372
2
$115,700
0
$0
0
$0
Aggregated Statistics For Year 2008 (Based on 1 full and 2 partial tracts)
A) FHA, FSA/RHS & VA Home Purchase Loans
B) Conventional Home Purchase Loans
C) Refinancings
D) Home Improvement Loans
F) Non-occupant Loans on < 5 Family Dwellings (A B C & D)
Number
Average Value
Number
Average Value
Number
Average Value
Number
Average Value
Number
Average Value
LOANS ORIGINATED
55
$151,245
87
$151,528
106
$144,908
20
$37,644
26
$108,597
APPLICATIONS APPROVED, NOT ACCEPTED
4
$137,290
14
$161,300
13
$145,590
3
$12,933
2
$226,740
APPLICATIONS DENIED
4
$129,512
5
$158,980
34
$156,160
11
$60,099
4
$99,975
APPLICATIONS WITHDRAWN
6
$148,537
9
$146,009
24
$196,951
3
$76,547
5
$158,002
FILES CLOSED FOR INCOMPLETENESS
1
$137,860
1
$137,530
7
$129,476
1
$18,680
1
$104,380
Aggregated Statistics For Year 2007 (Based on 1 full and 2 partial tracts)
A) FHA, FSA/RHS & VA Home Purchase Loans
B) Conventional Home Purchase Loans
C) Refinancings
D) Home Improvement Loans
F) Non-occupant Loans on < 5 Family Dwellings (A B C & D)
Number
Average Value
Number
Average Value
Number
Average Value
Number
Average Value
Number
Average Value
LOANS ORIGINATED
15
$131,431
190
$132,107
140
$136,986
19
$40,734
35
$141,564
APPLICATIONS APPROVED, NOT ACCEPTED
1
$141,730
18
$131,811
17
$137,243
5
$30,142
4
$104,290
APPLICATIONS DENIED
2
$143,275
13
$139,839
72
$144,149
13
$51,908
6
$115,525
APPLICATIONS WITHDRAWN
2
$95,255
15
$124,828
35
$137,053
5
$76,488
4
$89,102
FILES CLOSED FOR INCOMPLETENESS
0
$0
6
$150,025
19
$202,061
0
$0
2
$173,810
Aggregated Statistics For Year 2006 (Based on 1 full and 2 partial tracts)
A) FHA, FSA/RHS & VA Home Purchase Loans
B) Conventional Home Purchase Loans
C) Refinancings
D) Home Improvement Loans
E) Loans on Dwellings For 5+ Families
F) Non-occupant Loans on < 5 Family Dwellings (A B C & D)
Number
Average Value
Number
Average Value
Number
Average Value
Number
Average Value
Number
Average Value
Number
Average Value
LOANS ORIGINATED
16
$151,888
230
$113,704
172
$117,584
24
$47,822
2
$828,325
46
$117,815
APPLICATIONS APPROVED, NOT ACCEPTED
1
$156,350
16
$99,370
42
$91,439
6
$51,152
0
$0
4
$97,762
APPLICATIONS DENIED
0
$0
20
$120,045
91
$126,542
11
$78,237
0
$0
7
$110,981
APPLICATIONS WITHDRAWN
0
$0
25
$128,950
62
$126,094
6
$111,863
0
$0
1
$87,980
FILES CLOSED FOR INCOMPLETENESS
0
$0
9
$105,753
18
$122,935
2
$127,700
0
$0
1
$42,390
Aggregated Statistics For Year 2005 (Based on 1 full and 2 partial tracts)
A) FHA, FSA/RHS & VA Home Purchase Loans
B) Conventional Home Purchase Loans
C) Refinancings
D) Home Improvement Loans
F) Non-occupant Loans on < 5 Family Dwellings (A B C & D)
G) Loans On Manufactured Home Dwelling (A B C & D)
Number
Average Value
Number
Average Value
Number
Average Value
Number
Average Value
Number
Average Value
Number
Average Value
LOANS ORIGINATED
13
$140,117
244
$111,345
238
$119,539
29
$64,068
50
$103,187
0
$0
APPLICATIONS APPROVED, NOT ACCEPTED
3
$117,153
17
$117,780
30
$116,181
8
$26,386
6
$105,298
0
$0
APPLICATIONS DENIED
0
$0
20
$124,808
105
$126,118
13
$85,371
8
$125,152
0
$0
APPLICATIONS WITHDRAWN
3
$140,330
23
$133,081
100
$132,347
11
$97,435
7
$112,431
1
$142,780
FILES CLOSED FOR INCOMPLETENESS
0
$0
2
$185,520
13
$164,166
2
$35,160
1
$142,290
0
$0
Aggregated Statistics For Year 2004 (Based on 1 full and 2 partial tracts)
A) FHA, FSA/RHS & VA Home Purchase Loans
B) Conventional Home Purchase Loans
C) Refinancings
D) Home Improvement Loans
F) Non-occupant Loans on < 5 Family Dwellings (A B C & D)
Number
Average Value
Number
Average Value
Number
Average Value
Number
Average Value
Number
Average Value
LOANS ORIGINATED
28
$130,220
200
$122,788
279
$117,424
27
$54,002
38
$112,003
APPLICATIONS APPROVED, NOT ACCEPTED
2
$141,835
23
$103,915
35
$122,656
4
$57,445
3
$84,027
APPLICATIONS DENIED
1
$121,120
22
$107,065
93
$112,942
19
$60,969
5
$125,380
APPLICATIONS WITHDRAWN
2
$144,075
29
$127,878
75
$128,088
4
$24,670
7
$98,180
FILES CLOSED FOR INCOMPLETENESS
0
$0
7
$120,316
22
$130,126
2
$104,740
4
$96,852
Aggregated Statistics For Year 2003 (Based on 1 full and 2 partial tracts)
A) FHA, FSA/RHS & VA Home Purchase Loans
B) Conventional Home Purchase Loans
C) Refinancings
D) Home Improvement Loans
E) Loans on Dwellings For 5+ Families
F) Non-occupant Loans on < 5 Family Dwellings (A B C & D)
Number
Average Value
Number
Average Value
Number
Average Value
Number
Average Value
Number
Average Value
Number
Average Value
LOANS ORIGINATED
34
$129,246
180
$125,639
583
$114,712
17
$34,479
1
$196,420
50
$92,618
APPLICATIONS APPROVED, NOT ACCEPTED
2
$123,090
12
$122,748
47
$114,163
3
$50,030
0
$0
5
$84,988
APPLICATIONS DENIED
1
$114,230
14
$112,106
139
$112,049
6
$13,530
0
$0
8
$79,356
APPLICATIONS WITHDRAWN
0
$0
20
$109,352
108
$120,383
0
$0
0
$0
12
$84,508
FILES CLOSED FOR INCOMPLETENESS
0
$0
3
$152,137
30
$136,674
0
$0
0
$0
0
$0
Aggregated Statistics For Year 2002 (Based on 1 full and 2 partial tracts)
A) FHA, FSA/RHS & VA Home Purchase Loans
B) Conventional Home Purchase Loans
C) Refinancings
D) Home Improvement Loans
F) Non-occupant Loans on < 5 Family Dwellings (A B C & D)
Number
Average Value
Number
Average Value
Number
Average Value
Number
Average Value
Number
Average Value
LOANS ORIGINATED
38
$121,042
179
$117,125
391
$110,728
22
$22,939
41
$86,510
APPLICATIONS APPROVED, NOT ACCEPTED
2
$171,860
17
$100,941
35
$111,766
8
$30,882
3
$77,727
APPLICATIONS DENIED
1
$81,210
13
$100,810
95
$101,283
8
$23,625
7
$79,666
APPLICATIONS WITHDRAWN
1
$63,250
12
$104,007
88
$112,795
4
$48,982
2
$76,150
FILES CLOSED FOR INCOMPLETENESS
0
$0
6
$84,463
36
$125,366
0
$0
1
$67,060
Aggregated Statistics For Year 2001 (Based on 1 full and 2 partial tracts)
A) FHA, FSA/RHS & VA Home Purchase Loans
B) Conventional Home Purchase Loans
C) Refinancings
D) Home Improvement Loans
F) Non-occupant Loans on < 5 Family Dwellings (A B C & D)
Number
Average Value
Number
Average Value
Number
Average Value
Number
Average Value
Number
Average Value
LOANS ORIGINATED
63
$113,588
172
$116,959
347
$103,667
28
$25,676
29
$88,304
APPLICATIONS APPROVED, NOT ACCEPTED
1
$135,960
17
$98,086
33
$113,114
8
$23,435
3
$331,213
APPLICATIONS DENIED
1
$159,760
17
$86,060
68
$92,894
14
$16,340
1
$108,490
APPLICATIONS WITHDRAWN
4
$102,440
8
$105,548
76
$102,507
5
$27,168
2
$72,195
FILES CLOSED FOR INCOMPLETENESS
1
$54,760
5
$142,766
29
$113,922
3
$21,473
1
$70,900
Aggregated Statistics For Year 2000 (Based on 1 full and 2 partial tracts)
A) FHA, FSA/RHS & VA Home Purchase Loans
B) Conventional Home Purchase Loans
C) Refinancings
D) Home Improvement Loans
E) Loans on Dwellings For 5+ Families
F) Non-occupant Loans on < 5 Family Dwellings (A B C & D)
Number
Average Value
Number
Average Value
Number
Average Value
Number
Average Value
Number
Average Value
Number
Average Value
LOANS ORIGINATED
46
$107,312
138
$111,547
102
$83,345
17
$20,223
1
$22,549,630
16
$76,927
APPLICATIONS APPROVED, NOT ACCEPTED
1
$74,340
14
$97,391
18
$86,817
10
$23,825
0
$0
1
$15,360
APPLICATIONS DENIED
0
$0
23
$86,457
35
$82,643
17
$18,091
0
$0
3
$56,030
APPLICATIONS WITHDRAWN
2
$88,320
11
$90,302
23
$78,318
2
$17,705
1
$119,150
0
$0
FILES CLOSED FOR INCOMPLETENESS
0
$0
1
$169,180
15
$116,045
1
$97,450
0
$0
1
$49,230
Aggregated Statistics For Year 1999 (Based on 1 full and 2 partial tracts)
A) FHA, FSA/RHS & VA Home Purchase Loans
B) Conventional Home Purchase Loans
C) Refinancings
D) Home Improvement Loans
F) Non-occupant Loans on < 5 Family Dwellings (A B C & D)
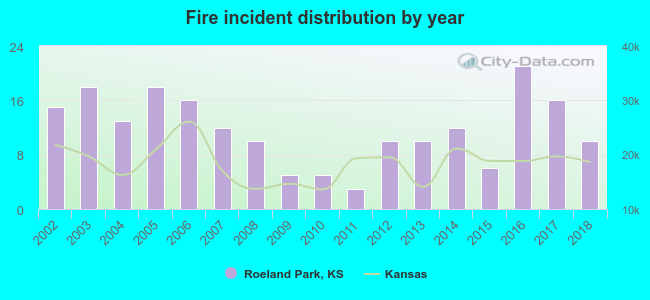
2002 - 2018 National Fire Incident Reporting System (NFIRS) incidents
According to the data from the years 2002 - 2018 the average number of fires per year is 12. The highest number of reported fire incidents - 21 took place in 2016, and the least - 3 in 2011. The data has a decreasing trend.
When looking into fire subcategories, the most reports belonged to: Structure Fires (43.5%), and Outside Fires (32.5%).
Fire incident types reported to NFIRS in Roeland Park, KS


 Recent articles from our blog. Our writers, many of them Ph.D. graduates or candidates, create easy-to-read articles on a wide variety of topics.

 (5.3 miles


 According to the data from the years 2002 - 2018 the average number of fires per year is 12. The highest number of reported fire incidents - 21 took place in 2016, and the least - 3 in 2011. The data has a decreasing trend.
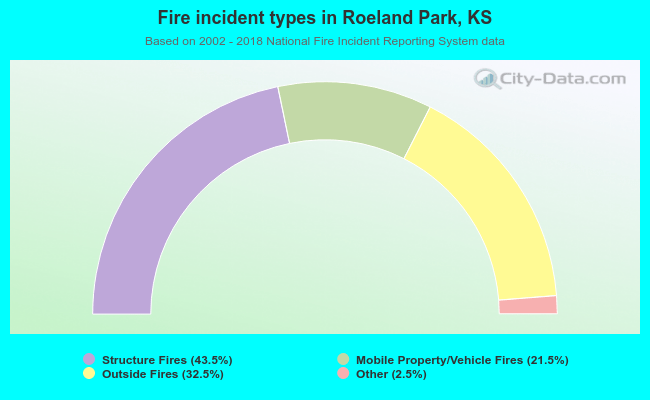 When looking into fire subcategories, the most reports belonged to: Structure Fires (43.5%), and Outside Fires (32.5%).