Races in Bel Air, Maryland (MD) Detailed Stats
Data:
Races - White alone (%)
Races - White alone (% change since 2000)
Races - Black alone (%)
Races - Black alone (% change since 2000)
Races - American Indian alone (%)
Races - American Indian alone (% change since 2000)
Races - Asian alone (%)
Races - Asian alone (% change since 2000)
Races - Hispanic (%)
Races - Hispanic (% change since 2000)
Races - Native Hawaiian and Other Pacific Islander alone (%)
Races - Native Hawaiian and Other Pacific Islander alone (% change since 2000)
Races - Two or more races(%)
Races - Two or more races(% change since 2000)
Races - Other race alone (%)
Races - Other race alone (% change since 2000)
Racial diversity
Place of birth - Born in state of residence (%)
Place of birth - Born in state of residence (%) - White
Place of birth - Born in state of residence (%) - Black or African American
Place of birth - Born in state of residence (%) - Asian
Place of birth - Born in state of residence (%) - Hispanic or Latino
Place of birth - Born in state of residence (%) - American Indian and Alaska Native
Place of birth - Born in state of residence (%) - Multirace
Place of birth - Born in state of residence (%) - Other Race
Place of birth - Born in other state (%)
Place of birth - Born in other state (%) - White
Place of birth - Born in other state (%) - Black or African American
Place of birth - Born in other state (%) - Asian
Place of birth - Born in other state (%) - Hispanic or Latino
Place of birth - Born in other state (%) - American Indian and Alaska Native
Place of birth - Born in other state (%) - Multirace
Place of birth - Born in other state (%) - Other Race
Place of birth - Native, outside of US (%)
Place of birth - Native, outside of US (%) - White
Place of birth - Native, outside of US (%) - Black or African American
Place of birth - Native, outside of US (%) - Asian
Place of birth - Native, outside of US (%) - Hispanic or Latino
Place of birth - Native, outside of US (%) - American Indian and Alaska Native
Place of birth - Native, outside of US (%) - Multirace
Place of birth - Native, outside of US (%) - Other Race
Place of birth - Foreign born (%)
Place of birth - Foreign born (%) - White
Place of birth - Foreign born (%) - Black or African American
Place of birth - Foreign born (%) - Asian
Place of birth - Foreign born (%) - Hispanic or Latino
Place of birth - Foreign born (%) - American Indian and Alaska Native
Place of birth - Foreign born (%) - Multirace
Place of birth - Foreign born (%) - Other Race
Residents speaking English at home (%)
Residents speaking English at home - Born in the United States (%)
Residents speaking English at home - Native, born elsewhere (%)
Residents speaking English at home - Foreign born (%)
Residents speaking Spanish at home (%)
Residents speaking Spanish at home - Born in the United States (%)
Residents speaking Spanish at home - Native, born elsewhere (%)
Residents speaking Spanish at home - Foreign born (%)
Residents speaking other language at home (%)
Residents speaking other language at home - Born in the United States (%)
Residents speaking other language at home - Native, born elsewhere (%)
Residents speaking other language at home - Foreign born (%)
Marital status - Never married (%)
Marital status - Now married (%)
Marital status - Separated (%)
Marital status - Widowed (%)
Marital status - Divorced (%)
Ancestries Reported - Arab (%)
Ancestries Reported - Czech (%)
Ancestries Reported - Danish (%)
Ancestries Reported - Dutch (%)
Ancestries Reported - English (%)
Ancestries Reported - French (%)
Ancestries Reported - French Canadian (%)
Ancestries Reported - German (%)
Ancestries Reported - Greek (%)
Ancestries Reported - Hungarian (%)
Ancestries Reported - Irish (%)
Ancestries Reported - Italian (%)
Ancestries Reported - Lithuanian (%)
Ancestries Reported - Norwegian (%)
Ancestries Reported - Polish (%)
Ancestries Reported - Portuguese (%)
Ancestries Reported - Russian (%)
Ancestries Reported - Scotch-Irish (%)
Ancestries Reported - Scottish (%)
Ancestries Reported - Slovak (%)
Ancestries Reported - Subsaharan African (%)
Ancestries Reported - Swedish (%)
Ancestries Reported - Swiss (%)
Ancestries Reported - Ukrainian (%)
Ancestries Reported - United States (%)
Ancestries Reported - Welsh (%)
Ancestries Reported - West Indian (%)
Ancestries Reported - Other (%)
Geographical mobility - Same house 1 year ago (%)
Geographical mobility - Same house 1 year ago (%) - White
Geographical mobility - Same house 1 year ago (%) - Black or African American
Geographical mobility - Same house 1 year ago (%) - Asian
Geographical mobility - Same house 1 year ago (%) - Hispanic or Latino
Geographical mobility - Same house 1 year ago (%) - American Indian and Alaska Native
Geographical mobility - Same house 1 year ago (%) - Multirace
Geographical mobility - Same house 1 year ago (%) - Other Race
Geographical mobility - Moved within same county (%)
Geographical mobility - Moved within same county (%) - White
Geographical mobility - Moved within same county (%) - Black or African American
Geographical mobility - Moved within same county (%) - Asian
Geographical mobility - Moved within same county (%) - Hispanic or Latino
Geographical mobility - Moved within same county (%) - American Indian and Alaska Native
Geographical mobility - Moved within same county (%) - Multirace
Geographical mobility - Moved within same county (%) - Other Race
Geographical mobility - Moved from different county within same state (%)
Geographical mobility - Moved from different county within same state (%) - White
Geographical mobility - Moved from different county within same state (%) - Black or African American
Geographical mobility - Moved from different county within same state (%) - Asian
Geographical mobility - Moved from different county within same state (%) - Hispanic or Latino
Geographical mobility - Moved from different county within same state (%) - American Indian and Alaska Native
Geographical mobility - Moved from different county within same state (%) - Multirace
Geographical mobility - Moved from different county within same state (%) - Other Race
Geographical mobility - Moved from different state (%)
Geographical mobility - Moved from different state (%) - White
Geographical mobility - Moved from different state (%) - Black or African American
Geographical mobility - Moved from different state (%) - Asian
Geographical mobility - Moved from different state (%) - Hispanic or Latino
Geographical mobility - Moved from different state (%) - American Indian and Alaska Native
Geographical mobility - Moved from different state (%) - Multirace
Geographical mobility - Moved from different state (%) - Other Race
Geographical mobility - Moved from abroad (%)
Geographical mobility - Moved from abroad (%) - White
Geographical mobility - Moved from abroad (%) - Black or African American
Geographical mobility - Moved from abroad (%) - Asian
Geographical mobility - Moved from abroad (%) - Hispanic or Latino
Geographical mobility - Moved from abroad (%) - American Indian and Alaska Native
Geographical mobility - Moved from abroad (%) - Multirace
Geographical mobility - Moved from abroad (%) - Other Race
Place of birth for the foreign-born population - Ireland (%)
Place of birth for the foreign-born population - Denmark (%)
Place of birth for the foreign-born population - Norway (%)
Place of birth for the foreign-born population - Sweden (%)
Place of birth for the foreign-born population - United Kingdom (%)
Place of birth for the foreign-born population - England (%)
Place of birth for the foreign-born population - Scotland (%)
Place of birth for the foreign-born population - Other Northern Europe (%)
Place of birth for the foreign-born population - Austria (%)
Place of birth for the foreign-born population - Belgium (%)
Place of birth for the foreign-born population - France (%)
Place of birth for the foreign-born population - Germany (%)
Place of birth for the foreign-born population - Netherlands (%)
Place of birth for the foreign-born population - Switzerland (%)
Place of birth for the foreign-born population - Other Western Europe (%)
Place of birth for the foreign-born population - Greece (%)
Place of birth for the foreign-born population - Italy (%)
Place of birth for the foreign-born population - Portugal (%)
Place of birth for the foreign-born population - Spain (%)
Place of birth for the foreign-born population - Other Southern Europe (%)
Place of birth for the foreign-born population - Albania (%)
Place of birth for the foreign-born population - Belarus (%)
Place of birth for the foreign-born population - Bosnia and Herzegovina (%)
Place of birth for the foreign-born population - Bulgaria (%)
Place of birth for the foreign-born population - Croatia (%)
Place of birth for the foreign-born population - Czechoslovakia (%)
Place of birth for the foreign-born population - Hungary (%)
Place of birth for the foreign-born population - Latvia (%)
Place of birth for the foreign-born population - Lithuania (%)
Place of birth for the foreign-born population - North Macedonia (Macedonia) (%)
Place of birth for the foreign-born population - Moldova (%)
Place of birth for the foreign-born population - Poland (%)
Place of birth for the foreign-born population - Romania (%)
Place of birth for the foreign-born population - Russia (%)
Place of birth for the foreign-born population - Serbia (%)
Place of birth for the foreign-born population - Ukraine (%)
Place of birth for the foreign-born population - Other Eastern Europe (%)
Place of birth for the foreign-born population - China (%)
Place of birth for the foreign-born population - Hong Kong (%)
Place of birth for the foreign-born population - Taiwan (%)
Place of birth for the foreign-born population - Japan (%)
Place of birth for the foreign-born population - Korea (%)
Place of birth for the foreign-born population - Other Eastern Asia (%)
Place of birth for the foreign-born population - Afghanistan (%)
Place of birth for the foreign-born population - Bangladesh (%)
Place of birth for the foreign-born population - India (%)
Place of birth for the foreign-born population - Iran (%)
Place of birth for the foreign-born population - Kazakhstan (%)
Place of birth for the foreign-born population - Nepal (%)
Place of birth for the foreign-born population - Pakistan (%)
Place of birth for the foreign-born population - Sri Lanka (%)
Place of birth for the foreign-born population - Uzbekistan (%)
Place of birth for the foreign-born population - Other South Central Asia (%)
Place of birth for the foreign-born population - Burma (%)
Place of birth for the foreign-born population - Cambodia (%)
Place of birth for the foreign-born population - Indonesia (%)
Place of birth for the foreign-born population - Laos (%)
Place of birth for the foreign-born population - Malaysia (%)
Place of birth for the foreign-born population - Philippines (%)
Place of birth for the foreign-born population - Singapore (%)
Place of birth for the foreign-born population - Thailand (%)
Place of birth for the foreign-born population - Vietnam (%)
Place of birth for the foreign-born population - Other South Eastern Asia (%)
Place of birth for the foreign-born population - Armenia (%)
Place of birth for the foreign-born population - Iraq (%)
Place of birth for the foreign-born population - Israel (%)
Place of birth for the foreign-born population - Jordan (%)
Place of birth for the foreign-born population - Kuwait (%)
Place of birth for the foreign-born population - Lebanon (%)
Place of birth for the foreign-born population - Saudi Arabia (%)
Place of birth for the foreign-born population - Syria (%)
Place of birth for the foreign-born population - Turkey (%)
Place of birth for the foreign-born population - Yemen (%)
Place of birth for the foreign-born population - Other Western Asia (%)
Place of birth for the foreign-born population - Eritrea (%)
Place of birth for the foreign-born population - Ethiopia (%)
Place of birth for the foreign-born population - Kenya (%)
Place of birth for the foreign-born population - Somalia (%)
Place of birth for the foreign-born population - Uganda (%)
Place of birth for the foreign-born population - Zimbabwe (%)
Place of birth for the foreign-born population - Other Eastern Africa (%)
Place of birth for the foreign-born population - Cameroon (%)
Place of birth for the foreign-born population - Congo (%)
Place of birth for the foreign-born population - Democratic Republic of Congo (Zaire) (%)
Place of birth for the foreign-born population - Other Middle Africa (%)
Place of birth for the foreign-born population - Egypt (%)
Place of birth for the foreign-born population - Morocco (%)
Place of birth for the foreign-born population - Sudan (%)
Place of birth for the foreign-born population - Other Northern Africa (%)
Place of birth for the foreign-born population - South Africa (%)
Place of birth for the foreign-born population - Other Southern Africa (%)
Place of birth for the foreign-born population - Cabo Verde (%)
Place of birth for the foreign-born population - Ghana (%)
Place of birth for the foreign-born population - Liberia (%)
Place of birth for the foreign-born population - Nigeria (%)
Place of birth for the foreign-born population - Senegal (%)
Place of birth for the foreign-born population - Sierra Leone (%)
Place of birth for the foreign-born population - Other Western Africa (%)
Place of birth for the foreign-born population - Australia (%)
Place of birth for the foreign-born population - New Zealand (%)
Place of birth for the foreign-born population - Fiji (%)
Place of birth for the foreign-born population - Micronesia (%)
Place of birth for the foreign-born population - Bahamas (%)
Place of birth for the foreign-born population - Barbados (%)
Place of birth for the foreign-born population - Cuba (%)
Place of birth for the foreign-born population - Dominica (%)
Place of birth for the foreign-born population - Dominican Republic (%)
Place of birth for the foreign-born population - Grenada (%)
Place of birth for the foreign-born population - Haiti (%)
Place of birth for the foreign-born population - Jamaica (%)
Place of birth for the foreign-born population - St. Vincent and the Grenadines (%)
Place of birth for the foreign-born population - Trinidad and Tobago (%)
Place of birth for the foreign-born population - West Indies (%)
Place of birth for the foreign-born population - Other Caribbean (%)
Place of birth for the foreign-born population - Belize (%)
Place of birth for the foreign-born population - Costa Rica (%)
Place of birth for the foreign-born population - El Salvador (%)
Place of birth for the foreign-born population - Guatemala (%)
Place of birth for the foreign-born population - Honduras (%)
Place of birth for the foreign-born population - Mexico (%)
Place of birth for the foreign-born population - Nicaragua (%)
Place of birth for the foreign-born population - Panama (%)
Place of birth for the foreign-born population - Other Central America (%)
Place of birth for the foreign-born population - Argentina (%)
Place of birth for the foreign-born population - Bolivia (%)
Place of birth for the foreign-born population - Brazil (%)
Place of birth for the foreign-born population - Chile (%)
Place of birth for the foreign-born population - Colombia (%)
Place of birth for the foreign-born population - Ecuador (%)
Place of birth for the foreign-born population - Guyana (%)
Place of birth for the foreign-born population - Peru (%)
Place of birth for the foreign-born population - Uruguay (%)
Place of birth for the foreign-born population - Venezuela (%)
Place of birth for the foreign-born population - Other South America (%)
Place of birth for the foreign-born population - Canada (%)
Place of birth for the foreign-born population - Other Northern America (%)
Place of birth for the foreign-born population - Other (%)
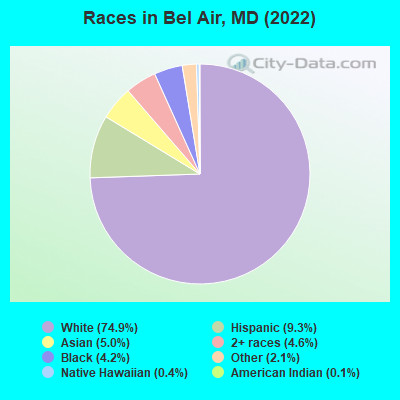
According to 2022 data, the most numerous races in Bel Air, MD are White alone (8,049 residents), Black alone (447 residents), and Hispanic (994 residents). 88.6% of Bel Air residents speak English at home. 7.5% of Bel Air, MD residents are foreign-born (3.8% born in Asia, 2.6% born in Latin America, 0.8% born in Europe), which is 112.2% less than the foreign-born rate of 16.0% across the entire state of Maryland.
Race distribution in Bel Air
2000 2022
3,286,547 62.1% White alone 1,464,735 27.7% Black alone 227,916 4.3% Hispanic 209,738 4.0% Asian alone 82,946 1.6% Two or more races 13,312 0.3% American Indian alone 9,379 0.2% Other race alone 1,913 0.04% Native Hawaiian and Other
2,906,492 47.1% White alone 1,800,914 29.2% Black alone 705,842 11.4% Hispanic 401,818 6.5% Asian alone 291,317 4.7% Two or more races 46,930 0.8% Other race alone 8,930 0.1% American Indian alone 2,417 0.04% Native Hawaiian and Other
Income and house value in Bel Air Median household income in 2022 $73,570 White non-Hispanic householders$42,172 Black householders$33,747 Asian householders$40,588 Some other race householders$70,432 Two or more races householdersMedian 2022 house value $345,046 White Non-Hispanic householders$307,005 Black or African American householders $274,330 Asian householders$207,271 Some other race householders$274,330 Two or more races householders$219,464 Hispanic or Latino householders
Median age by race in Bel Air
42.5 Median age for White residents41.8 43.7 43.1 Median age for Black or African American residents41.0 61.4 34.7 Median age for American Indian / Alaska Native residents-642,487,046.0 -676,818,950.3 46.8 Median age for Asian residents44.1 53.5 -763,333,332.6 Median age for Native Hawaiian / Pacific Islander residents-666,666,666.0 -760,942,760.2 38.6 Median age for Other race residents39.0 71.2 16.3 Median age for Two or more races residents18.6 12.1 42.5 Median age for White alone residents41.9 44.1 33.9 Median age for Hispanic or Latino residents37.6 28.0
Owner/renter occupied households by race in Bel Air
House owners and renters - White residents 2,600 61.6% Owner occupied1,618 38.4% Renter occupiedHouse owners and renters - Black or African American residents 44 20.9% Owner occupied164 79.1% Renter occupiedHouse owners and renters - American Indian / Alaska Native residents 8 100.0% Renter occupiedHouse owners and renters - Asian residents 122 63.9% Owner occupied69 36.1% Renter occupiedHouse owners and renters - Other race residents 53 28.9% Owner occupied129 71.1% Renter occupiedHouse owners and renters - Two or more races residents 138 81.0% Owner occupied32 19.0% Renter occupiedHouse owners and renters - White alone residents 2,508 62.0% Owner occupied1,535 38.0% Renter occupiedHouse owners and renters - Hispanic or Latino residents 141 37.6% Owner occupied234 62.4% Renter occupied
Language usage in Bel Air
English speakers - Total 88.6% of residents of Bel Air speak English at home.
6.8% of residents speak Spanish at home 252 35.9% Speak English very well449 64.1% Speak English less than very well5.9% of residents speak other language at home 149 24.3% Speak English very well464 75.7% Speak English less than very well
English speakers - Born in the United States 96.1% of residents of Bel Air speak English at home.
2.0% of residents speak Spanish at home 46 75.4% Speak English very well15 24.6% Speak English less than very well1.6% of residents speak other language at home 39 81.2% Speak English very well9 18.8% Speak English less than very well
English speakers - Native, born elsewhere 34.1% of residents of Bel Air speak English at home.
77.7% of residents speak Spanish at home 65 23.0% Speak English very well218 77.0% Speak English less than very well8.0% of residents speak other language at home 29 100.0% Speak English less than very well
English speakers - Foreign-born 26.3% of residents of Bel Air speak English at home.
25.6% of residents speak Spanish at home 67 28.9% Speak English very well165 71.1% Speak English less than very well50.3% of residents speak other language at home 102 22.3% Speak English very well355 77.7% Speak English less than very well
White (Caucasian) - Speak only English Native:
97.4% (7,606)Foreign-born:
51.2% (178)
White (Caucasian) - Speak another language Native:
2.6% (204)Foreign-born:
50.2% (175)
Asian - Speak only English Native:
90.5% (90)Foreign-born:
20.6% (96)
Asian - Speak another language Native:
13.7% (14)Foreign-born:
73.6% (344)
Other race - Speak another language Native:
54.5% (244)Foreign-born:
97.2% (72)
Two or more races - Speak another language Native:
13.0% (67)Foreign-born:
94.1% (31)
White alone - Speak only English Native:
97.2% (7,313)Foreign-born:
59.6% (184)
White alone - Speak another language Native:
2.9% (220)Foreign-born:
44.1% (136)
Hispanic or Latino - Speak only English Native:
55.6% (402)Foreign-born:
5.1% (9)
Hispanic or Latino - Speak another language Native:
41.0% (296)Foreign-born:
99.2% (168)
Foreign-born residents in Bel Air 810 residents are foreign born (3.8% Asia , 2.6% Latin America , 0.8% Europe ).
This city:
7.5%Maryland:
15.7%
Marital status for residents in Bel Air Marital status - White (Caucasian) population 15 years and over
Males 35.7% Never married42.8% Now married1.6% Separated2.5% Widowed17.4% DivorcedFemales 32.5% Never married39.8% Now married2.1% Separated10.8% Widowed14.8% DivorcedWomen who gave birth in the past 12 months Now married:
82.6% (36)Unmarried:
17.4% (8)
Women who did not give birth in the past 12 months Now married:
34.4% (677)Unmarried:
65.6% (1,290)
Marital status - Black or African American population 15 years and over
Males 73.7% Never married7.5% Now married0.0% Separated3.4% Widowed15.4% DivorcedFemales 27.9% Never married31.3% Now married0.0% Separated7.5% Widowed33.3% DivorcedWomen who did not give birth in the past 12 months Now married:
47.4% (27)Unmarried:
52.6% (30)
Marital status - American Indian / Alaska Native population 15 years and over
Males 46.2% Never married53.8% Now married0.0% Separated0.0% Widowed0.0% DivorcedFemales 100.0% Never married0.0% Now married0.0% Separated0.0% Widowed0.0% DivorcedWomen who did not give birth in the past 12 months Now married:
0.0% (0)Unmarried:
100.0% (7)
Marital status - Asian population 15 years and over
Males 36.1% Never married63.9% Now married0.0% Separated0.0% Widowed0.0% DivorcedFemales 0.0% Never married100.0% Now married0.0% Separated0.0% Widowed0.0% DivorcedWomen who did not give birth in the past 12 months Now married:
100.0% (68)Unmarried:
0.0% (0)
Marital status - Other race population 15 years and over
Males 68.5% Never married11.7% Now married0.0% Separated0.0% Widowed19.8% DivorcedFemales 16.9% Never married76.1% Now married0.0% Separated0.0% Widowed7.0% DivorcedWomen who did not give birth in the past 12 months Now married:
25.0% (10)Unmarried:
75.0% (30)
Marital status - Two or more races population 15 years and over
Males 57.5% Never married33.3% Now married0.0% Separated0.0% Widowed9.2% DivorcedFemales 55.7% Never married44.3% Now married0.0% Separated0.0% Widowed0.0% DivorcedWomen who gave birth in the past 12 months Now married:
100.0% (10)Unmarried:
0.0% (0)
Women who did not give birth in the past 12 months Now married:
34.1% (34)Unmarried:
65.9% (65)
Marital status - White alone, not Hispanic / Latino population 15 years and over
Males 37.2% Never married42.8% Now married1.5% Separated2.7% Widowed15.8% DivorcedFemales 33.0% Never married39.7% Now married2.2% Separated11.1% Widowed13.9% DivorcedWomen who gave birth in the past 12 months Now married:
82.6% (37)Unmarried:
17.4% (8)
Women who did not give birth in the past 12 months Now married:
34.1% (666)Unmarried:
65.9% (1,284)
Marital status - Hispanic or Latino population 15 years and over
Males 47.7% Never married20.4% Now married0.9% Separated0.0% Widowed31.0% DivorcedFemales 13.0% Never married53.9% Now married0.0% Separated0.0% Widowed33.2% DivorcedWomen who gave birth in the past 12 months Now married:
100.0% (9)Unmarried:
0.0% (0)
Women who did not give birth in the past 12 months Now married:
66.7% (57)Unmarried:
33.3% (28)
Ancestries in Bel Air
592 12.5% German351 7.4% English335 7.0% Irish267 5.6% Italian191 4.0% American153 3.2% Polish147 3.1% European129 2.7% African124 2.6% Greek55 1.2% Ukrainian47 1.0% Scotch-Irish43 0.9% Scottish32 0.7% Russian26 0.5% Iranian17 0.4% Dutch17 0.4% Slavic16 0.3% Norwegian13 0.3% Welsh12 0.3% French9 0.2% British9 0.2% Finnish4 0.08% Slovak
Children Nativity (place of birth) in Bel Air
Children under 6 years - Living with two parents Both parents native 314 100.0% NativeOne native, one foreign-born parent 45 100.0% NativeChildren under 6 years - Living with one parent Native parent 134 100.0% NativeChildren 6 to 17 years - Living with two parents Both parents native 657 100.0% NativeBoth parents foreign-born 140 100.0% NativeOne native, one foreign-born parent 60 100.0% NativeChildren 6 to 17 years - Living with one parent Native parent 392 100.0% NativeForeign-born parent 9 47.4% Native10 52.6% Foreign-born
Grandparents responsible for own grandchildren in Bel Air
Grandparents (30 to 59 years) White / Caucasian 20 33.5% Responsible for grandchildren41 66.5% Not responsible for grandchildrenWhite alone, not Hispanic / Latino 20 48.6% Responsible for grandchildren22 51.4% Not responsible for grandchildrenHispanic or Latino 12 100.0% Not responsible for grandchildren
Grandparents (60 years and over) White / Caucasian 63 100.0% Responsible for grandchildrenWhite alone, not Hispanic / Latino 63 100.0% Responsible for grandchildren