Races in Beltsville, Maryland (MD) Detailed Stats
Data:
Races - White alone (%)
Races - White alone (% change since 2000)
Races - Black alone (%)
Races - Black alone (% change since 2000)
Races - American Indian alone (%)
Races - American Indian alone (% change since 2000)
Races - Asian alone (%)
Races - Asian alone (% change since 2000)
Races - Hispanic (%)
Races - Hispanic (% change since 2000)
Races - Native Hawaiian and Other Pacific Islander alone (%)
Races - Native Hawaiian and Other Pacific Islander alone (% change since 2000)
Races - Two or more races(%)
Races - Two or more races(% change since 2000)
Races - Other race alone (%)
Races - Other race alone (% change since 2000)
Racial diversity
Place of birth - Born in state of residence (%)
Place of birth - Born in state of residence (%) - White
Place of birth - Born in state of residence (%) - Black or African American
Place of birth - Born in state of residence (%) - Asian
Place of birth - Born in state of residence (%) - Hispanic or Latino
Place of birth - Born in state of residence (%) - American Indian and Alaska Native
Place of birth - Born in state of residence (%) - Multirace
Place of birth - Born in state of residence (%) - Other Race
Place of birth - Born in other state (%)
Place of birth - Born in other state (%) - White
Place of birth - Born in other state (%) - Black or African American
Place of birth - Born in other state (%) - Asian
Place of birth - Born in other state (%) - Hispanic or Latino
Place of birth - Born in other state (%) - American Indian and Alaska Native
Place of birth - Born in other state (%) - Multirace
Place of birth - Born in other state (%) - Other Race
Place of birth - Native, outside of US (%)
Place of birth - Native, outside of US (%) - White
Place of birth - Native, outside of US (%) - Black or African American
Place of birth - Native, outside of US (%) - Asian
Place of birth - Native, outside of US (%) - Hispanic or Latino
Place of birth - Native, outside of US (%) - American Indian and Alaska Native
Place of birth - Native, outside of US (%) - Multirace
Place of birth - Native, outside of US (%) - Other Race
Place of birth - Foreign born (%)
Place of birth - Foreign born (%) - White
Place of birth - Foreign born (%) - Black or African American
Place of birth - Foreign born (%) - Asian
Place of birth - Foreign born (%) - Hispanic or Latino
Place of birth - Foreign born (%) - American Indian and Alaska Native
Place of birth - Foreign born (%) - Multirace
Place of birth - Foreign born (%) - Other Race
Residents speaking English at home (%)
Residents speaking English at home - Born in the United States (%)
Residents speaking English at home - Native, born elsewhere (%)
Residents speaking English at home - Foreign born (%)
Residents speaking Spanish at home (%)
Residents speaking Spanish at home - Born in the United States (%)
Residents speaking Spanish at home - Native, born elsewhere (%)
Residents speaking Spanish at home - Foreign born (%)
Residents speaking other language at home (%)
Residents speaking other language at home - Born in the United States (%)
Residents speaking other language at home - Native, born elsewhere (%)
Residents speaking other language at home - Foreign born (%)
Marital status - Never married (%)
Marital status - Now married (%)
Marital status - Separated (%)
Marital status - Widowed (%)
Marital status - Divorced (%)
Ancestries Reported - Arab (%)
Ancestries Reported - Czech (%)
Ancestries Reported - Danish (%)
Ancestries Reported - Dutch (%)
Ancestries Reported - English (%)
Ancestries Reported - French (%)
Ancestries Reported - French Canadian (%)
Ancestries Reported - German (%)
Ancestries Reported - Greek (%)
Ancestries Reported - Hungarian (%)
Ancestries Reported - Irish (%)
Ancestries Reported - Italian (%)
Ancestries Reported - Lithuanian (%)
Ancestries Reported - Norwegian (%)
Ancestries Reported - Polish (%)
Ancestries Reported - Portuguese (%)
Ancestries Reported - Russian (%)
Ancestries Reported - Scotch-Irish (%)
Ancestries Reported - Scottish (%)
Ancestries Reported - Slovak (%)
Ancestries Reported - Subsaharan African (%)
Ancestries Reported - Swedish (%)
Ancestries Reported - Swiss (%)
Ancestries Reported - Ukrainian (%)
Ancestries Reported - United States (%)
Ancestries Reported - Welsh (%)
Ancestries Reported - West Indian (%)
Ancestries Reported - Other (%)
Geographical mobility - Same house 1 year ago (%)
Geographical mobility - Same house 1 year ago (%) - White
Geographical mobility - Same house 1 year ago (%) - Black or African American
Geographical mobility - Same house 1 year ago (%) - Asian
Geographical mobility - Same house 1 year ago (%) - Hispanic or Latino
Geographical mobility - Same house 1 year ago (%) - American Indian and Alaska Native
Geographical mobility - Same house 1 year ago (%) - Multirace
Geographical mobility - Same house 1 year ago (%) - Other Race
Geographical mobility - Moved within same county (%)
Geographical mobility - Moved within same county (%) - White
Geographical mobility - Moved within same county (%) - Black or African American
Geographical mobility - Moved within same county (%) - Asian
Geographical mobility - Moved within same county (%) - Hispanic or Latino
Geographical mobility - Moved within same county (%) - American Indian and Alaska Native
Geographical mobility - Moved within same county (%) - Multirace
Geographical mobility - Moved within same county (%) - Other Race
Geographical mobility - Moved from different county within same state (%)
Geographical mobility - Moved from different county within same state (%) - White
Geographical mobility - Moved from different county within same state (%) - Black or African American
Geographical mobility - Moved from different county within same state (%) - Asian
Geographical mobility - Moved from different county within same state (%) - Hispanic or Latino
Geographical mobility - Moved from different county within same state (%) - American Indian and Alaska Native
Geographical mobility - Moved from different county within same state (%) - Multirace
Geographical mobility - Moved from different county within same state (%) - Other Race
Geographical mobility - Moved from different state (%)
Geographical mobility - Moved from different state (%) - White
Geographical mobility - Moved from different state (%) - Black or African American
Geographical mobility - Moved from different state (%) - Asian
Geographical mobility - Moved from different state (%) - Hispanic or Latino
Geographical mobility - Moved from different state (%) - American Indian and Alaska Native
Geographical mobility - Moved from different state (%) - Multirace
Geographical mobility - Moved from different state (%) - Other Race
Geographical mobility - Moved from abroad (%)
Geographical mobility - Moved from abroad (%) - White
Geographical mobility - Moved from abroad (%) - Black or African American
Geographical mobility - Moved from abroad (%) - Asian
Geographical mobility - Moved from abroad (%) - Hispanic or Latino
Geographical mobility - Moved from abroad (%) - American Indian and Alaska Native
Geographical mobility - Moved from abroad (%) - Multirace
Geographical mobility - Moved from abroad (%) - Other Race
Place of birth for the foreign-born population - Ireland (%)
Place of birth for the foreign-born population - Denmark (%)
Place of birth for the foreign-born population - Norway (%)
Place of birth for the foreign-born population - Sweden (%)
Place of birth for the foreign-born population - United Kingdom (%)
Place of birth for the foreign-born population - England (%)
Place of birth for the foreign-born population - Scotland (%)
Place of birth for the foreign-born population - Other Northern Europe (%)
Place of birth for the foreign-born population - Austria (%)
Place of birth for the foreign-born population - Belgium (%)
Place of birth for the foreign-born population - France (%)
Place of birth for the foreign-born population - Germany (%)
Place of birth for the foreign-born population - Netherlands (%)
Place of birth for the foreign-born population - Switzerland (%)
Place of birth for the foreign-born population - Other Western Europe (%)
Place of birth for the foreign-born population - Greece (%)
Place of birth for the foreign-born population - Italy (%)
Place of birth for the foreign-born population - Portugal (%)
Place of birth for the foreign-born population - Spain (%)
Place of birth for the foreign-born population - Other Southern Europe (%)
Place of birth for the foreign-born population - Albania (%)
Place of birth for the foreign-born population - Belarus (%)
Place of birth for the foreign-born population - Bosnia and Herzegovina (%)
Place of birth for the foreign-born population - Bulgaria (%)
Place of birth for the foreign-born population - Croatia (%)
Place of birth for the foreign-born population - Czechoslovakia (%)
Place of birth for the foreign-born population - Hungary (%)
Place of birth for the foreign-born population - Latvia (%)
Place of birth for the foreign-born population - Lithuania (%)
Place of birth for the foreign-born population - North Macedonia (Macedonia) (%)
Place of birth for the foreign-born population - Moldova (%)
Place of birth for the foreign-born population - Poland (%)
Place of birth for the foreign-born population - Romania (%)
Place of birth for the foreign-born population - Russia (%)
Place of birth for the foreign-born population - Serbia (%)
Place of birth for the foreign-born population - Ukraine (%)
Place of birth for the foreign-born population - Other Eastern Europe (%)
Place of birth for the foreign-born population - China (%)
Place of birth for the foreign-born population - Hong Kong (%)
Place of birth for the foreign-born population - Taiwan (%)
Place of birth for the foreign-born population - Japan (%)
Place of birth for the foreign-born population - Korea (%)
Place of birth for the foreign-born population - Other Eastern Asia (%)
Place of birth for the foreign-born population - Afghanistan (%)
Place of birth for the foreign-born population - Bangladesh (%)
Place of birth for the foreign-born population - India (%)
Place of birth for the foreign-born population - Iran (%)
Place of birth for the foreign-born population - Kazakhstan (%)
Place of birth for the foreign-born population - Nepal (%)
Place of birth for the foreign-born population - Pakistan (%)
Place of birth for the foreign-born population - Sri Lanka (%)
Place of birth for the foreign-born population - Uzbekistan (%)
Place of birth for the foreign-born population - Other South Central Asia (%)
Place of birth for the foreign-born population - Burma (%)
Place of birth for the foreign-born population - Cambodia (%)
Place of birth for the foreign-born population - Indonesia (%)
Place of birth for the foreign-born population - Laos (%)
Place of birth for the foreign-born population - Malaysia (%)
Place of birth for the foreign-born population - Philippines (%)
Place of birth for the foreign-born population - Singapore (%)
Place of birth for the foreign-born population - Thailand (%)
Place of birth for the foreign-born population - Vietnam (%)
Place of birth for the foreign-born population - Other South Eastern Asia (%)
Place of birth for the foreign-born population - Armenia (%)
Place of birth for the foreign-born population - Iraq (%)
Place of birth for the foreign-born population - Israel (%)
Place of birth for the foreign-born population - Jordan (%)
Place of birth for the foreign-born population - Kuwait (%)
Place of birth for the foreign-born population - Lebanon (%)
Place of birth for the foreign-born population - Saudi Arabia (%)
Place of birth for the foreign-born population - Syria (%)
Place of birth for the foreign-born population - Turkey (%)
Place of birth for the foreign-born population - Yemen (%)
Place of birth for the foreign-born population - Other Western Asia (%)
Place of birth for the foreign-born population - Eritrea (%)
Place of birth for the foreign-born population - Ethiopia (%)
Place of birth for the foreign-born population - Kenya (%)
Place of birth for the foreign-born population - Somalia (%)
Place of birth for the foreign-born population - Uganda (%)
Place of birth for the foreign-born population - Zimbabwe (%)
Place of birth for the foreign-born population - Other Eastern Africa (%)
Place of birth for the foreign-born population - Cameroon (%)
Place of birth for the foreign-born population - Congo (%)
Place of birth for the foreign-born population - Democratic Republic of Congo (Zaire) (%)
Place of birth for the foreign-born population - Other Middle Africa (%)
Place of birth for the foreign-born population - Egypt (%)
Place of birth for the foreign-born population - Morocco (%)
Place of birth for the foreign-born population - Sudan (%)
Place of birth for the foreign-born population - Other Northern Africa (%)
Place of birth for the foreign-born population - South Africa (%)
Place of birth for the foreign-born population - Other Southern Africa (%)
Place of birth for the foreign-born population - Cabo Verde (%)
Place of birth for the foreign-born population - Ghana (%)
Place of birth for the foreign-born population - Liberia (%)
Place of birth for the foreign-born population - Nigeria (%)
Place of birth for the foreign-born population - Senegal (%)
Place of birth for the foreign-born population - Sierra Leone (%)
Place of birth for the foreign-born population - Other Western Africa (%)
Place of birth for the foreign-born population - Australia (%)
Place of birth for the foreign-born population - New Zealand (%)
Place of birth for the foreign-born population - Fiji (%)
Place of birth for the foreign-born population - Micronesia (%)
Place of birth for the foreign-born population - Bahamas (%)
Place of birth for the foreign-born population - Barbados (%)
Place of birth for the foreign-born population - Cuba (%)
Place of birth for the foreign-born population - Dominica (%)
Place of birth for the foreign-born population - Dominican Republic (%)
Place of birth for the foreign-born population - Grenada (%)
Place of birth for the foreign-born population - Haiti (%)
Place of birth for the foreign-born population - Jamaica (%)
Place of birth for the foreign-born population - St. Vincent and the Grenadines (%)
Place of birth for the foreign-born population - Trinidad and Tobago (%)
Place of birth for the foreign-born population - West Indies (%)
Place of birth for the foreign-born population - Other Caribbean (%)
Place of birth for the foreign-born population - Belize (%)
Place of birth for the foreign-born population - Costa Rica (%)
Place of birth for the foreign-born population - El Salvador (%)
Place of birth for the foreign-born population - Guatemala (%)
Place of birth for the foreign-born population - Honduras (%)
Place of birth for the foreign-born population - Mexico (%)
Place of birth for the foreign-born population - Nicaragua (%)
Place of birth for the foreign-born population - Panama (%)
Place of birth for the foreign-born population - Other Central America (%)
Place of birth for the foreign-born population - Argentina (%)
Place of birth for the foreign-born population - Bolivia (%)
Place of birth for the foreign-born population - Brazil (%)
Place of birth for the foreign-born population - Chile (%)
Place of birth for the foreign-born population - Colombia (%)
Place of birth for the foreign-born population - Ecuador (%)
Place of birth for the foreign-born population - Guyana (%)
Place of birth for the foreign-born population - Peru (%)
Place of birth for the foreign-born population - Uruguay (%)
Place of birth for the foreign-born population - Venezuela (%)
Place of birth for the foreign-born population - Other South America (%)
Place of birth for the foreign-born population - Canada (%)
Place of birth for the foreign-born population - Other Northern America (%)
Place of birth for the foreign-born population - Other (%)
Latest news about races in Beltsville, MD collected exclusively by city-data.com from local newspapers, TV, and radio stations
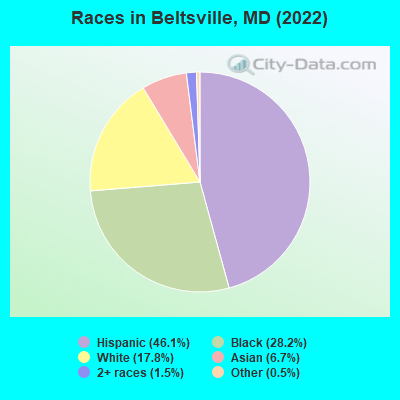
According to 2022 data, the most numerous races in Beltsville, MD are White alone (3,473 residents), Black alone (5,497 residents), and Hispanic (8,987 residents). 44.8% of Beltsville residents speak English at home. 43.6% of Beltsville, MD residents are foreign-born (24.7% born in Latin America, 8.5% born in Africa, 5.6% born in Asia), which is 63.3% greater than the foreign-born rate of 16.0% across the entire state of Maryland.
Race distribution in Beltsville
2000 2022
3,286,547 62.1% White alone 1,464,735 27.7% Black alone 227,916 4.3% Hispanic 209,738 4.0% Asian alone 82,946 1.6% Two or more races 13,312 0.3% American Indian alone 9,379 0.2% Other race alone 1,913 0.04% Native Hawaiian and Other
2,906,492 47.1% White alone 1,800,914 29.2% Black alone 705,842 11.4% Hispanic 401,818 6.5% Asian alone 291,317 4.7% Two or more races 46,930 0.8% Other race alone 8,930 0.1% American Indian alone 2,417 0.04% Native Hawaiian and Other
Income and house value in Beltsville Median household income in 2022 $92,402 White non-Hispanic householders$91,199 Black householders$111,738 Asian householders$94,043 Some other race householders$116,242 Two or more races householders$90,905 Hispanic or Latino race householdersMedian 2022 house value $425,797 White Non-Hispanic householders$448,250 Black or African American householders$394,257 American Indian or Alaska Native householders $495,561 Asian householders$460,546 Some other race householders$373,943 Two or more races householders$441,835 Hispanic or Latino householders
Median age by race in Beltsville
63.0 Median age for White residents56.6 70.5 43.4 Median age for Black or African American residents44.0 43.5 -780,410,741.7 Median age for American Indian / Alaska Native residents-888,297,871.5 -689,905,591.2 54.1 Median age for Asian residents44.9 58.5 -571,600,480.8 Median age for Native Hawaiian / Pacific Islander residents-720,061,021.4 -760,942,760.2 21.1 Median age for Other race residents20.1 22.5 21.2 Median age for Two or more races residents20.1 27.9 72.1 Median age for White alone residents67.8 73.3 20.8 Median age for Hispanic or Latino residents19.9 22.1
Owner/renter occupied households by race in Beltsville
House owners and renters - White residents 1,095 49.4% Owner occupied1,122 50.6% Renter occupiedHouse owners and renters - Black or African American residents 1,206 58.8% Owner occupied846 41.2% Renter occupiedHouse owners and renters - American Indian / Alaska Native residents 31 100.0% Owner occupiedHouse owners and renters - Asian residents 446 92.7% Owner occupied35 7.3% Renter occupiedHouse owners and renters - Other race residents 607 45.4% Owner occupied731 54.6% Renter occupiedHouse owners and renters - Two or more races residents 257 59.6% Owner occupied175 40.4% Renter occupiedHouse owners and renters - White alone residents 1,049 49.5% Owner occupied1,070 50.5% Renter occupiedHouse owners and renters - Hispanic or Latino residents 921 49.2% Owner occupied949 50.8% Renter occupied
Language usage in Beltsville
English speakers - Total 44.8% of residents of Beltsville speak English at home.
38.4% of residents speak Spanish at home 3,255 47.0% Speak English very well3,672 53.0% Speak English less than very well19.0% of residents speak other language at home 2,539 73.9% Speak English very well895 26.1% Speak English less than very well
English speakers - Born in the United States 76.8% of residents of Beltsville speak English at home.
21.6% of residents speak Spanish at home 967 91.6% Speak English very well89 8.4% Speak English less than very well2.6% of residents speak other language at home 129 100.0% Speak English very well
English speakers - Native, born elsewhere 55.1% of residents of Beltsville speak English at home.
39.3% of residents speak Spanish at home 108 64.3% Speak English very well60 35.7% Speak English less than very well1.9% of residents speak other language at home 8 100.0% Speak English very well
English speakers - Foreign-born 17.3% of residents of Beltsville speak English at home.
48.0% of residents speak Spanish at home 849 20.9% Speak English very well3,206 79.1% Speak English less than very well34.0% of residents speak other language at home 1,985 69.1% Speak English very well889 30.9% Speak English less than very well
White (Caucasian) - Speak only English Native:
86.8% (3,080)Foreign-born:
29.0% (129)
White (Caucasian) - Speak another language Native:
12.9% (457)Foreign-born:
72.7% (323)
Black or African American - Speak only English Native:
90.7% (2,823)Foreign-born:
36.5% (972)
Black or African American - Speak another language Native:
10.1% (314)Foreign-born:
63.7% (1,697)
Asian - Speak only English Native:
50.6% (121)Foreign-born:
10.3% (107)
Asian - Speak another language Native:
43.2% (103)Foreign-born:
88.9% (929)
Other race - Speak only English Native:
16.0% (406)Foreign-born:
2.1% (73)
Other race - Speak another language Native:
83.9% (2,124)Foreign-born:
98.1% (3,418)
Two or more races - Speak only English Native:
45.8% (329)Foreign-born:
29.7% (177)
Two or more races - Speak another language Native:
57.2% (410)Foreign-born:
68.2% (405)
White alone - Speak only English Native:
95.3% (3,018)Foreign-born:
55.6% (144)
White alone - Speak another language Native:
4.5% (142)Foreign-born:
45.8% (118)
Hispanic or Latino - Speak only English Native:
19.9% (714)Foreign-born:
2.0% (85)
Hispanic or Latino - Speak another language Native:
79.8% (2,862)Foreign-born:
98.3% (4,147)
Foreign-born residents in Beltsville 8,500 residents are foreign born (24.7% Latin America , 8.5% Africa , 5.6% Asia ).
This city:
43.6%Maryland:
15.7%
Marital status for residents in Beltsville Marital status - White (Caucasian) population 15 years and over
Males 17.3% Never married58.7% Now married0.9% Separated16.6% Widowed6.5% DivorcedFemales 18.7% Never married35.7% Now married0.6% Separated30.8% Widowed14.1% DivorcedWomen who gave birth in the past 12 months Now married:
81.7% (42)Unmarried:
18.3% (9)
Women who did not give birth in the past 12 months Now married:
33.8% (137)Unmarried:
66.2% (268)
Marital status - Black or African American population 15 years and over
Males 45.4% Never married47.1% Now married0.0% Separated3.5% Widowed3.9% DivorcedFemales 35.0% Never married36.7% Now married1.4% Separated15.0% Widowed12.0% DivorcedWomen who gave birth in the past 12 months Now married:
100.0% (49)Unmarried:
0.0% (0)
Women who did not give birth in the past 12 months Now married:
40.2% (543)Unmarried:
59.8% (806)
Marital status - Asian population 15 years and over
Males 34.0% Never married62.1% Now married0.0% Separated1.7% Widowed2.1% DivorcedFemales 25.4% Never married65.7% Now married0.0% Separated8.9% Widowed0.0% DivorcedWomen who did not give birth in the past 12 months Now married:
52.0% (138)Unmarried:
48.0% (128)
Marital status - Other race population 15 years and over
Males 48.9% Never married42.2% Now married2.1% Separated2.4% Widowed4.4% DivorcedFemales 44.8% Never married43.7% Now married0.6% Separated0.0% Widowed10.8% DivorcedWomen who gave birth in the past 12 months Now married:
48.5% (70)Unmarried:
51.5% (74)
Women who did not give birth in the past 12 months Now married:
44.9% (780)Unmarried:
55.1% (958)
Marital status - Two or more races population 15 years and over
Males 60.7% Never married25.4% Now married11.1% Separated0.0% Widowed2.8% DivorcedFemales 49.5% Never married40.3% Now married0.0% Separated5.6% Widowed4.7% DivorcedWomen who gave birth in the past 12 months Now married:
100.0% (18)Unmarried:
0.0% (0)
Women who did not give birth in the past 12 months Now married:
29.1% (106)Unmarried:
70.9% (260)
Marital status - White alone, not Hispanic / Latino population 15 years and over
Males 16.0% Never married56.4% Now married1.1% Separated19.9% Widowed6.6% DivorcedFemales 18.5% Never married34.5% Now married0.0% Separated32.3% Widowed14.7% DivorcedWomen who gave birth in the past 12 months Now married:
66.7% (21)Unmarried:
33.3% (10)
Women who did not give birth in the past 12 months Now married:
29.7% (85)Unmarried:
70.3% (201)
Marital status - Hispanic or Latino population 15 years and over
Males 48.2% Never married42.9% Now married3.0% Separated1.9% Widowed4.0% DivorcedFemales 44.1% Never married44.2% Now married1.0% Separated1.6% Widowed9.1% DivorcedWomen who gave birth in the past 12 months Now married:
65.8% (133)Unmarried:
34.2% (69)
Women who did not give birth in the past 12 months Now married:
43.8% (922)Unmarried:
56.2% (1,184)
Ancestries in Beltsville
482 3.5% African370 2.7% Haitian314 2.3% Irish296 2.2% Nigerian292 2.1% German262 1.9% American262 1.9% Ethiopian243 1.8% English182 1.3% Ghanaian146 1.1% Jamaican135 1.0% Italian99 0.7% Trinidadian and Tobagonian84 0.6% European70 0.5% Polish70 0.5% Guyanese65 0.5% Brazilian59 0.4% Scottish53 0.4% Russian53 0.4% Sierra Leonean49 0.4% British West Indian34 0.2% Danish33 0.2% Eastern European32 0.2% Canadian32 0.2% Swedish29 0.2% Armenian27 0.2% Slovak25 0.2% Bulgarian23 0.2% Finnish20 0.1% Ugandan19 0.1% Austrian16 0.1% Jordanian15 0.1% Latvian15 0.1% Slovene14 0.1% Egyptian14 0.1% Norwegian14 0.1% Liberian11 0.08% Pennsylvania German11 0.08% Lithuanian11 0.08% Scotch-Irish10 0.07% Ukrainian10 0.07% West Indian8 0.06% Belgian4 0.03% Welsh3 0.02% Dutch1 0.01% British
Geographical mobility in Beltsville Same house 1 year ago 3,768 89.2% White (Caucasian)5,359 94.2% Black or African American30 98.9% American Indian / Alaska Native1,166 88.3% Asian6,008 89.9% Other race1,192 88.6% Two or more races3,097 89.3% White alone, not Hispanic / Latino7,849 90.2% Hispanic or LatinoMoved within same county 77 1.8% White / Caucasian198 3.5% Black or African American74 5.6% Asian270 4.0% Other race55 4.1% Two or more races35 1.0% White alone, not Hispanic / Latino346 4.0% Hispanic or LatinoMoved within same state 300 7.1% White / Caucasian44 0.8% Black or African American33 2.5% Asian362 5.4% Other race5 0.4% Two or more races278 8.0% White alone, not Hispanic / Latino410 4.7% Hispanic or LatinoMoved from different state 73 1.7% White / Caucasian119 2.1% Black or African American25 1.9% Asian13 0.2% Other race28 2.1% Two or more races63 1.8% White alone, not Hispanic / Latino43 0.5% Hispanic or LatinoMoved from abroad 21 0.5% White19 1.4% Asian154 2.3% Other race209 2.4% Hispanic or Latino
Children Nativity (place of birth) in Beltsville
Children under 6 years - Living with two parents Both parents native 165 100.0% NativeBoth parents foreign-born 537 92.2% Native45 7.8% Foreign-bornOne native, one foreign-born parent 305 100.0% NativeChildren under 6 years - Living with one parent Native parent 118 99.4% Native1 0.6% Foreign-bornForeign-born parent 277 59.2% Native191 40.8% Foreign-bornChildren 6 to 17 years - Living with two parents Both parents native 64 98.8% Native1 1.2% Foreign-bornBoth parents foreign-born 1,599 88.3% Native212 11.7% Foreign-bornOne native, one foreign-born parent 306 100.0% NativeChildren 6 to 17 years - Living with one parent Foreign-born parent 1,092 59.4% Native748 40.6% Foreign-born
Grandparents responsible for own grandchildren in Beltsville
Grandparents (30 to 59 years) White / Caucasian 6 100.0% Not responsible for grandchildrenBlack or African American 74 93.7% Responsible for grandchildren5 6.3% Not responsible for grandchildrenOther race 46 18.7% Responsible for grandchildren202 81.3% Not responsible for grandchildrenTwo or more races 32 100.0% Responsible for grandchildrenHispanic or Latino 44 16.4% Responsible for grandchildren222 83.6% Not responsible for grandchildrenGrandparents (60 years and over) White / Caucasian 40 51.9% Responsible for grandchildren37 48.1% Not responsible for grandchildrenBlack or African American 19 14.1% Responsible for grandchildren114 85.9% Not responsible for grandchildrenOther race 52 23.6% Responsible for grandchildren170 76.4% Not responsible for grandchildrenTwo or more races 4 9.3% Responsible for grandchildren42 90.7% Not responsible for grandchildrenHispanic or Latino 48 18.5% Responsible for grandchildren213 81.5% Not responsible for grandchildren